Visual Dashboard: Performing Statistical Analyses with Visual Tools
‹View Table of Contents
Open Canvas, Save, Send Output To
Open Canvas
Open an existing Visual Dashboard canvas by selecting the Open icon on the Canvas Tools Toolbar or right clicking on the canvas to open the canvas Options dialog. Epi Info 7 includes several sample canvas files such as the Oswego.cvs7 canvas.

Figure 8.63: Visual Dashboard toolbar, with Open icon circled
The browse arrow opens a dialog to navigate to a saved canvas file, if it is not in the Quick Access List.
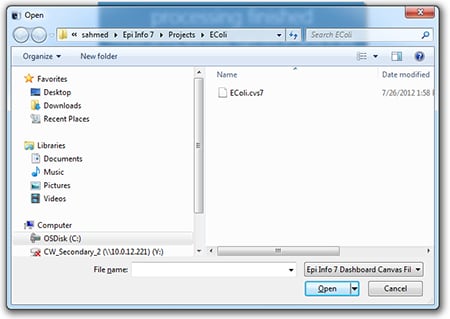
Figure 8.64: Open a Canvas
- Select the location of the canvas file. The file can be identified by the file name extension (.cvs7).
- Click Open. The canvas appears in Visual Dashboard, connects to the data source, and displays the latest results.
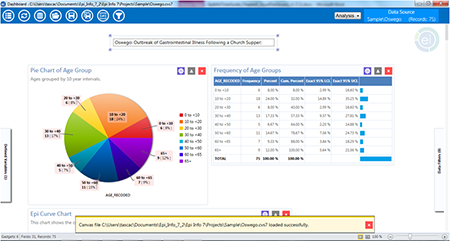
Figure 8.65: Opened canvas
The yellow message at the bottom of the screen confirms that the canvas loaded successfully. You can also click the open file folder icon in the top left corner of the canvas for quick access to saved canvas files.
Save Canvas
The current canvas including data source, gadgets, filters, and user-defined variables can be saved and reused later. Saved canvases may be opened later with the Visual Dashboard tool. This will allow you to reconnect to the data source without having to manually apply the filters again.
To save a canvas, right click on the canvas and select Save Canvas. You can also click the Save icons at the top left corner of the canvas.
- If the canvas was previously saved and named, this will overwrite the existing file.
- If the canvas has never been saved, you will be prompted for a file name and have the opportunity to change the file location.

Figure 8.66: Visual Dashboard toolbar, with Save icon circled
Save Canvas As
The Save Canvas As option allows the canvas to be saved for the first time, or saved to a new location.
- Right click on the canvas and select Save Canvas As, or click the Save As icon in the top left corner of the canvas. The Save As dialog box appears.
- Select a location to save the canvas to and enter a File Name.
- lick Save.

Figure 8.67: Visual Dashboard toolbar, with Save As icon circled
Note: If a file with the same name already exists, a confirmation message will appear, asking if you would like to replace the existing file.
Save Visual Dashboard HTML
Output from the gadgets may be saved as an HTML document. To save the current output:
- Right click on the canvas, select Save Output as HTML. The Save As dialog box appears.
- Select a location to save the canvas output and enter a File Name. The default location for saving output is to the Epi Info 7Output folder.
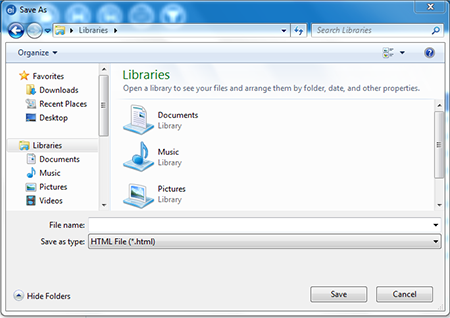
Figure 8.68: Save output as HTML
- Click the Save button. The output automatically opens in the Web browser.
Note: HTML documents can only be opened in a Web browser and cannot be used to re-create the Visual Dashboard canvas.
Send Visual Dashboard Output To
Outputs from Visual Dashboard may be viewed in either Microsoft Word or Microsoft Excel with the Send Output To option. You must have Microsoft Word or Microsoft Excel installed to use either option.
Microsoft Excel
- Right click on the canvas, select Send Output To > Microsoft Excel.
- The Visual Dashboard output opens in Microsoft Excel.
Note: Charts are not included with the output when sent to Excel.
Microsoft Word
- Right click on the canvas, select Send Output To > Microsoft Word.
- The Visual Dashboard output opens in Microsoft Word as an .html formatted Web document. If saved in this format, charts are saved separately to a sub-folder. To share this .html file, remember to share the subfolder as well. Alternatively, change the format to a Microsoft Word .docx format so the charts are included with the file as embedded images.