Nutritional Anthropometry: Collecting and Analyzing Nutritional Data
‹View Table of Contents
NutStat Growth Charts in Visual Dashboard
Based on a child’s measurements, a growth chart can be created in Visual Dashboard to track the progress of a particular child (Displaying multiple children on a single chart is not an available option). The NutStat growth charts can be accessed in Visual Dashboard by right clicking on the canvas and then selecting Add Nutstat growth chart.
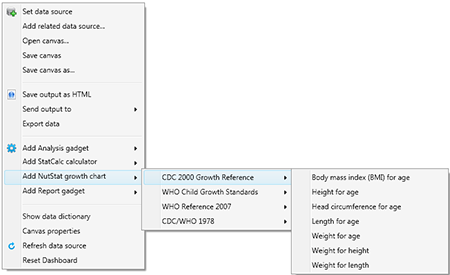
Figure 11.5: Growth Chart Types
There are four growth references available for use: CDC 2000 Growth Reference, WHO Child Growth Standards, WHO Reference 2007, and CDC/WHO 1978. Each growth reference contains different options for creating a growth chart and each chart requires the associated data.
Note: The Nutrition project does not contain example data to create all chart types.
Loading Nutritional Data
Prior to creating a growth chart, nutritional data must be loaded into the dashboard. Follow the steps below to load the data associated with the Nutrition project into the dashboard.
- From the Epi Info™ main menu, click the Visual Dashboard button or select Tools > Analyze Data > Visual Dashboard. The Dashboard tool appears.
- Right-click on the dashboard canvas. A context menu appears.
- Select Set Data Source from the context menu. The Select Data Source dialog box appears.
- Click the ellipses next to the Data Source text box. A file open dialog box appears.
- Navigate to the Epi Info™ projects folder.
- Open the Nutrition folder within the projects folder.
- Select the Nutrition project. Click Open.
- In the Select Data Source dialog box, select the PatientVisits form. Click OK. The data is loaded on the dashboard.
After the PatientVisits form is loaded, the dashboard will have cached the data in the computer’s memory. Based on the data, various types of statistical tools or gadgets can be added to the canvas to display useful information to the user. For information regarding the statistical tools and gadgets available, reference the Visual Dashboard section of this user guide.
Creating a Growth Chart
There are many growth charting options available under Add NutStat growth chart in Visual Dashboard. The available growth chart types are dependent on each growth reference and require the necessary project data.
Note: The Nutrition project does not contain example data for every growth chart type.
The following examples demonstrate how to create a growth chart with data contained in the Nutrition project. All growth charts created in Visual Dashboard use similar processes outlined in the examples in the following tabs.
BMI for Age
The following example demonstrates how to create a BMI for Age growth chart using the CDC 2000 Growth Reference. The growth chart will demonstrate how the patient’s BMI compares to the CDC 2000 Growth Reference by age.
- Right-click on the dashboard canvas. A context menu appears.
- Select Add NutStat Growth Chart > CDC 2000 Growth Reference > Body Mass Index (BMI) for Age from the list of options in the context menu. A growth chart gadget appears on the canvas.
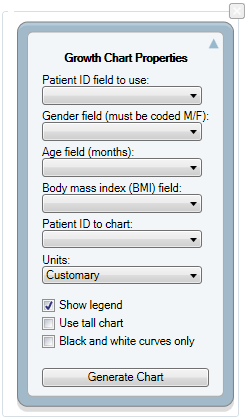
Figure 11.6: Growth Chart Gadget
The gadget must specify what fields to use for the Patient ID, Gender, Age, Body mass index (BMI), and the Patient ID to chart.
- Select VisitPatientID for Patient ID field to use.
- Select VisitSex for Gender field (must be coded M/F).
- Select AgeMonths for Age field (months).
- Select BMI for Body mass index (BMI) field.
- Select 1 for Patient ID to chart.
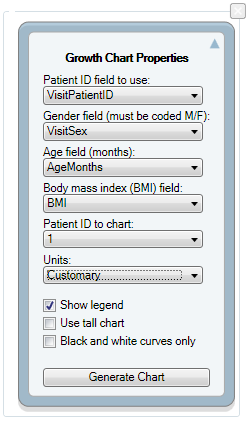
Figure 11.7: Completed Growth Chart Gadget
The checkboxes below the drop-down lists allow for customizing the appearance of the graph.
- Show legend – adds a legend to the graph (checked by default).
- Use tall chart – extends the vertical height of the growth chart.
- Black and white curves only – all curves appear in black and white (color is removed).
- Click the Generate Chart button. The growth chart appears on the canvas.
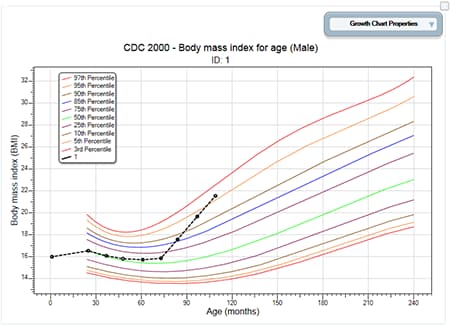
Figure 11.8: BMI for Age Growth Chart
- To collapse the panel and show only the chart, click the up arrow at the top right corner of the properties panel. Click the down arrow to expand the properties panel.
Height for Age
The following example demonstrates how to create a Height for Age growth chart using the CDC/WHO 1978 growth reference. The growth chart will demonstrate how the patient’s height compares to CDC/WHO 1978 standards by age.
- Right-click on the dashboard canvas. A context menu appears.
- Select Add NutStat Growth Chart > CDC/WHO 1978> Height for Age from the list of options in the context menu. A growth charting gadget appears on the canvas.
- Select VisitPatientID for Patient ID field to use.
- Select VisitSex for Gender field (must be coded M/F).
- Select AgeMonths for Age field (months).
- Select HeightInches for Height field.
- Select 1 for Patient ID to chart.
- Click the Generate Chart button. The chart appears as shown below.
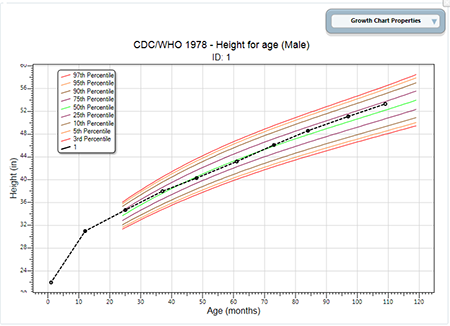
Figure 11.9: Height for Age Growth Chart
- To collapse the panel and show only the chart, click the up arrow at the top right corner of the properties panel. Click the down arrow to expand the properties panel.
Length for Age
The following example demonstrates how to create a Length for Age growth chart using the WHO Child Growth Standards. The growth chart will demonstrate how the patient’s length compares to WHO Child Growth Standards by age.
Note: The Length for Age chart requires similar inputs as the Height for Age chart but additionally requires the user to check the Recumbent check box in the PatientVisits form during data entry.
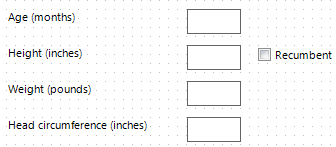
Figure 11.10: Recumbent checkbox in PatientsVisit form during data entry
- Right-click on the dashboard canvas. A context menu appears..
- Select Add NutStat Growth Chart > WHO Child Growth Standards > Length for Age from the list of options in the context menu. A growth charting gadget appears on the canvas.
- Select VisitPatientID for Patient ID field to use.
- Select VisitSex for Gender field (must be coded M/F).
- Select AgeMonths for Age field (months).
- Select HeightInches for Length field. (If recumbent was checked during data entry, the height field converts to length).
- Select 1 for Patient ID to chart.
- Click the Generate Chart button. The chart will appear as shown below.
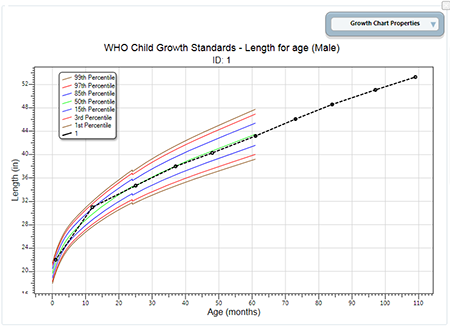
Figure 11.11: Length for Age Growth Chart
- To collapse the panel and show only the chart, click the up arrow at the top right corner of the properties panel. Click the down arrow to expand the properties panel.
It is important to note some aspects of the growth charting capabilities. First, there must be a patient ID field to identify a single person within the database. In the examples above, all of the records from the patient with an ID value of 1 were charted. Second, the field storing gender information must code that information as M and F. The dashboard has data recoding capabilities that can be used to change gender information to other formats. No matter what format represents male and female, it can be converted. In the examples above, no conversion was necessary. Third, the field storing the age values must be in months. Similar to gender, the dashboard can convert ages stored in days and years into months. Fourth, all properties can be changed in order to re-generate the chart. However, changing the chart inputs and growth references is subject to the data available and the available chart types. Finally, the growth charts can be used with non-Epi Info™ 7 projects, including projects that do not have the z-scores and percentiles already calculated.