Visual Dashboard: Performing Statistical Analyses with Visual Tools
Visual Dashboard
Analysis Gadgets
Word Cloud
The Word Cloud option provides a visual snapshot of terms used in the current data set. You can select a variable to display (parse). Word Cloud returns a graphic of words and terms used in that field, with font sizes illustrating the relative use of that term compared to others in the search. This gadget is most valuable for analyzing text fields and multi-line text fields. For example, it can condense a field with patients’ chief complaints from verbose responses to just the most frequently used words. Word Cloud can also analyze other text-based fields such as Legal Value, Comment Legal, and Codes fields.
The gadget allows you to exclude frequent mundane words from the search with an editable list of default words for Epi Info™ to ignore (i.e., exclude from the analysis): a am an and are as at but by for her his I if in is it me my not of on or our pm that the their this to us was we were will with would you your.
- Select the Sample.PRJ Data Source. Open the Surveillance form from the Data Source Explorer menu.
- Right click on the canvas and select Add Analysis Gadget >Word Cloud. The Word Cloud gadget configuration window opens to the Variables property panel.
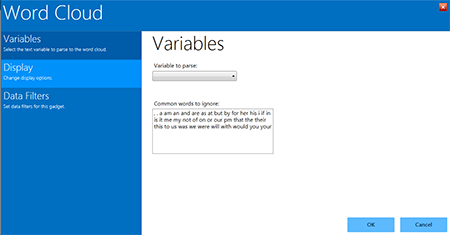
Figure 8.29: Word Cloud gadget
- Choose the desired variable on which to parse words from the drop down list. For this example, select Race. The Common words to ignore can remain as listed in the default.
- Click OK. The results appear on the Visual Dashboard canvas. The font size for each word in the selected variable group denotes the use of that word relative to the others in the group. In this example, then, the most common race can be deduced to be “White,” followed by “Black.”
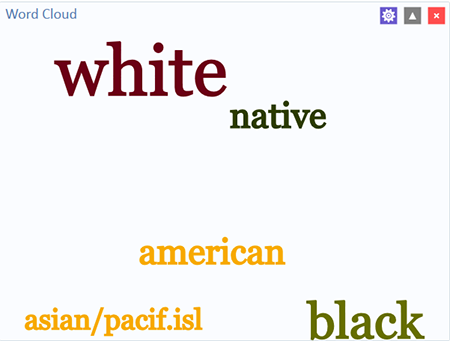
Figure 8.30: Word Cloud results