Visual Dashboard: Performing Statistical Analyses with Visual Tools
Visual Dashboard
Analysis Gadgets
Means
The Means gadget calculates the average for a continuous numeric variable. A Yes/No field returns numeric values (Yes=1, No=0), which allows the Means gadget to calculate the proportion of respondents answering yes. For this situation, Analysis Gadget > Means, has two formats:
- If only one variable is selected, the program produces a table similar to one produced by the Frequency option with descriptive statistics.
- If two variables are selected, the first variable contains the data to be analyzed and the second indicates how groups will be distinguished. The output of this format is a table similar to one produced by the M x N/ 2 x 2 table with descriptive statistics.
- Select the Sample.PRJ Data Source. Open the Oswego form from the Data Source Explorer menu.
- Click OK.
- Right click on the canvas and select Add Analysis Gadget > Means. The Means Properties gadget configuration window opens to the Variables property panel.
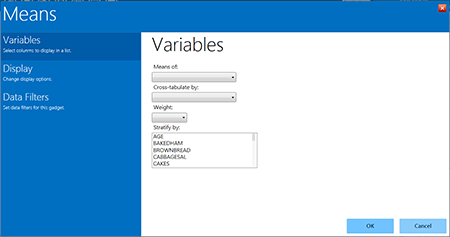
Figure 8.39: Means gadget
- From the Means Of drop-down list, select Age.
- Other choices that can be used in the Variables option include:
- The Cross-tabulate by drop-down list contains a variable to help determine if the means of a group are equal.
- The Weight drop-down list contains a variable for weighted analysis.
- The Stratify by list contains a variable to act as a grouping variable.
These options are not used in this example.
- Click OK. The results are displayed on the canvas.
Additional choices for the means gadget are available in the Display option and include:
- Output columns to display–specifies the columns to include in the current analysis.
- Decimals to display–specifies the number of decimals that will be displayed in the results (possible values range from 0–4 and are set to 2 by default). This option does not apply to the descriptive statistics produced when a cross-tabulate variable is used. The descriptive statistics are always displayed to 4 decimal places.
- The Display ANOVA statistics checkbox specifies whether to display the analysis of variance statistics. This option is selected by default. If you are working with large data sets and the ANOVA statistics are not required, performance may be improved by turning off (un-checking) this feature.

Figure 8.40: Means table
The mean age of individuals in the data set is 36.8.