Visual Dashboard: Performing Statistical Analyses with Visual Tools
‹View Table of Contents
Data Dictionary
Show Data Dictionary
The Data Dictionary displays form(s) and defined variables for the current Data Source. Fields or variables are sorted and displayed by page number in the form. Defined variables appear at the end of the listing. Information retrieved from the form includes Field Name, Prompt, Form, Page, Tab, Data Type, Epi Info Field Type, and Table.
- Right click on the canvas and select Show data dictionary.
- The Data Dictionary is displayed on the canvas.
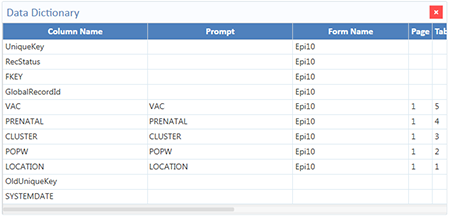
Figure 8.96: Data Dictionary view
The scroll bar at the bottom of the Data Dictionary can be used to view the rest of the window. Column values for Prompt, as well as Data Type and Epi Field Type (both of which are viewable when the user scrolls right) are developed when fields are created from the Field Definition dialog box discussed in Chapter 2: Form Designer.
- To open the Data Dictionary as an HTML page inside a web browser, hover over the Data Dictionary in the dictionary window, right click, and select Send Data Dictionary to Web Browser.
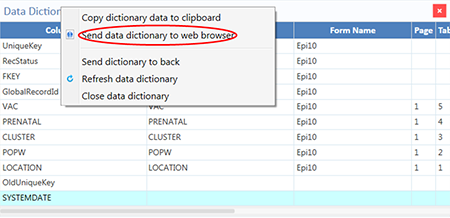
Figure 8.97: Option to send Data Dictionary to Web
From the browser, the data can be printed using the print tool within the respective web browser, or saved with the file tool.
- You can export the data directly to an Excel spreadsheet by right clicking over the table in the web page to show the pop-up menu and selecting Export to Microsoft Excel.
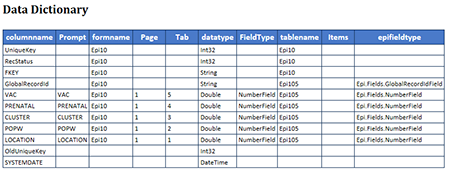
Figure 8.98: Data Dictionary Export to HTML
- Close the browser window to exit the Data Dictionary.
Note: The Data Dictionary can be refreshed at any time to display the most current data. Right click on the Data Dictionary and select Refresh Data Dictionary.