Visual Dashboard: Performing Statistical Analyses with Visual Tools
‹View Table of Contents
Selecting a Data Source
Selecting a Data Source
Before beginning analysis in Visual Dashboard, select a data source. Data from the following sources can be analyzed in Visual Dashboard: Epi Info™ 7 project files, ASCII Text files, Microsoft Excel, Microsoft Access, Microsoft SQL Server, MySQL, and PostgreSQL. Follow one of the first three steps below to select a data source:
- Click the arrow in the blue box next to Set a data source now when you open a new canvas.
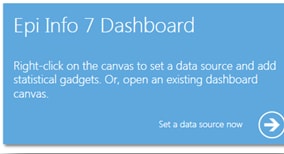
Figure 8.7: Set a data source now option
- You can also click on the Set Data Source icon from the bar at the top of the screen.

Figure 8.8: Visual Dashboard toolbar, with Set Data Source icon circled
- You can also right click on the canvas and select Set Data Source from the Options menu.
- After selecting the Set Data Source option, the Select Data Source dialog box appears. Select a Database Type, Data Source, and form to open data in Visual Dashboard.
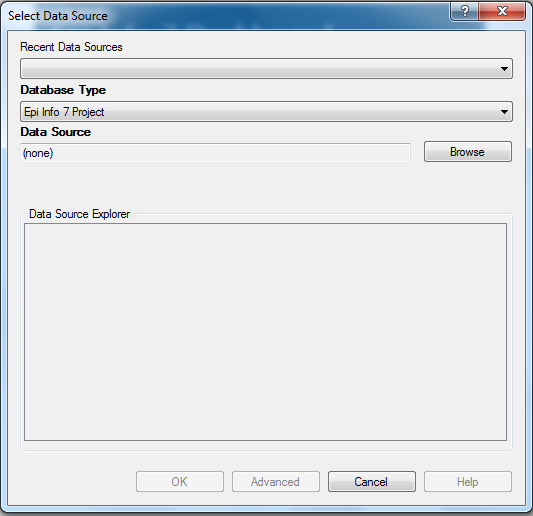
Figure 8.9: Select Data Source dialog box
- The Recent Data Sources field provides a list of recently accessed databases in Classic Analysis or Visual Dashboard. By selecting one of the data sources available on the list, you do not need to provide Database Type or Data Source information. If you are reading an Epi Info™ 7 project file from the Data Source section, all available forms will appear in the Data Source Explorer box.
- The Database Type field indicates the database file to be loaded (.PRJ, .MDB, .XLS). Specify the data format for the data being accessed. Unless otherwise specified, output files are stored in this destination folder as well.
- The Data Source field indicates the file location/path. If you use a SQL Server database, the Data Source field will require server and database names.
- The Data Source Explorer field allows you to select a form in your project. This reads the data table associated with your form.
- The Advanced mode allows the use of SQL queries to select the data source. Only SELECT statements are allowed.
Read an Epi InfoTM 7 Project File
- Execute the Set a Data Source option using one of the first three steps previously noted (click Set a Data Source now arrow, click the Set a Data Source icon, or right click and select Set a Data Source). The Select Data Source dialog box appears.
- From the Database Type drop-down list, select Epi Info 7 Project.
- Click Browse next to the Data Source field. The Epi Info 7 Project folder will appear.
- Browse for the project file you would like to read into Visual Dashboard. If your projects are in folders, you will have to first open the correct folder and then open the desired project (.PRJ) file. Some sample projects, such as Ecoli.PRJ, are included with the installation of Epi Info™ 7.
- Click Open.
- The Data Source Explorer box populates with a list of all the forms that are associated with the project. Select a form.
- Click OK. The record count and data source appear in the toolbar at the top right of the Visual Dashboard canvas.
- Click OK. The “Processing Finished” message appears, indicating that the system has cached the data locally. Data from the two tables can now be used for analysis.
Read a Microsoft Excel File
- Click on the Set a Data Source now arrow. The Select Data Source dialog box appears.
- From the Database type drop-down list, select either MS Excel 97-2003 Workbook or MS Excel 2007 Workbook.
- Click Browse next to the Data Source field. The Open Existing File dialog box will appear.
- Enter the filename and path to open your workbook or click Browse to search for the MS Excel workbook (.xls or .xlsx).
- Click Open. The First row contains header information checkbox is selected by default. If this option is unchecked, data will import without column headings.
- Click OK. Select a worksheet from the list provided in the Data Source Explorer window.
- Click OK. The record count and data source appear in the menu bar at the top right of the Visual Dashboard canvas.
Read a Microsoft Access File
- Click on the Set a Data Source now arrow. The Select Data Source dialog box appears.
- From the Database Type drop-down list, select either MS Access 2002-2003 (.mdb) or MS Access 2007(.accdb).
- Click Browse next to the Data Source field. The Open Microsoft Access File dialog box will appear.
- Enter the filename and path to open your file or click Browse to search for the MS Access file (.mdb or .accdb). If the file is password protected, enter the password.
- Click OK.
- Select a data table from the list provided in the Data Source Explorer window.
- Click OK. The record count and data source appear in the menu bar at the top right of the Visual Dashboard canvas.
Read a CSV (ASCII) File
- Click on the Set a Data Source now arrow. The Select Data Source dialog box appears.
- From the Database Type drop-down list, select CSV File.
- Click Browse next to the Data Source field.
- Click Browse in the Flat File location dialog box to search the directory.
- Select the directory containing the CSV file to be read.
- Click OK. Note that the First row contains header information box is checked by default. If the first row of the file does not contain header information, deselect the checkbox. If this option is unchecked, data will be imported without column headings.
- Select the file name from the list provided in the Data Source Explorer window.
- Click OK. The record count and data source appear in the menu bar at the top right of the Visual Dashboard canvas.
Read a Microsoft SQL Server Database
Note: You must have Microsoft SQL Server installed on your computer or you must have access to a server over a network to perform this function.
- Click on the Set a Data Source now arrow. The Select Data Source dialog box appears.
- From the Database Type drop-down list, select Microsoft SQL Server Database.
- Click Browse next to the Data Source field.
- The Connect to SQL Server database dialog box opens. Specify the Server name and Database name to connect to a SQL Server database.
- The Use Windows Authentication radio button is selected by default. You can use SQL Server Authentication by checking the corresponding radio button and then entering Login and Password credentials.
- Click OK.
- From the list provided in the Data Source Explorer, select a data table.
- Click OK. The record count and data source appear in the menu bar at the top right of the Visual Dashboard canvas.
Read a MySQL Server Database
Note: You must have MySQL Server installed on your computer or you must have access to a server over a network to perform this function.
- Click on the Set Data Source arrow. The Select Data Source dialog box appears.
- From the Database Type drop-down list, select MySQL Database.
- Click Browse next to the Data Source field.
- The Connect to MySQL database dialog box appears. Enter the Server name, Database name, Username and Password to connect to the MySQL database. You can select < Browse for more > from the Server name drop-down list to select a MySQL server instance in your network.
- Click OK.
- From the list provided in the Data Source Explorer, select a data table.
- Click OK. The record count and data source appear in the menu bar at the top right of the Visual Dashboard canvas.
Add a Related Data Source
Analysis in Visual Dashboard may be performed on data from multiple data sources. The Add a Related Data Source option links tables or forms using a common identifier. The form/table to be linked requires a key field to relate the records of the forms/tables together. If the forms were created in Form Designer, Visual Dashboard can establish a relationship by using the Global Record ID (GLOBALRECORDID)of the first form and the Foreign Key (or [FKEY) (] column of the related form as the key fields. The example below demonstrates how to add a related data source.
Epi Info™ 7 contains a related database in the Sample.PRJ file with two forms: The form named Surveillance is the primary or parent form. It has three related or child forms named RHepatitis, RLyme, and RMeningitis. In the example below, we relate the Surveillance parent form to its child form, RHepatitis.
- Follow the steps to Set a Data Source and select the Sample.PRJ Data Source. Open Surveillance.
- Right click on the canvas and select Add related data source. The Select Data Source dialog box opens.
- Follow the steps to Set a Data Source and select the Sample.PRJ Data Source again.
- Select RHepatitis from the list of forms in the Data Source Explorer. The Child Key Field drop-down list populates.
- From the Parent Key Field drop-down list, select GlobalRecordId.
- Select FKEY from the Child Key Field drop-down list. FKEY is the Foreign Key in the child form that matches the GlobalRecordId of the record in the parent form.
- Check the “Use Unmatched (ALL)” checkbox to include all records from the primary form whether or not there are matching records in the related data source. Uncheck the “Use Unmatched (ALL)” checkbox to force the resulting data to include only those records represented by keys that match in both tables.
- Click OK. The “Processing Finished” message appears, indicating that the system has cached the data locally. Data from the two tables can now be used for analysis.
Note: You can only perform a one-to-one analysis with a related table in Visual Dashboard. To perform a one-to-many analysis, please see the Classic Analysis section of this user guide.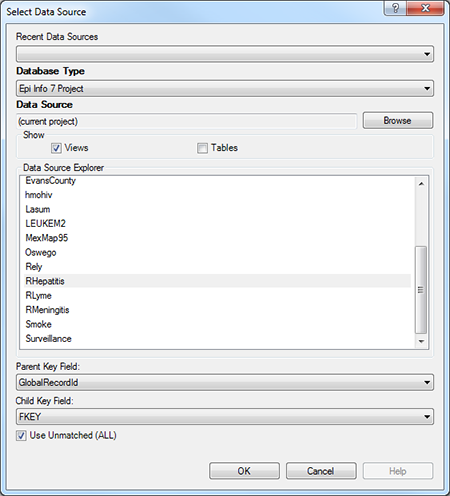
Figure 8.99: Add Related Data Source dialog box