Visual Dashboard: Performing Statistical Analyses with Visual Tools
Visual Dashboard
Analysis Gadgets
Line List
Line List Introduction
The Line List option creates a list of the current dataset. This allows you to view the details of the data in your current data source. You can select variables to display and then sort or group those variables accordingly. Line List supports adding groups or pages. All fields in a group or on a page will be displayed in such cases. This option is available at the bottom of the Variables to display list within the Line List Variables property panel (below the Fields list).
- Select the EColi.PRJ Data Source. Open the FoodHistory form from the Data Source Explorer menu.
- Right click on the canvas and select Add Analysis Gadget > Line list.
- The Line List gadget’s configuration window opens to the Variables property panel.
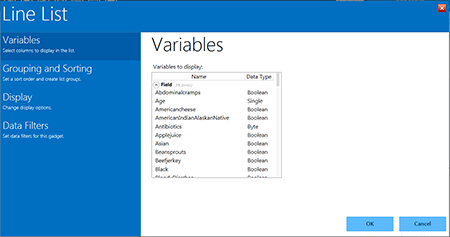
Figure 8.10: Line List Gadget
- To select multiple variables from Variables to display, hold down the Ctrl key and click on the variables you want to display. You can also hit Ctrl + A to select all variables at once.
- Click the OK button. The line list appears on the canvas. The graphic below illustrates the list with all variables selected.
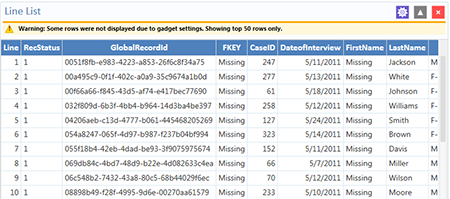
Figure 8.11: Generated Line List of all variables
Note that there is a yellow warning at the top of the output. By default, the line list will only show the top 50 rows. The row limit exists to improve performance when working with large datasets. The Max Rows to Display setting can be modified in the Display property panel, which is explained later.
Sorting Records
Sometimes it is important to have the records in a file arranged in a particular order, such as alphabetically by name, or numerically by age. There are two ways to sort the records: by clicking on the column name in the line list or by using the sort options in the Line List configuration window’s Sorting and Grouping property panel.
Sorting a List by Column Name
Follow the steps below to sort the list by Age.
- Select the EColi.PRJ Data Source. Open the FoodHistory form from the Data Source Explorer menu.
- Right click on the canvas and select Add Analysis Gadget > Line list.
- The Line List gadget’s configuration window opens to the Variables property panel.
- Select all variables from the List Variables to Display box by pressing Ctrl + A on your keyboard.
- Click OK.
- The Line List results appear on the Visual Dashboard canvas.
- Click on the Age column heading (you may have to scroll over to see the Age column). The records are displayed by Age in ascending order. The Age column header also turns red to indicate the data are currently sorted by that variable.
- To sort the column in descending order, click the Age column header again. The Age column header turns green to show it is sorted in descending order.
Sorting a List Using Line List Grouping and Sorting Properties
- Select the EColi.PRJ Data Source. Open the FoodHistory form from the Data Source Explorer menu.
- Right click on the canvas and select Add Analysis Gadget > Line list.
- The Line List gadget’s configuration window opens to the Variables property panel.
- Select all variables from List Variables to Display box by pressing Ctrl + A on your keyboard.
- Click OK.
- The Line List results appear on the Visual Dashboard canvas.
- The list data are not sorted in any particular order. To sort variables, first click on the gadget gear icon at the top of the Line List.
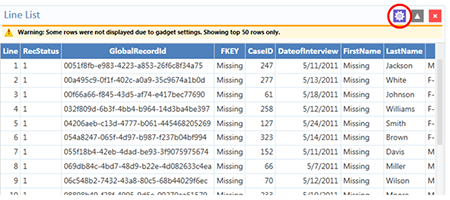
Figure 8.12: Line List with Gadget Configuration Icon Noted
- Select Grouping and Sorting in the configuration window and then select Sorting Method of Ascending or Descending.
- Double click the desired sort variable from the Available Variables list. You can select multiple variables on which to sort by double-clicking each one. With each double click operation, the selected variable will move to the Sort Order box.
- Double click on a variable in the Sort Order box to remove that sort variable from the list.
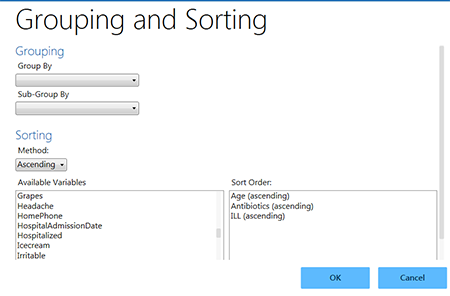
Figure 8.13: Line List Grouping and Sorting
- If you want to group the list by a particular field, select the field from the Group By drop-down list.
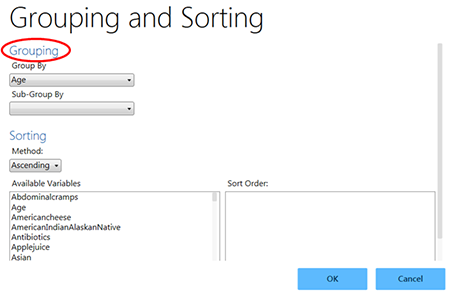
Figure 8.14: Line List/Grouping options
- Click OK. Visual Dashboard generates and displays a separate line list, grouped by the selected variable.
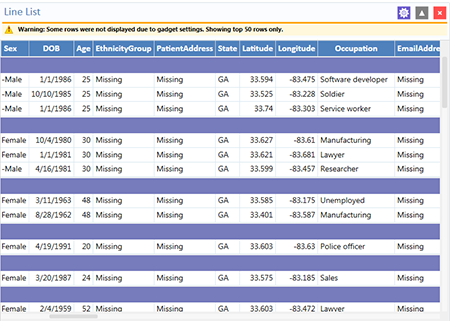
Figure 8.15: Line List with Grouping results
- You can hide a list from view by clicking on the arrow to the left of the list heading.
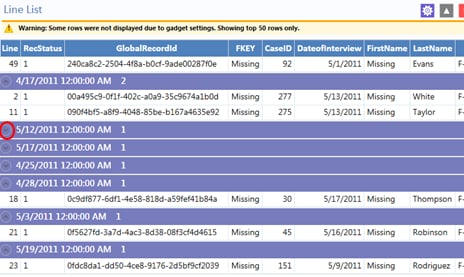
Figure 8.16: Line List hidden view, with circle indicating “hide” arrow
Remove Sort Criteria
Remove sort criteria by following the steps below.
- Right click on the Line List.
- Select Remove All Sort Criteria.
- The Line List will appear with the sort criteria removed.
Other Line List Properties
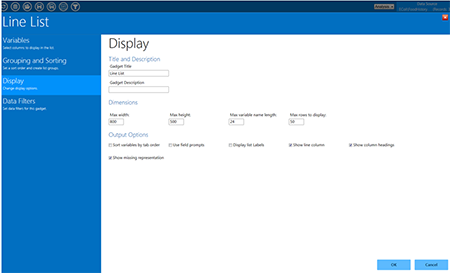
Figure 8.17: Line List Display options
Other options for the Line List gadget are available by selecting Display in the configuration window.
- The Max width indicates the maximum Line List display width in pixels.
- The Max height indicates the maximum Line List display height in pixels.
- The Max variable name length text box allows for the truncation of long column names in the list output. It is set to 24 by default.
- The Max rows to display text box allows the user to change the maximum number of rows that the line list gadget will display. It is set to 50 by default. A maximum of 2,000 rows may be displayed.
Output Options
(located at the bottom of the Display screen)
- The Sort variables by tab order checkbox forces the columns in the output to be sorted by their tab order.* It is not checked by default.
- The Use field prompts checkbox will use the field’s prompt as the column heading, rather than the field’s name.* It is not checked by default.
- The Display list labels checkbox will use the label value for option fields and comment legal fields rather than the underlying value stored in the database.*
* Note: These first three output options are available only when the Data Source is an Epi Info 7 project. If the Data Source is not an Epi Info 7 project, such as an Excel spreadsheet, these options have no effect.
- The Show line column option adds the Line column to the list and displays the line number when the checkbox is selected.
- The Show column headings option displays the line list column headings when the checkbox is selected.
- The Show missing representation option displays the word or symbol that represents a missing value for any field that does not have a value. By default, the word “Missing” is used, but other options include “Unknown”, “(.)” or another custom setting as specified in the Tools > Options > Analysis tab. If the checkbox is not selected, a field without a value will be left blank.
Exporting a Line List
Once the Line List is created, the following export options are available: Copy List Data to Clipboard, Send List Data to Web Browser, and Send List Data to Excel.
The next three steps explain how to Copy List Data to Clipboard.
- Right click on the Line List.
- Select Copy List Data to Clipboard.
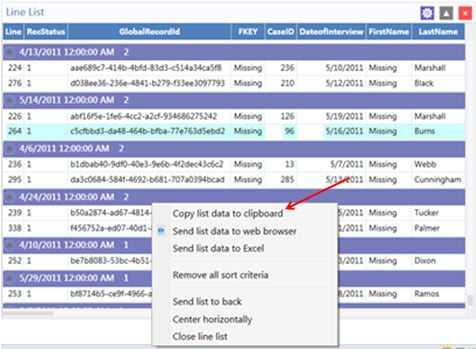
Figure 8.18: Copy list data to clipboard
- The data are now on the clipboard and may be exported.
The next three steps explain how to Send List Data to Web Browser.
- Right click on the Line List.
- Select Send List Data to Web Browser.
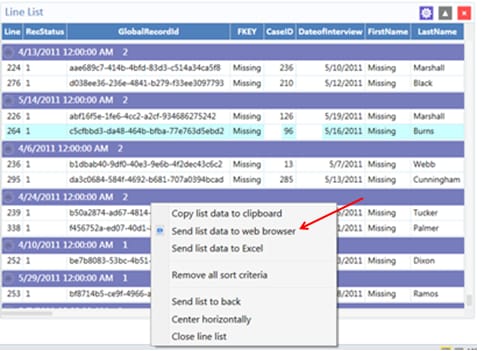
Figure 8.19: Send list data to web browser
- The data now appear in your default web browser.
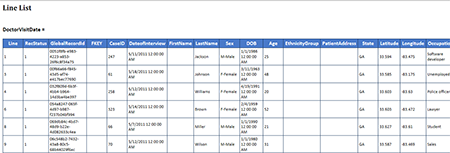
Figure 8.20: List Data in web browser
The next three steps explain how to Send List Data to Excel.
- Right click on the Line List.
- Select Send List Data to Excel.
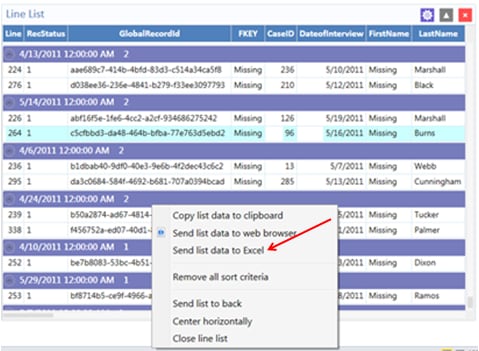
Figure 8.21: Send list data to Excel
- The list data appear in a Microsoft Excel spreadsheet.
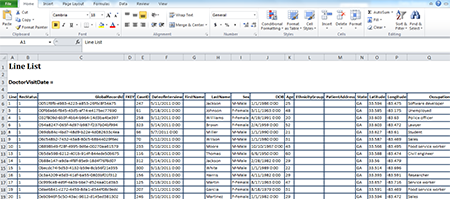
Figure 8.22: List Data in Excel
Note: You must have Microsoft Excel installed to use this feature.