Visual Dashboard: Performing Statistical Analyses with Visual Tools
Visual Dashboard
Analysis Gadgets
Combined Frequency
Introduction
The Combined Frequency option produces a table that illustrates the frequency and percentage of affirmative responses to check box and Yes-No fields contained within a group field (i.e., checked boxes are affirmative, as are “Yes” answers to Yes-No fields). All other field types are ignored. In the following example, the Demographic Information group contains a number of check box fields for the individual’s race and it allows you to “Check all that apply”.
- Select the EColi.PRJ Data Source. Open the FoodHistory form from the Data Source Explorer menu.
- Right click on the canvas and select Add Analysis Gadget > Combined frequency. The Combined Frequency gadget configuration window opens to the Variables property panel. The Variables to display list only shows Group variables.
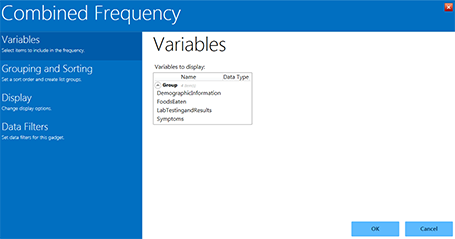
Figure 8.31: Combined Frequency gadget
- From the Variables to Display list under Group, select Symptoms.
- Click OK. The results appear on the Visual Dashboard canvas.
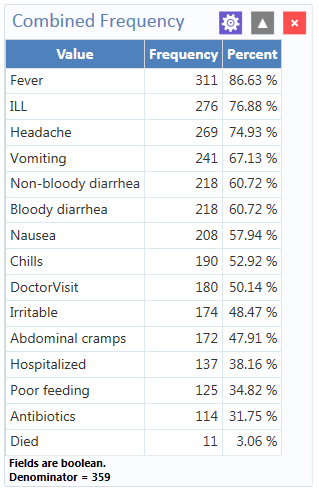
Figure 8.32: Combined Frequency results
Combined Frequency Advanced Options
To use the Combined Frequency advanced options:
- Select the EColi.PRJ Data Source. Open the FoodHistory form from the Data Source Explorer menu.
- Right click on the canvas and select Add Analysis Gadget > Combined Frequency. The Combined Frequency gadget configuration window opens to the Variables property panel.
- In the Variables options, select DemographicInformation from the Group field.
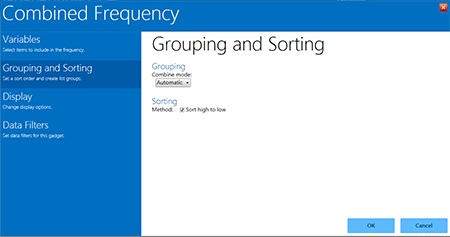
Figure 8.33: Combined Frequency Grouping and Sorting options
- Click Grouping and Sorting and select Automatic from the Combine Mode drop-down list. Here are the functions of each option in that drop-down:
- Boolean—use this mode for Yes/No and Checkbox fields, or if you wish for the fields in the group to be treated as such.
- Value to treat as true – This field appears when the Combine Mode is Boolean. The specified value is treated as the true or positive value and all other values are treated as false or negative values.
- Categorical—use this mode if your data are grouped according to similar characteristics in a way that shows the relative frequencies of each group or category.
- Automatic—will automatically determine the appropriate combination mode of either Boolean or Categorical.
- Boolean—use this mode for Yes/No and Checkbox fields, or if you wish for the fields in the group to be treated as such.
- The Sort High to Low checkbox is checked by default. This option will display the results sorted from highest group field frequency to the lowest.
- Click Display and mark your selection for Show Denominator. This option will display the total number of records in the results. The box is checked by default.
- Click OK. The Combined frequency results appear on the Visual Dashboard canvas.

Figure 8.34: Combined Frequency results with advanced options
The result displays the frequency and percentage of each symptom check box that is checked and each Yes-No field with a value of “Yes”. Note the denominator included at the bottom of the results window.