Maps: Visual Representation of Data by Location
PAGE 5 of 9
‹View Table of Contents
Adding a Data Layer
Epi Map offers the option to add Data Layers; that is, to use layering to create different map views and ways of viewing the related data. Epi Map offers four types of Data Layer:
- Choropleth – areas are shaded or colored in proportion to a measurement or variable
- Dot Density – dots show the presence of a feature, but not specific locations
- Case Cluster –coordinates of cases are shown clustered when zoomed out
- Spot Map – shows the coordinates of specific points of interest
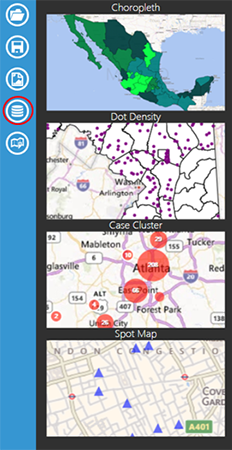
Figure 10.21: Data layer button and resulting list of options