Visual Dashboard: Performing Statistical Analyses with Visual Tools
Visual Dashboard
Introduction
Introduction to Visual Dashboard
Visual Dashboard is one of the Epi Info™ 7 analysis modules. The Visual Dashboard is designed to be intuitive and simple to use. With the use of gadgets, the need for programming code is minimized. Data can be selected, sorted, listed, or manipulated using the various gadgets in Visual Dashboard. The statistical analyses tools available in Visual Dashboard include frequencies, means, and more advanced statistical calculations (e.g., linear regression and logistic regression). Visual Dashboard has graphing functionality to display data as an Epi Curve, Pareto Chart, and several other bar and column charts.
Users can access Visual Dashboard from the Epi Info™ 7 main menu by clicking the Visual Dashboard button, or by selecting Dashboard from the main page menu of Enter once an Epi Info project has been loaded.
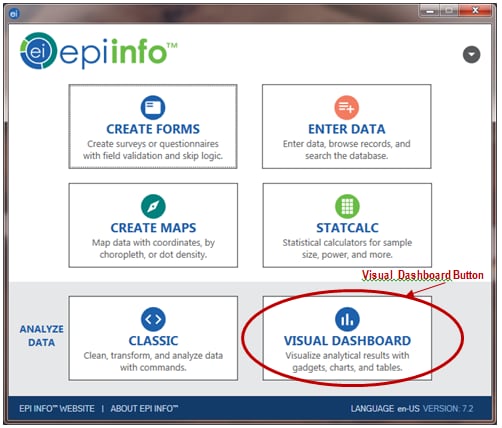
Figure 8.1: Epi Info™ 7 main menu, with Visual Dashboard button highlighted
Navigate
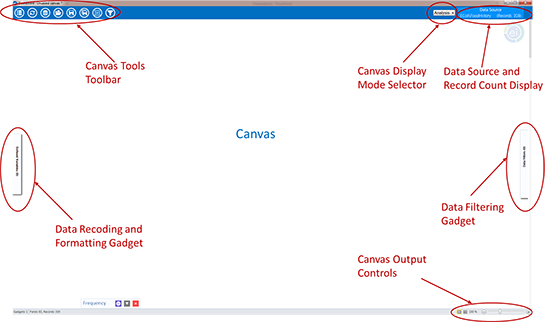
Figure 8.2: Visual Dashboard canvas
The Visual Dashboard contains seven areas: the Canvas, the Canvas Display Mode Selector, the Data Source and Record Count Display, the Canvas Output Controls, the Canvas Tools Toolbar, the Defined Variables gadget, and the Data Filters Gadget.
- The Canvas is the blank space in the center of the Visual Dashboard. It displays output generated by the multiple gadgets available in the tool. The canvas has a function dialog box that appears when a blank space is right-clicked.
- The Canvas Display Mode is located in the upper right corner of the Visual Dashboard just before the data source and record count display. It has three settings:
a. Analysis (default)—allows the user to create analysis gadgets.
b. Data—allows the users to browse the data in the data source that is loaded.
c. Variables—displays a data dictionary for variables in the loaded data set. - The Data Source and Record Count Display, located at the top right of the screen, displays the source and record count of the data being analyzed. The number of fields (columns) in your dataset will be displayed on the bottom left of the Windows status bar.
- The Canvas Output Controls are located at the bottom right side of the Dashboard workspace. The controls contain three options. The Hide Borders button turns off the external borders for each gadget, which gives the canvas a more report-like appearance. The Auto-arrange button positions the gadgets on the canvas to maximize the display area. The Zoom Percent and Zoom Slider allow you to zoom in and out of the canvas.
- The Defined Variables Gadget in the pull-out drawer on the left side of the canvas allows for the creation, editing, and deletion of variables created during the analysis session.
- The Data Filtering Gadget (labeled as Data Filters) in the pull-out drawer on the right side of the canvas allows for canvas-wide filters to be applied. It is used to select a subset of data for analysis.
- The Canvas Tools Toolbar is located at the top left corner of the canvas. It allows a quick way to access Visual Dashboard functions:
a. Options—opens options menu.
b. Refresh—refreshes your screen with new data that have been entered.
c. Set Data Source—sets your data source.
d. Open—opens a saved canvas.
e. Save—saves your current canvas back to the original file name and location.
f. Save As—saves your current canvas to a new name or new location.
g. Variables—opens the Defined Variables Gadget.
h. Filters—opens the Data Filtering Gadget.
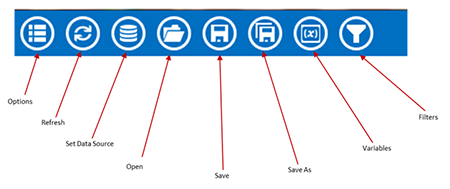
Figure 8.3: Canvas tools toolbar
Canvas Properties
After a data source has been loaded, the Canvas Properties are accessed by right clicking on the canvas and selecting Canvas Properties from the menu options. These properties are used to:
- Change the data source properties by selecting a new project and table.
- Change HTML output properties and create a custom title, summary, and conclusion for your Visual Dashboard output.
- View technical information about your canvas, such as the number of rows and columns, and cached information.
Note: Changing the data source in the Canvas Properties is an advanced feature and not recommended unless the schema of both data sources is the same.
Opening the Options Menu
The Options menu icon will open the Options menu where user can set a data source.
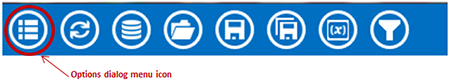
Figure 8.4: Visual Dashboard toolbar, with Options menu icon circled
The Options menu has many other options that can be used once a data source is set. There are additional ways to open the Options menu, and these are discussed later in this chapter.
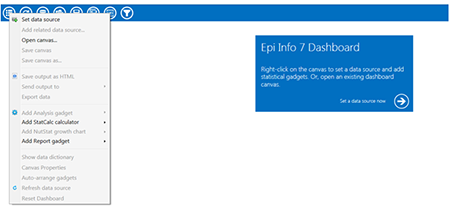
Figure 8.5: Options menu on the Dashboard canvas
Updating the Canvas with Refresh
The Refresh icon updates the gadgets on the canvas with the latest data.
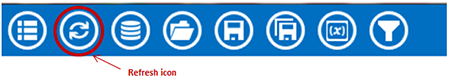
Figure 8.6: Visual Dashboard toolbar, with Refresh icon circled
Run Visual Dashboard from the Command Line
The Visual Dashboard can be run from a batch program, custom menu, or the operating system command line. If the VisualDashboard.exe program is associated with files having the .cvs7 extension, then opening Visual Dashboard to show a saved canvas can be as simple as executing the canvas file name.
If the .csv7 file extension is not associated with the Visual Dashboard program, then you will need to call the AnalysisDashboard.exe program followed by the name of the canvas using the /canvas: switch.
These examples are given with the assumption that Epi Info™ 7 is in the C:Epi_Info_7 folder on the C: drive. If your copy of Epi Info™ 7 is in another location, then use your location or a relative path.
If run from within the Epi Info 7 folder, a batch program or desktop shortcut can open Visual Dashboard with the statement:
AnalysisDashboard.exe
To open a specific canvas, use the /canvas: switch. In this example, we open Visual Dashboard to show the saved Ecoli.cvs7 canvas which may be found in the C:Epi_Info_7ProjectsEcoli folder.
C:Epi_Info_7AnalysisDashboard.exe /canvas:"C:Epi_Info_7ProjectsEcoliEcoli.cvs7"
In the batch program, the statement above should be on one line.