Visual Dashboard: Performing Statistical Analyses with Visual Tools
‹View Table of Contents
Adding and Removing Data Filters
Add a Filter
Visual Dashboard typically opens all records in a file. The Data Filters gadget in Visual Dashboard allows you to select a subset of data by specifying certain conditions. This is useful when trying to analyze a specific group of records. There are two modes in this gadget; guided and advanced. The Guided Mode allows you to apply conditions by selecting values from Field Name, Operator, and Value drop-down lists. Filters may be applied in the Advanced Mode by entering the filtering conditions in the free form text box. To add a filter in Guided Mode, follow the steps below. Advanced Mode is discussed in a later section.
- Select the EColi.PRJ Data Source.
- From the Data Source Explorer menu, click FoodHistory.
- Click OK.
- From the right-hand side of the Visual Dashboard canvas, move the mouse over the Data Filter gadget, or click the Filters gadget (funnel) icon in the top left of the screen. The gadget expands and becomes fully visible.
- From the Field Name drop-down list, select ILL.
- From the Operator drop-down list, select is equal to.
- From the Value drop-down list, select Yes.
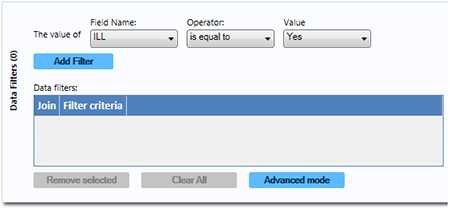
Figure 8.89: Data Filter Gadget/Add Filter
- Click the Add Filter button. The filter condition is added to the Data filters grid within the gadget. Screen shot of the data filter gadget, which can be used to filter record results.
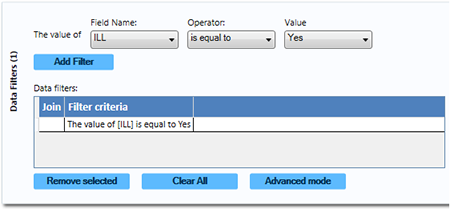
Figure 8.90: Data Filter Gadget/Add Filter with Condition
If a filter condition is added or removed, all gadgets on the canvas will automatically refresh. The record count at the top now reads 276, indicating that there are 276 out of 359 records in which the value of ILL is Yes.
To add another filter:
- On the right-hand side of the Visual Dashboard canvas, move the mouse over the Data Filter gadget, or click the Filters gadget in the top left corner. The gadget expands and becomes fully visible.
- From the Field Name drop-down list, select Age.
- From the Operator drop-down list, select is between.
- From the Value text boxes, type 20 for the first box.
- From the Value text boxes, type 29 for the second box.
- Click Add Filter. A context menu appears asking if you want to add this condition using an AND or OR operator. Select your desired operator.
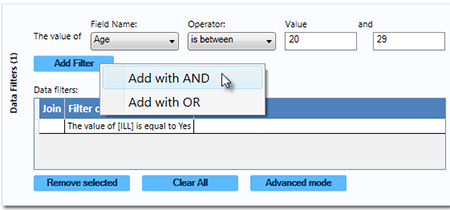
Figure 8.91: Data Filter Gadget illustrating addition of a second condition
- The filter condition is added to the Data filters grid view beneath the first condition.
The record count shows 64 records. This indicates that only 64 records match the two established filter criterion that the patient was ill and between 20 and 29 years of age. All gadgets added to the Visual Dashboard canvas will only display data from these 64 records. The filter settings appear at the top of the canvas.

Figure 8.92: Data Filter setting
Remove Selected Filter
If you desire to work with only one or some of the existing filters, the unwanted data filters must be removed. Follow the steps below to remove individual filters.
- On the right-hand side of the Visual Dashboard canvas, move the mouse over the Data Filter gadget or click the Filters gadget in the top left corner. The gadget expands and becomes fully visible.
- To remove the second condition, which should appear as “The value of Age is between 20 and 29,” select it in the list.
- Click the Remove Selected button. The condition disappears.
- Select the remaining condition.
- Click the Remove Selected button. The condition disappears. If you had other filters in the list, they would remain. If all filters are removed, the system would return to working with the full dataset.
Clear All Filters
The Clear All button removes all existing filters at once. If you wanted to clear all filters, you could use this step rather than removing filters individually as described in the topic Remove Selected Filter.
- On the right-hand side of the Visual Dashboard canvas, move the mouse over the Data Filter gadget or click the Filters gadget in the top left corner. The gadget expands and becomes fully visible.
- Click the Clear All button. All existing filter conditions disappear.
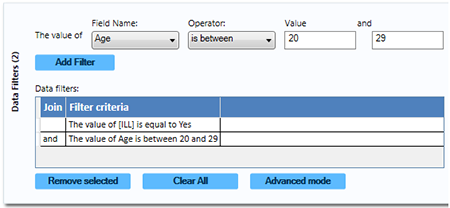
Figure 8.93: Data Filter Gadget/Add Filter with Two Conditions
Advanced Filter Mode
The Advanced mode allows you to type the desired data filter string into the text box provided. Once the filter is applied, the canvas will only display the records that meet the specified condition(s).
Note: Advanced mode uses the .NET DataView.RowFilter syntax. For more information about this syntax, refer to Microsoft’s website describing the DataView.RowFilter Property.
The following example demonstrates how to use advanced filters.
- On the right-hand side of the Visual Dashboard canvas, move the mouse over the Data Filter gadget or click the Filters gadget in the top left corner. The gadget expands and becomes fully visible.
- Select Advanced Mode. The Advanced mode dialog box appears.
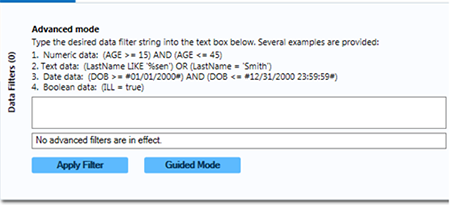
Figure 8.94: Advanced Mode
- In the text box, enter the following condition “(([ILL] = 1) and (Age >= 20 and Age <= 29)) AND RECSTATUS > 0” (do not include the quotation marks).
- Click the Apply Filter button.
- The verbiage “No advanced filters are in effect” will be replaced with “The filter is valid and is now in effect.” When filters are applied, the conditions appear in green font.
- The record count in the top right corner of the Visual Dashboard canvas now reads 64, indicating that there are 64 out of 359 records where the value of ILL is Yes and the value for age is between 20 and 29.
Note: You can toggle between the Guided Mode and the Advanced Mode by clicking on the respective button on each screen.