Visual Dashboard: Performing Statistical Analyses with Visual Tools
Visual Dashboard
Analysis Gadgets
Matched Pair Case-Control
The Matched pair case-control option in Visual Dashboard is for use with pair-matched case-control studies. Each case must have exactly one matched control. For this reason, it is generally incorrect to perform the analysis using 2×2 tables since it does not take matching into consideration. To use this option, you need to specify an Exposure Variable, the Outcome Variable (i.e., case vs. control), and a Match variable that links each case to its control. The following example demonstrates a matched pair-case control analysis.
The dataset below is from a matched case-control study of the consumption of chicken, where the outcome resulted in the patient becoming ill. The primary exposure was the consumption of chicken (AnyChkn), the case control is CaCO, and the Pair Group ID is Matched pairs.
- Select the Case Control DatabaseExample.xlsx Data Source found in the Sample project folder. Note that this will require updating the Database Type to Microsoft Excel 2007 Workbook (.xlsx) before browsing.
- Select Section_1_3 & 8$ form in the Data Source Explorer menu.
- Click OK.
- Select Add Analysis Gadget > Matched pair case-control.
- The Matched Pair Case-Control Properties gadget appears.
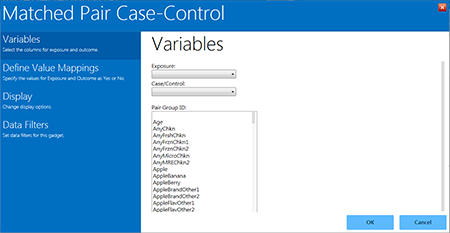
Figure 8.37: Matched Pair Case-Control gadget
- From the Exposure drop-down list, select AnyChkn.
- From the Case/Control drop-down list, select CaCo.
- From the Pair Group ID list, select Matched pairs.
- Click on Define Value Mappings.
- Click on 1.
- Click on the > button on the Yes values: section.
- Click on 0.
- Click on the > button on the No values: section.
- Click OK.
The Matched Pair Case-Control results appear on the canvas.
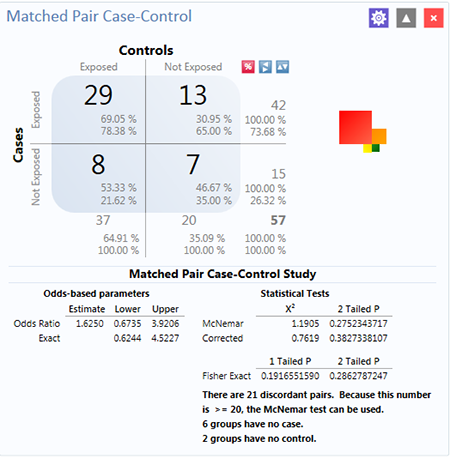
Figure 8.38: Matched Pair Case-Control results
The results display that out of 57 matched pairs, 29 had both the case and the control exposed to AnyChkn, 13 had the case but not the control exposed, eight pairs had the control exposed but the case unexposed, and seven had neither the case nor the control exposed.
The Odds-Ratio is greater than 1, which suggests that eating chicken may be more likely to result in being ill. However, the confidence intervals contain 1 and the P values are less than 0.05, indicating that there is no significant association between eating chicken and becoming ill.