Visual Dashboard: Performing Statistical Analyses with Visual Tools
Visual Dashboard
Analysis Gadgets
Frequency
Introduction
The Frequency gadget counts each occurrence of a value for a specified variable and gives the absolute and relative frequencies for each value. This option then produces a frequency table that shows how many records have a value for each variable, the percentage of the total, a cumulative percentage and upper and lower confidence intervals.
- Select the EColi.PRJ Data Source. Open the FoodHistory form from the Data Source Explorer menu.
- Right click on the canvas and select Add Analysis Gadget > Frequency. The Frequency gadget configuration window opens to the Variables property panel.
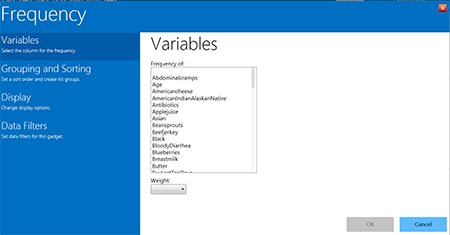
Figure 8.23: Frequency gadget
- From the Frequency Of list, select a variable from the data table. For this example, select Sex as the desired variable.
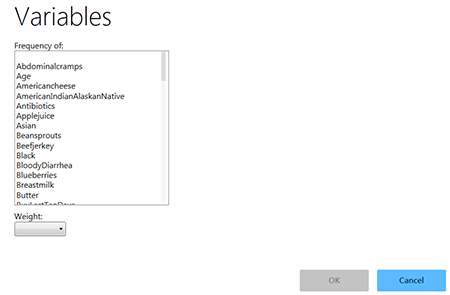
Figure 8.24: Selecting frequency of variable
- Click OK. The results appear on the Visual Dashboard canvas.
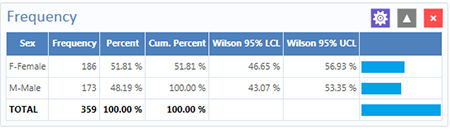
Figure 8.25: Frequency results
The Frequency column provides the count of individuals that are either female or male. The Percent column indicates the percentage of female or male. The Wilson 95% LCL (Lower Confidence Limits) are a range of values that indicates the likely location of the true value of a measure, meaning (in this instance) that the percentage of females is likely to be between 46.64% and 56.93%.
Frequency Additional Options
Additional options are available in the Frequency gadget:
- Select the EColi.PRJ Data Source. Open the FoodHistory form from the Data Source Explorer menu.
- Right click on the canvas and select Add Analysis Gadget > Frequency. The Frequency gadget configuration window opens to the Variables property panel.
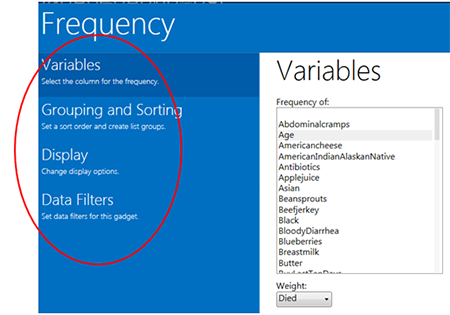
Figure 8.26: Frequency gadget functions menu
The following options are available in the Frequency gadget, under the various functions located in the left-hand column:
- Weight (available under Variables)–The field to use as the weight variable, for example, if aggregate data are being analyzed.
- Stratify By (available under Grouping and Sorting)–The field to use for stratifying (grouping) the output.
- Sort high to low (available under Grouping and Sorting)– displays the results sorted from high to low based on the selected Frequency of variable.
- Display all list values (available under Display)–Only applicable when the frequency variable is a drop-down list field in an Epi Info™ 7 project. When selected, the output will show all of the drop-down list values even if they have a count of zero.
- Display list labels (available under Display)–Only applicable when the frequency variable is a Comment Legal field or Option Field in an Epi Info™ 7 project. When selected, the output will show the value and the label for Comment Legal fields and the option button label for Option fields.
- Include Missing Values (available under Display)–This option, which is unchecked by default, displays the count of rows having missing values.
- From the Frequency of list in Variables, select Age from the data table.
- From the Weight drop-down list below, select Died from the data table.
- Select Hospitalized from the Stratify by list.
- Click OK. Results appear on the canvas.
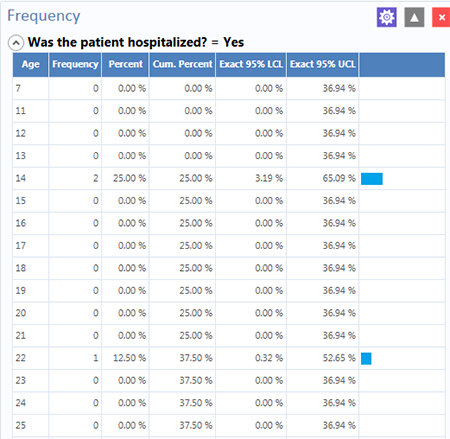
Figure 8.27: C
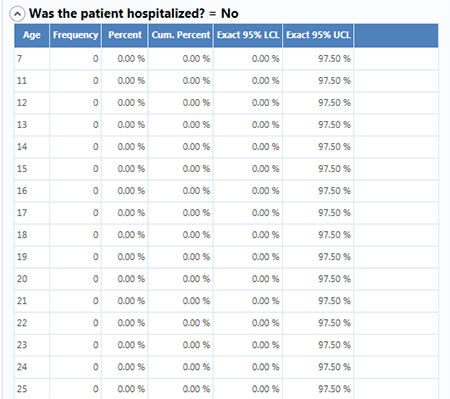
Figure 8.28: Frequency Line List stratified view #2
The results display the frequency of deceased patients by age and are stratified by whether the patient was hospitalized or not. The age, frequency, percent, cumulative percent and upper and lower 95% confidence intervals are displayed. The last column is the percent bar.
You can also open the Display property panel to show additional properties for the Frequency gadget. The following options are available in Display:
- Gadget Title–Allows you to enter a title for the current gadget. This title will appear at the top of the gadget results on the canvas.
- Gadget Description– Allows you to enter a description for the current gadget. This description will appear at the top of the gadget results on the canvas, just below the title.
- Use field prompts–Specifies whether to use the field question or prompt instead of the field name. This property is checked by default.
- Draw borders–Setting for drawing the frequency’s border.
- Draw header row–Setting for displaying the frequency’s headers.
- Draw total row–Setting for displaying the frequency’s totals.
- Decimals to display–Specifies the number of decimals that will be displayed in the results. The possible values range from zero to four. This is set to two by default.
- Maximum rows to display–Specifies number of rows to display.
- Max width of percent bar–Width for percent bar column using a % value.