StatCalc: Statistical Calculators
PAGE 5 of 12
‹View Table of Contents
Cohort and Cross-Sectional
The Cohort and Cross-Sectional study calculates the sample size recommended for a study given a set of parameters and the desired confidence level.
Example
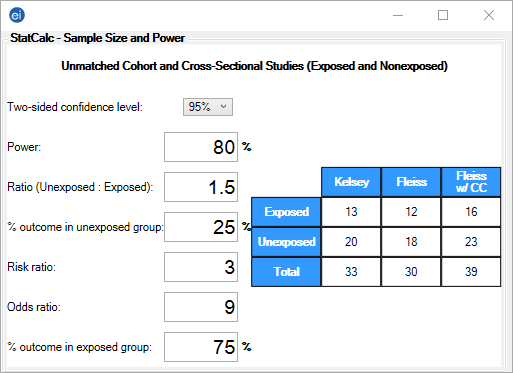
The following example demonstrates how to calculate a sample size for a cohort or cross-sectional study. The application will show three different sample size estimates according to three different statistical calculations.
- From the Epi Info™ main page, select StatCalc.
- Select Cohort or cross sectional. The Cohort or Cross-Sectional window opens.
- Select the Two-sided confidence level of 95% from the drop-down list.
- Enter the desired Power (80%) to detect a group difference at that confidence level.
- Enter the proportion of unexposed vs. exposed of 1.5. This is a single value and the approximate proportion cannot be entered in the format, # of Unexposed : # of Exposed.
- Enter the percentage outcome in the unexposed group 25%. This percentage represents the incidence rate of ill patients in the unexposed group
- Enter the percentage outcome in the exposed group 75%. This percentage represents the incidence rate of ill patients in the exposed group
- The Risk ratio and Odds ratio fields automatically populate based on the values entered.
- The output table shows three different estimates of sample size needed.

Figure 10.11: Cohort and Cross-Sectional Studies