7.7 Processes Must be Made Visible
To fully understand the processes of a surveillance system, it is helpful to produce a visual map of the processes – a map that details the processes as they really are, not as someone thinks they are. For this reason, producing this map – in practice, as a set of flowcharts – requires fundamental knowledge by those who operate those processes. It is the job of both the programme director and key staff. Importantly, this should involve front-line workers (e.g. data abstractors and nurses who interact with the potentially affected child within the health-care system), as well as clinical reviewers, data managers, analysts and administrators. It is often surprising to see how much can be gleaned (and how assumptions might be wrong) just by assembling this team and going step by step through the details of the surveillance workflow.
Process mapping is an important, yet time-consuming step. The processes can be complex, but in order for the process mapping to be useful for identifying issues and improving quality, the details of the mapping should focus on where people actually perform a specific task; for example, a nurse examining a child in the nursery. The processes should include tasks and people. These steps in which people perform specific tasks can then be evaluated to see which can be leveraged efficiently, where small changes can lead to big gains in quality.
The details of process mapping go beyond the scope of this primer. However, to illustrate a basic process mapping, this primer presents some simplified conceptual process maps to show how certain processes can be improved with the aid of specific tools and quality indicators.
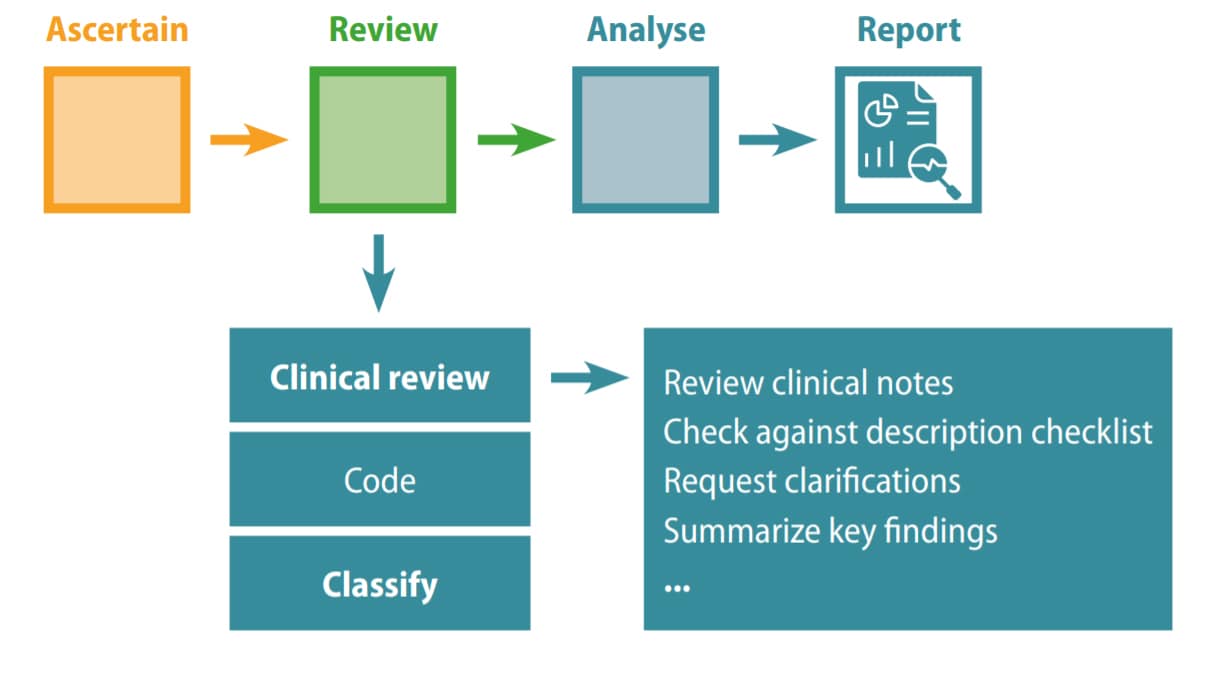
A simplified process map is hierarchical. In Fig. 7.4, a basic map shows how the system is made of processes – ascertain, review, analyse, report – linked into a causal chain. This conceptual view is helpful but only a start. It lacks the detail necessary for action. This detail is made visible when each major process (here, the review process) is expanded to identify its components (e.g. review clinically, code, classify) and then each of these is further expanded until one reaches the level at which people do specific tasks – for example, the expert clinician at the central level reviewing a set of potential cases. This level, sometimes referred to as the decision level, is where issues of data quality can be usefully identified and corrected.
Fig. 7.4. Basic map of key processes

Another example, still fairly simple and conceptual, is illustrated in Fig. 7.5 and is shown to highlight a few important points.
The example in Fig. 7.5 expands slightly on the tasks of different staff members. It is not yet a flowchart (the activities are not connected explicitly but they can easily be in a next step) and the details are incomplete (e.g. the tasks of abstractors must be specific to the level of detailing which sources they look at and in which areas of the hospital or laboratory). More formal process maps would document the paths of data (which can be complex) as they are processed by the system, and some, such as the “swim lane” map, would also specify who is assigned to each task.
Fig. 7.5. People and tasks – examples of key processes in birth defects surveillance

However, even in such conceptual form, this visual illustration begins to help a programme team have a shared understanding of the processes and tasks involved, as a starting point to develop, criticize and build. For example, in the context of quality improvement, the team might decide to test the use of description checklists at the level of the local staff and central abstractors, and the use of data quality indicators at the central level.
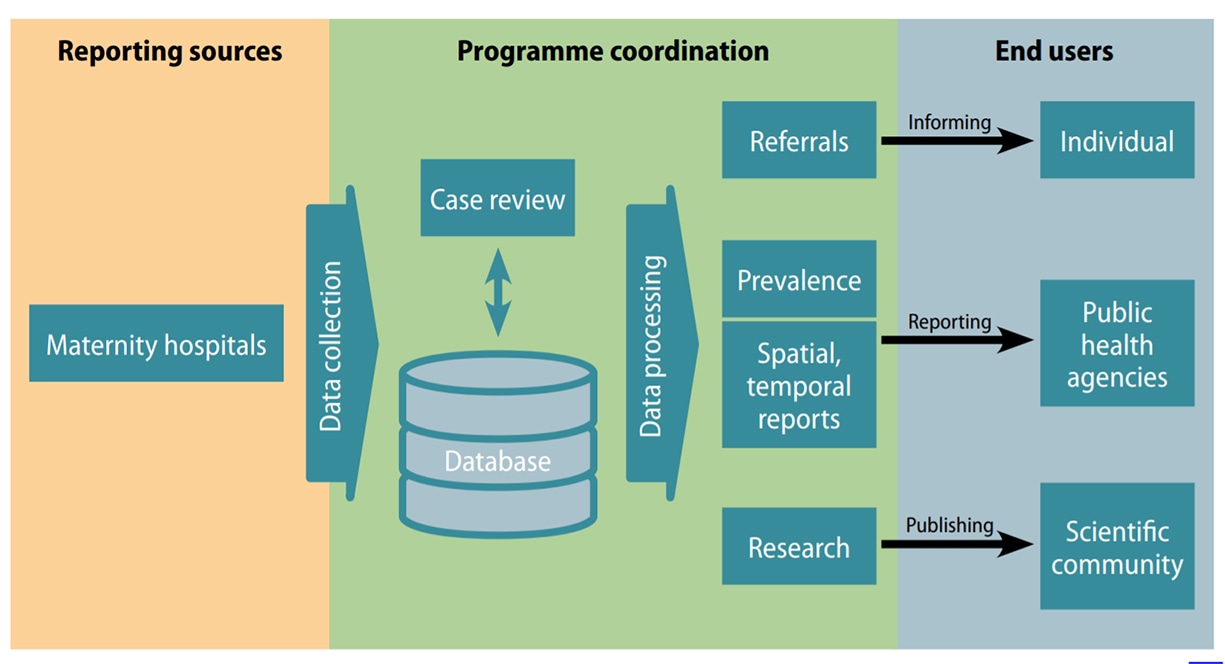
Fig. 7.6 shows a simple mapping example for a birth defects surveillance programme called RENAC, a hospital- based surveillance programme of major structural congenital anomalies that operates in maternity hospitals distributed in the 24 jurisdictions of Argentina. The programme includes live births and stillbirths with major structural congenital anomalies detected from birth until hospital discharge. Pregnancy terminations are not legally allowed in Argentina and are not included in the surveillance system.
Fig. 7.6. Example of high-level mapping of a hospital-based surveillance programme

In each maternity hospital, two RENAC champions, who are neonatalogists committed to the programme, are in charge of overseeing data collection. Each month, they send reports to the programme coordination team.
All cases are reviewed by the coordination team and submitted data are processed. Information is disseminated to end-users through reports, scientific publications and case referral.
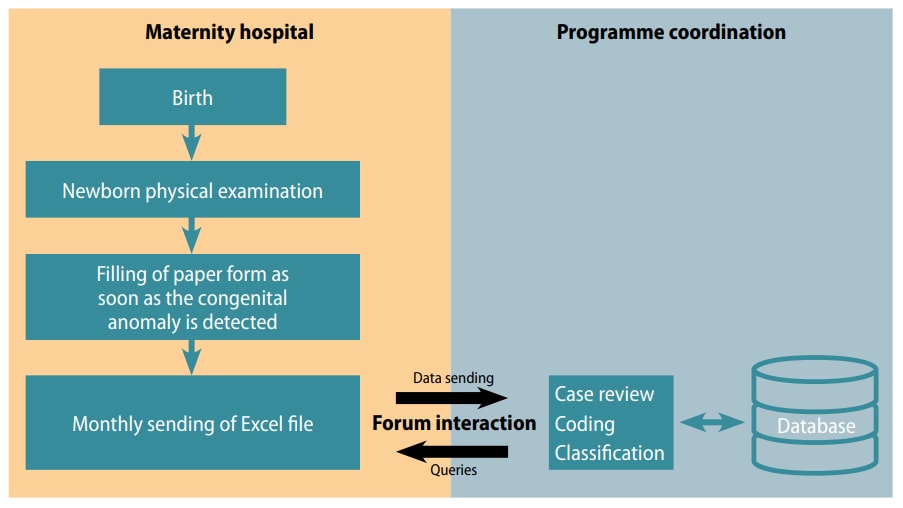
As already noted, such a high-level map is helpful for a broad understanding of the system, and as a starting point for “deep dives” into the specific components. For example, the tasks in the maternity hospital and the interaction with the coordination team can be further expanded (Fig. 7.7a).
Fig. 7.7a. Example of expanded tasks in maternity hospital and interaction with programme

Local staff examine every newborn and stillbirth at the hospital, and if congenital anomalies are detected, a neonatologist from the maternity staff documents the findings in writing in a paper form.
Every month, the champions copy the information collected in the paper form into an Excel file. They then send the Excel file to the programme coordinator via a protected online forum. The reports include a verbatim description of the affected cases and a core set of variables.
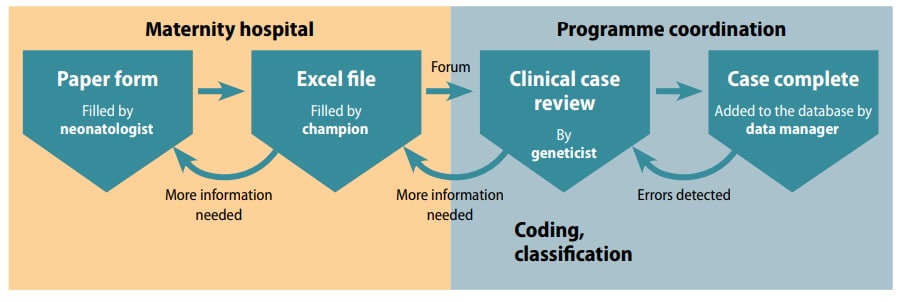
The champions can send digital photographs of radiographs, clinical photographs or results of additional studies that can contribute to accuracy and completeness of the diagnosis. Sending the reports through the online forum allows timely review and discussion between the programme coordination team and the hospital champions. For example, the central staff can request clarification and the champions can ask for diagnostic support in complex cases, allowing for bidirectional interactions. Each case is then coded using the ICD-10 coding system with the RCPCH modification. This aspect is not clear from the previous illustration, so these steps can be expanded to provide further detail and specification on who is doing what (Fig. 7.7b).
Fig. 7.7b. Example of expanded tasks by staff in maternity hospital and interaction with
programme

These examples are simple illustrations of what needs to be a systematic and comprehensive approach to visualizing the processes in a surveillance system, so that they are clear, hierarchical, and eventually reach the “decision level”– the level at which specific staff do specific tasks. In doing so, the next steps in quality assessment and quality improvement become clear and shared among the entire team.