7.1 Why Data Quality Matters
In public health, a crucial source of evidence for action is surveillance data – the tracking of key health indicators and using the information to prevent diseases and improve population health. In birth defects surveillance, the focus is on tracking the impact of birth defects in populations by monitoring the occurrence of birth defects (ideally throughout life, from fetus to adult) and their impact on health and daily living (ideally, encompassing mortality, morbidity, disability and quality of life). These data can help provide needed services, identify disparities and inequalities, detect trends, and assess the effect of interventions.
Public health surveillance is a worthy societal investment precisely because it provides such value to the community – an ongoing and sustained source of public health data on which interventions can be based. For such interventions to be correct, the data must be reliable: accurate, complete and timely; hence, the value of high-quality data. In fact, not only are high-quality data beneficial, but poor-quality data might at times be worse than having no data at all, since they can lead to misguided decisions strengthened by the illusion of doing the right thing based on evidence.
There is also a second reason to focus on quality data. Improving quality in a system can reduce its costs. With better surveillance systems, there are fewer errors to correct, fewer products to discard. Reducing cost is important everywhere but is especially crucial in areas of the world where resources are limited and stretched thin across many different health needs. For birth defects prevention and care, lower-resource areas are particularly relevant, as they encompass regions of large populations and high birth rates – regions such as Asia and Africa, where most births (and most birth defects) occur.
Evaluating and improving data quality in birth defects surveillance is a multi-step process. This primer will focus on a few basic ideas as starting points for discussion and action within birth defects programmes and networks. Specifically, areas covered include the value of and need for high-quality data, how quality improvements are possible everywhere, and simple tools that are available to ensure quality is embedded into the surveillance process.
A surveillance scenario
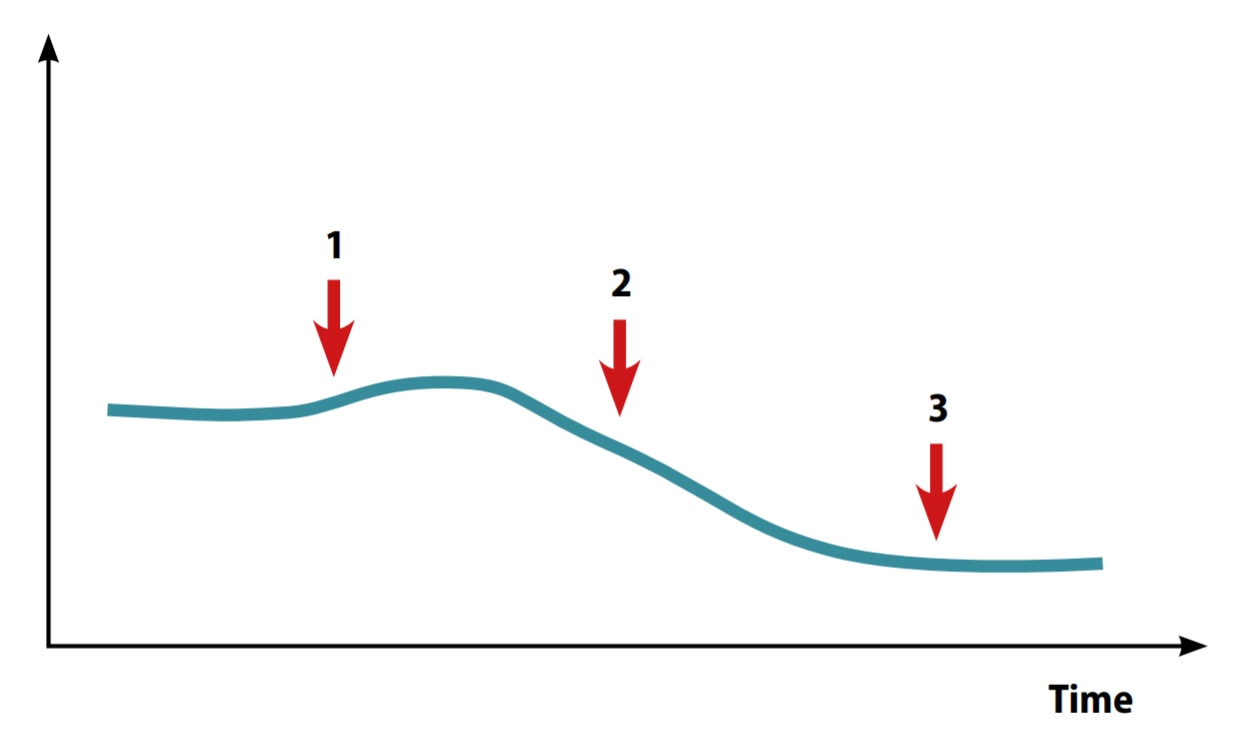
Imagine that a surveillance programme has been created to monitor an indicator that is important to the community – e.g. the livebirth prevalence of NTDs (see Fig. 7.1). After a period of stable prevalence, suddenly the programme staff starts to see an apparent increase (arrow 1). How could this change be interpreted and what could be done about it? As time goes on, an apparent decline is then observed (arrow 2). How could this change be interpreted and what could be done now?
After a longer period of time, the prevalence seems to stabilize (arrow 3) and a new baseline continues. Why is there a new baseline? What has changed since the previous baseline? What does this mean?
Fig. 7.1. Interpreting changes in rates of an indicator in a birth defect surveillance system
Indicator rate:
e.g. live birth prevalence of
neural tube defects
What might be going on?

Clearly, something is going on. Do these changes truly reflect what is happening in the population? Are these changes real? Or are these changes spurious – due to changes in how a surveillance programme is able to interact with the target population? And if they are due to surveillance activities, is it because of “noise” or errors in the surveillance process (e.g. incomplete or miscoded cases)?
Below are some critical questions and possible actions that the surveillance programme might take:
- Will an investigation be launched to find a new teratogen, if the decision is made that the increase at point 1 is real? However, if the increase is spurious, the investigation would be a waste of time and resources.
- Will the focus instead be on understanding whether processes of the surveillance system have changed – for example, a new referral hospital added, new staff hired but not trained, or loss of a data source, leading to changes in ascertainment and reporting?
- Will an assessment be performed to determine what local/regional/country-wide decisions have changed that could affect pregnant women and pregnancy outcomes, such as elective termination?
- Will nothing be done in the hopes that the issue will go away? (This is usually not a good strategy.)
Clearly, something should be done to understand both the biology of the condition under surveillance, as well as each methodological step of the surveillance programme. In addition, understanding the health-care context and the community will be important. For example, what policies or initiatives are in place or have changed that might affect the programme, and specifically, which part of the programme might they influence (e.g. ascertainment, reporting, clinical case review, coding)?
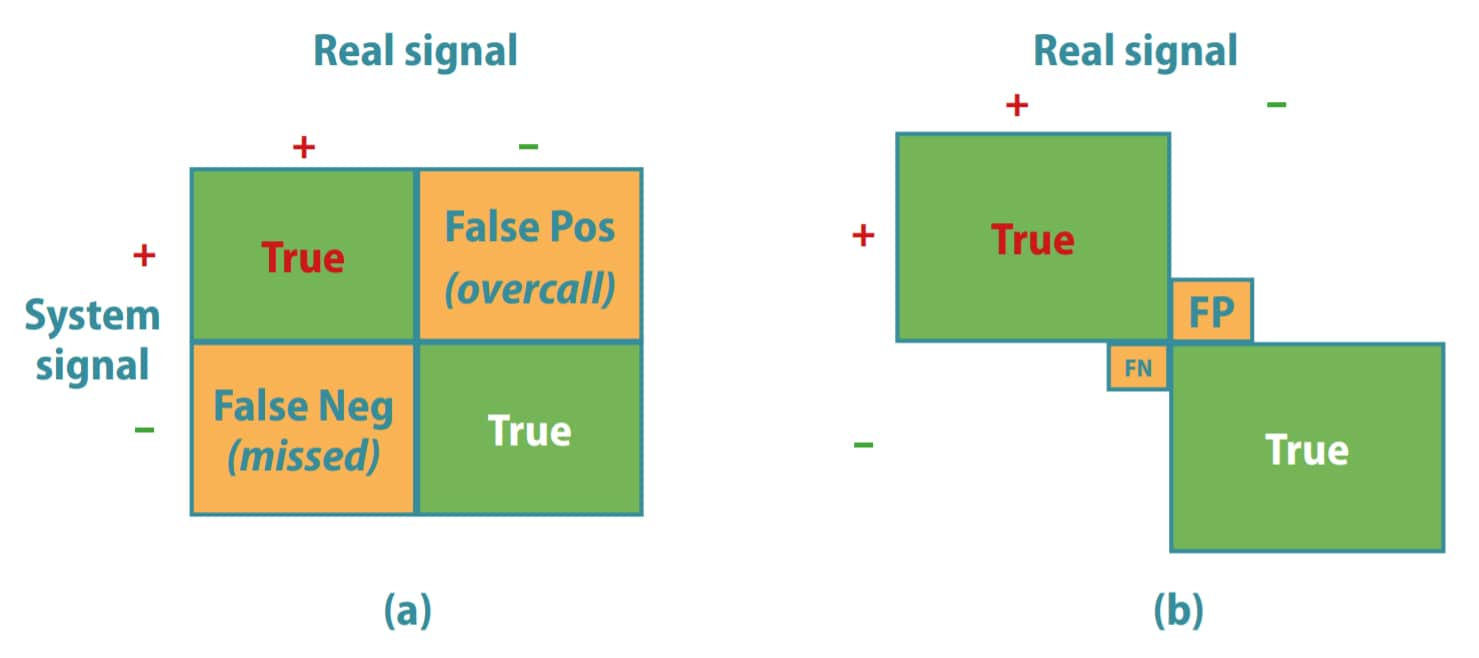
The relation between a true signal in the population and the signal detected by the surveillance programme can be visualized in a two-by-two table (see Fig. 7.2).
As shown in panel a of Fig. 7.2, the system aims to detect only true signals, without overcalling events (false positives) or missing events (false negatives). False positives and false negatives both have costs.
Fig. 7.2. Real versus system-generated signals in a birth defect surveillance programme
Cost of false positives (false pos; FP; overcalling): inappropriate (wasteful) alarms, cluster investigations, concerns.
Cost of false negatives (false neg; FN; undercalling): missed“epidemic”, missed benefit of intervention.
Improving the quality of a surveillance programme aims at minimizing those errors that cause false negatives and false positives (smaller squares), and at boosting confidence that the system can reliably track events in the population (larger squares). For example, imagine that the surveillance system detects an apparent decrease in the occurrence of spina bifida in an area where primary prevention efforts are being pursued. Is this truly a reflection of the success of the primary prevention intervention? Or is the completeness or accuracy of case ascertainment being degraded because, for example, trained staff have left the birthing centres or pregnancy terminations have increased but have not been captured by the programme?
Data quality improvement is a process. Quality can always be improved. The key is to improve, stabilize those improvements and build on them.
