Keys to Success with TAS
TAS Overview
The Targeted Assessment for Antimicrobial Stewardship (TAS) is a framework for quality improvement that can be used to
optimize antimicrobial use (AU) at facilities. A variety of TAS reports and dashboards are available to facilities reporting to
NHSN as well as NHSN groups.
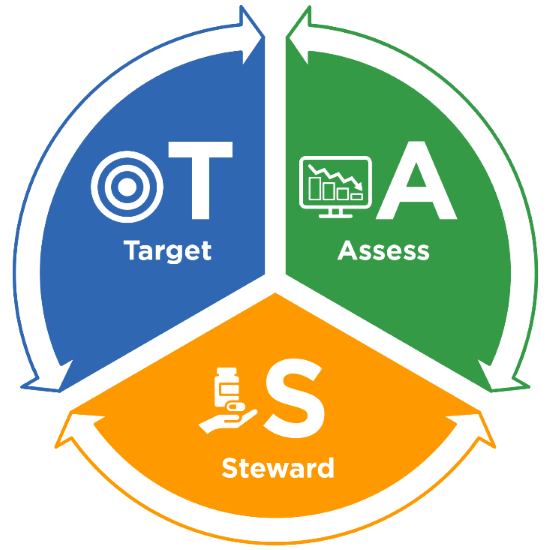
The TAS framework consists of three components:
- Target – Run TAS reports in NHSN to identify facilities, location groups and locations for further assessment using the ranked AU cumulative attributable difference (AU-CAD).
- Assess – Utilize assessment tools to identify gaps and opportunities to improve antibiotic use.
- Steward – Implement antibiotic stewardship activities to address gaps and opportunities.
TAS uses a metric called the AU-CAD, which represents the difference between observed antimicrobial days and a selected Standardized Antimicrobial Administration Ratio (SAAR) target. You can interpret the AU-CAD as the number of antimicrobial days needed to achieve a desired SAAR target. The AU-CAD is calculated by multiplying a numerical SAAR target value by predicted antimicrobial days and then subtracting that from observed antimicrobial days.

The AU-CAD can be greater than or less than zero.
- A positive AU-CAD value means the SAAR target was less than the current SAAR value for that category. A positive AU-CAD value represents the number of antimicrobial days to reduce per time period to decrease the SAAR value and reach your SAAR target.
- A negative AU-CAD value means the SAAR target was greater than the current SAAR value for that category. A negative AU-CAD value represents the number of antimicrobial days to add per time period to increase the SAAR value and reach your SAAR target.
The AU-CAD is designed for ranking facilities within groups, or location groups and locations within individual facilities, to identify where stewardship efforts may have the greatest impact. However, the SAAR and AU-CAD are not definitive measures of appropriateness or judiciousness of antimicrobial use, and any value may warrant additional investigation.
Remember: You can only calculate an AU-CAD in situations when you can calculate a SAAR with the exception that NHSN can calculate AU-CADs for locations with less than one predicted antimicrobial day, provided the location has at least one observed antimicrobial day. See NHSN’s TAS Guide for more information about when NHSN can and cannot generate AU-CADs (https://www.cdc.gov/nhsn/ps-analysis-resources/tas/tas-guide-508.pdf [PDF – 2 MB]).
Every facility reporting to NHSN is unique and, because the SAAR is not a definitive measure of the appropriateness or judiciousness of antimicrobial use, CDC cannot define SAAR targets for facilities or groups. There are many factors to consider when defining target SAAR values, such as the original SAAR value for a given SAAR agent category, stewardship priorities, and clinical relevance. You can use the location-level SAAR percentiles provided in the SAAR by Location reports (https://www.cdc.gov/nhsn/pdfs/ps-analysis-resources/aur/AU-QRG-SAARTables-Location.pdf [PDF – 429 KB]) in combination with the national percentile distributions in the AU Option Report Data Tables (https://www.cdc.gov/nhsn/datastat/aur-reports.html) or median SAARs by state on the Antibiotic Resistance and Patient Safety Portal Inpatient Antibiotic Use website (https://arpsp.cdc.gov/profile/inpatient-antibiotic-use/all) to help define your SAAR targets.
CDC designed the TAS framework to be a dynamic process. You may set initial SAAR targets and assess the achievability of the targets before setting final appropriate targets. After implementing stewardship activities based on initial assessments, you may evaluate progress using the TAS reports and dashboards, and then set new targets to repeat the process as needed.
The “Three highest use drugs within SAAR Type” column in the TAS reports and dashboards displays the top three antimicrobials that contributed to each SAAR antimicrobial category for the selected time period and, in parenthesis, the percent of observed antimicrobial days each antimicrobial contributed. If two or more antimicrobials contributed the same number of observed antimicrobial days, they are listed in alphabetical order by drug code. You can find the full drug names in the AU tab of the Antimicrobial Use and Resistance (AUR) Module Eligible Antimicrobial Agents spreadsheet (http://www.cdc.gov/nhsn/xls/aur/aur-eligible-antimicrobial-agents.xlsx [XLS – 479 KB]).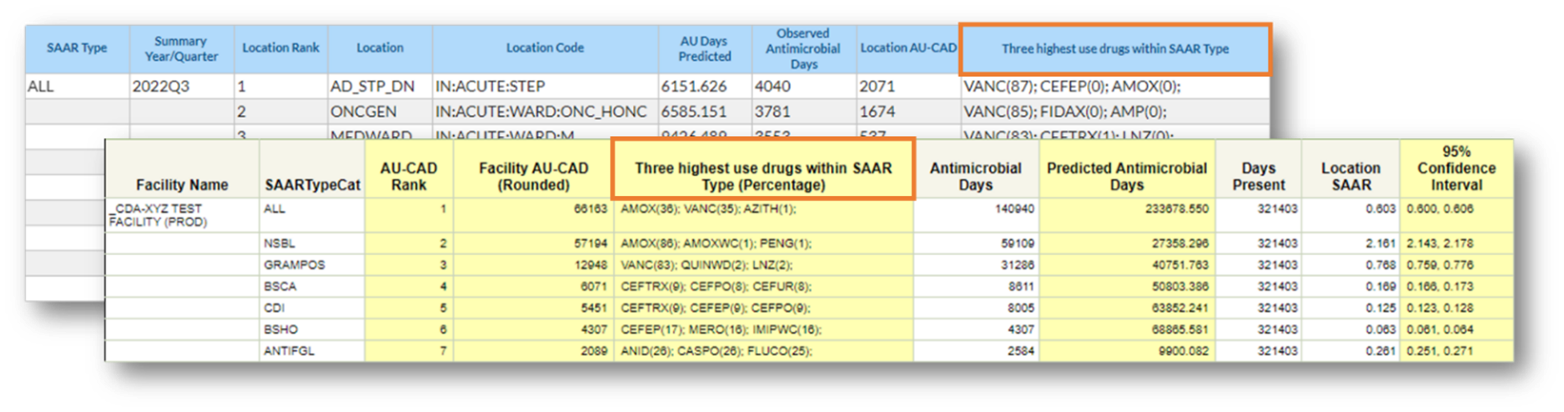
Note: Data are fictitious and for example only.
NHSN provides TAS dashboards for both NHSN facilities and groups, as well as 10 TAS reports for facilities and 8 TAS reports for groups. Most reports are available for all SAAR populations, however, the location group TAS reports are not available for the neonatal population. The TAS dashboard is located on the NHSN Patient Safety Component Home Page and can also be accessed by navigating to Dashboard and then TAS Dashboard from the left-hand menu in NHSN for both facilities and groups.
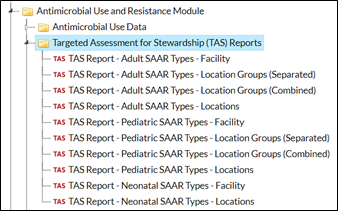
To find the TAS reports, navigate to the Analysis Reports page by clicking Analysis, then Reports on the left-hand navigation bar. You’ll notice the TAS Reports have their own subfolder within the Antimicrobial Use and Resistance Module folder.
| Here are the TAS reports available within a facility:
|
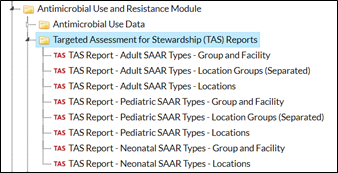
NHSN Groups will see a slightly different set of reports:
|
The NHSN TAS Guide (https://www.cdc.gov/nhsn/ps-analysis-resources/tas/tas-guide-508.pdf [PDF – 2 MB]) provides in-depth information about TAS and the intricacies of each TAS dashboard and report type. The TAS quick reference guides (https://www.cdc.gov/nhsn/ps-analysis-resources/reference-guides.html) provide practical information on how to run, modify, and interpret each TAS dashboard and report.
Choosing how to view your TAS data with so many options may seem overwhelming. Follow this flow chart or questions below to help you choose which report type fits your needs. Then, you can read more about it in the quick reference guides linked below.
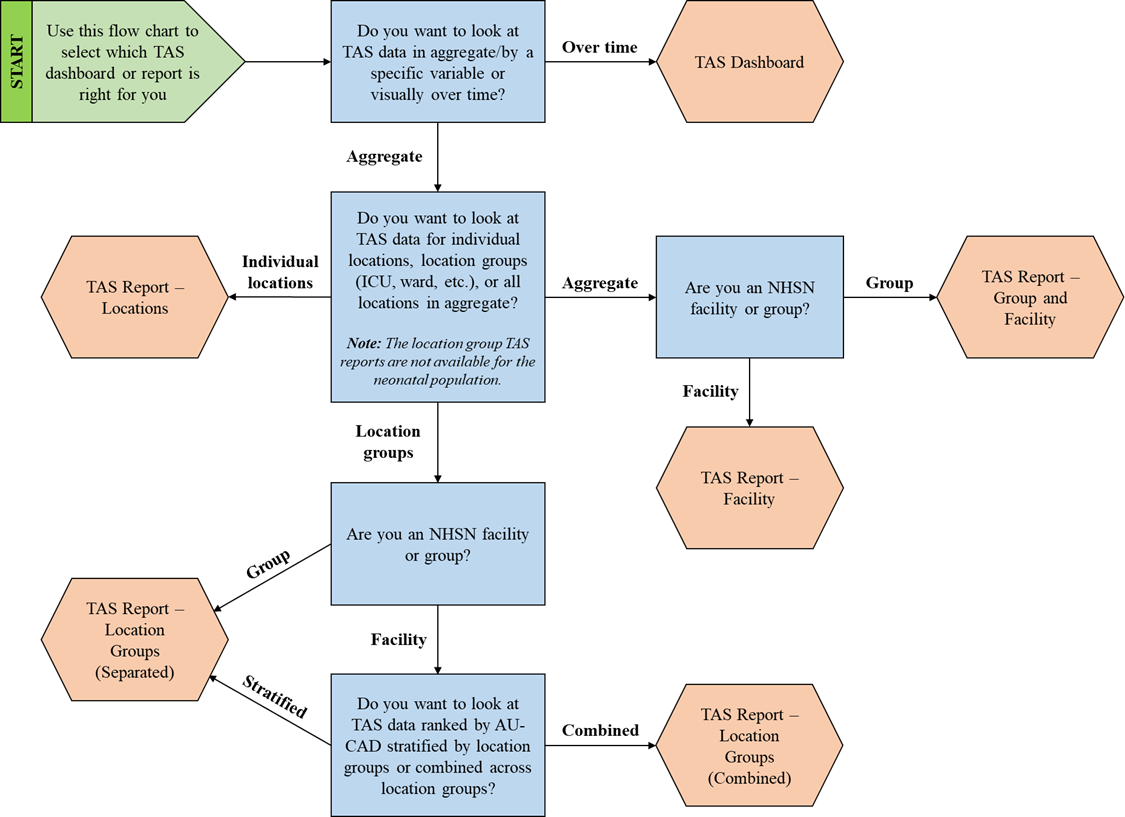
Ask yourself these questions to select which TAS dashboard or report is right for you:
- Do you want to look at TAS data in aggregate/by a specific variable or visually over time?
- If you want to look at TAS data visually over time, use the TAS Dashboard.
- If you want to look at TAS data in aggregate or by a specific variable, proceed to question 2.
- Do you want to look at TAS data for individual locations, location groups (ICU, ward, etc.), or all locations in aggregate? Note: The location group TAS reports are not available for the neonatal population.
- If you want to look at TAS data for individual locations, use the TAS Report – Locations.
- If you want to look at TAS data for location groups, proceed to question 3a-3b.
- If you want to look at TAS data for all locations in aggregate, proceed to question 3c-3d.
- Are you an NHSN facility or a group?
- If you are an NHSN group, use the TAS Report – Location Groups (Separated).
- If you are an NHSN facility, proceed to question 4.
- If you are an NHSN group, use the TAS Report – Group and Facility.
- If you are an NHSN facility, use the TAS Report –Facility.
- Do you want to look at TAS data ranked by AU-CAD stratified by location groups or combined across location groups?
- If you want to look at TAS data ranked by AU-CAD stratified by location groups, use the TAS Report – Location Groups (Separated).
- If you want to look at TAS data ranked by AU-CAD combined across location groups, use the TAS Report – Location Groups (Combined).
TAS Report – Facility-level quick reference guide: https://www.cdc.gov/nhsn/ps-analysis-resources/tas/facility-level-508.pdf [PDF – 572 KB]
TAS Report – Location group-level quick reference guide: https://www.cdc.gov/nhsn/ps-analysis-resources/tas/location-group-level-508.pdf [PDF – 582 KB]
TAS Report – Location-level quick reference guide: https://www.cdc.gov/nhsn/ps-analysis-resources/tas/location-level-508.pdf [PDF – 566 KB]
TAS Report – Group-level quick reference guide: https://www.cdc.gov/nhsn/ps-analysis-resources/tas/group-level-508.pdf [PDF – 654 KB]
TAS Dashboard – Facility quick reference guide: https://www.cdc.gov/nhsn/ps-analysis-resources/tas/facility-508.pdf [PDF – 601 KB]
TAS Dashboard – Group quick reference guide: https://www.cdc.gov/nhsn/ps-analysis-resources/tas/group-508.pdf [PDF – 586 KB]
Are you getting an error message when you try to generate the TAS reports or dashboard? Try the quick fixes below to get TAS up and running.
Set SAAR targets
Before running the TAS Reports you will first need to enter your SAAR target values for each SAAR type and population. If you try to use the TAS dashboard without setting your own SAAR targets, it will display the error message “No SAAR targets set.” If you run the TAS reports without setting your own SAAR targets, the application will default to a SAAR target of 0 for all populations and SAAR Types, which is not an appropriate target value.
Generate data sets
Newly uploaded data aren’t available in analysis reports until you generate new data sets within NHSN. Be sure to check the “timeboxing” and generate new data sets after uploading data into NHSN. Remember, the TAS Reports will only include the most recent 12 months of AU data. The TAS Dashboards will display the most recent four completed quarters of AU data. See the Generating Datasets Guide (https://www.cdc.gov/nhsn/pdfs/ps-analysis-resources/generatedatasets-psc-508.pdf [PDF – 359 KB]) for more information.
Check your rights
NHSN uses SAAR data to calculate AU-CADs. Just like for the SAAR, you need access to the Patient Safety Annual Facility Survey to view TAS data. Review and correct your user rights with your NHSN Facility Administrator or Group Administrator and then generate new data sets. Facility and group users can refer to the guidance document that outlines minimum AU rights (https://www.cdc.gov/nhsn/pdfs/ps-analysis-resources/nhsn-au-user-rights.pdf [PDF – 491 KB]). Group Administrators can also refer to the NHSN Group Function for AUR training (https://www.cdc.gov/nhsn/pdfs/training/2022/AUR-508.pdf [PDF – 5 MB]) to set up their Confer Rights Template to receive SAAR data.
Check the location type
While NHSN encourages facilities to submit AU data from all NHSN-defined inpatient locations, facility-wide inpatient (FacWideIN), and select outpatient acute-care settings (specifically, Emergency Department, Pediatric Emergency Department and 24-hour Observation Area), you can only generate AU-CADs for the specific locations included in each SAAR baseline. You can find a list of the locations you can generate 2017 or 2018 baseline SAARs for in Table 5 of the AUR Module Protocol (https://www.cdc.gov/nhsn/pdfs/pscmanual/11pscaurcurrent.pdf [PDF – 3 MB]).
Email the NHSN Helpdesk
If you tried all the options above and still can’t use the TAS reports or dashboards, please email the NHSN Helpdesk at nhsn@cdc.gov.
AUR Module Website: https://www.cdc.gov/nhsn/psc/aur/index.html
AUR Module Protocol: http://www.cdc.gov/nhsn/pdfs/pscmanual/11pscaurcurrent.pdf/ [PDF – 3 MB]
NHSN TAS Guide: https://www.cdc.gov/nhsn/ps-analysis-resources/tas/tas-guide-508.pdf [PDF – 2 MB]
Patient Safety Analysis Quick Reference Guides: https://www.cdc.gov/nhsn/ps-analysis-resources/reference-guides.html
NHSN Targeted Assessment for Antimicrobial Stewardship Kick-Off: https://www.cdc.gov/nhsn/pdfs/training/2022/nhsn-au-option-tas-webinar-508.pdf [PDF – 6 MB]
Antimicrobial Use Option Reports: https://www.cdc.gov/nhsn/datastat/aur-reports.html
Antibiotic Resistance and Patient Safety Portal Inpatient Antibiotic Use: https://arpsp.cdc.gov/profile/inpatient-antibiotic-use/all