Keys to Success with the SIR
As far as the SIR goes…
The p-value is a statistical measure that tells us whether the number of observed infections is statistically significantly different than the number of predicted infections (i.e., whether the SIR is significantly different from 1.0).
If the p-value ≤ 0.05, we can conclude that the number of observed infections is statistically significantly different than the number of predicted infections.
If the p-value > 0.05, we conclude that the number of observed infections is not statistically significantly different than the number of predicted infections.

If the SIR > 1.0, then more HAIs were observed than predicted, based on the 2015 national aggregate data.
If the SIR < 1.0, then fewer HAIs were observed than predicted, based on the 2015 national aggregate data.
If the SIR= 1.0, then the same number of HAIs were observed as predicted, based on the 2015 national aggregate data.
The 95% CI is a statistical range of values for which we have a high degree of confidence that the true SIR lies within that range.
If the CI does not include 1, then the SIR is significantly different than 1.0 (i.e., the number of observed infections is significantly different than the number predicted).
Example: 95% CI= (0.85, 0.92)
If the CI includes the value of 1, then the SIR is not significantly different than 1.0 (i.e., the number of observed infections is not significantly different than the number predicted).
Example: 95% CI= (0.85, 1.24)
If the SIR is 0.000 (i.e., the infection count is 0 and the number of predicted infections is ≥ 1.0), the lower bound of the 95% CI will not be calculated.
The SIR will not be calculated if the number of predicted infections is less than 1.0.
This rule was instituted to avoid the calculation and interpretation of statistically imprecise SIRs, which typically have extreme values.

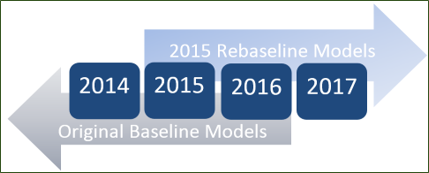
Original models:
Data from December 31, 2016 and earlier
2015 Rebaseline models:
Data from January 1, 2017 and forward
*note: both original and 2015 baseline models are available for Jan 1, 2015 – Dec 31, 2016 data

- SIR Guide [PDF – 50 Pages]
- Information about Transitioning to 2015 SIR Baselines
- Original SIR Baselines for Acute Care Hospitals
- CLABSI (original baseline= 2006-2008) [PDF – 5 MB]
- CAUTI (original baseline= 2009) [PDF – 324 KB]
- SSI (original baseline= 2006-2008) [PDF – 528 KB]
- MRSA bacteremia and CDI LabID event (original baseline= 2010-2011) [PDF – 406 KB]
- December 2010 Special Edition NHSN Newsletter – Introduction to SIR (original baseline) [PDF – 557 KB]
- Original SIR Baselines for Long-term Acute Care Hospitals (LTACHs) and Inpatient Rehabilitation Facilities (IRFs) [XLS – 178 KB]
- NHSN Analysis Trainings & Other Resources