An official website of the United States government



FAQs: Antimicrobial Use (AU) Option Analysis
For general information about the AU Option, please visit the FAQs: Antimicrobial Use (AU) Option | NHSN | CDC.
Standardized Antimicrobial Administration Ratios (SAARs)
The SAAR is a metric that the CDC developed to analyze and report data summarizing antimicrobial use. NHSN calculates the SAAR by dividing observed antimicrobial days by predicted antimicrobial days. More information on how NHSN calculates the SAAR can be found in the NHSN AUR Module Protocol [PDF – 1 MB] and the NHSN’s Guide to the SAAR [PDF – 1 MB]. Additionally, the Keys to Success with the SAAR webpage provides a short overview of the SAAR and its components, and SAAR training videos can be found under: NHSN AUR Training.
No, the NHSN AU Option does not currently receive patient-level data to perform this type of risk adjustment. Data are aggregated and submitted to NHSN at the location level.
In the absence of detailed patient-level information needed for comprehensive risk adjustment, NHSN uses the characteristics of hospitals and patient care locations to approximate risk of AU.
Complete SAAR model details can be found in NHSN’s Guide to the SAAR [PDF – 1 MB]. The SAAR guide describes the methods used to develop the SAAR models and provides recommendations for their use. It also outlines the eligible patient care location types, the antimicrobial agents included in each SAAR category, and the risk adjustment models used to calculate the 2023 baseline SAARs.
For a step-by-step example SAAR calculation, refer to NHSN’s Guide to the SAAR [PDF – 1 MB], which reviews how to compute predicted antimicrobial days and calculate a SAAR. The Introduction to the NHSN 2023 Baseline SAAR Models and Analysis Reports [PDF – 2 MB] details how to calculate an All Antibacterial Agents SAAR where days of therapy across mutually exclusive SAAR agent categories are pooled within a population.
A high SAAR that achieves statistical significance indicates that location or group of locations used more antimicrobials than predicted. A SAAR that is not statistically different from 1.0 indicates antimicrobial use is equivalent to the referent population’s antimicrobial use. A low SAAR that achieves statistical significance indicates that location or group of locations used fewer antimicrobials than predicted. However, the SAAR alone is not a definitive measure of the appropriateness or judiciousness of antimicrobial use. Any SAAR may warrant further investigation. For example, a SAAR above 1.0 that does not achieve statistical significance may be associated with meaningful antimicrobial overuse and require further investigation. Note: a SAAR statistically different from 1.0 still may not lead to productive investigation.
NHSN only generates 2023 baseline adult, pediatric, and neonatal SAARs for locations mapped using one of the following CDC location types (listed in alphabetical order):
| CDC Location Type | CDC Location Code | HL7 Code |
| Adult Burn Critical Care | IN:ACUTE:CC:B | 1026-4 |
| Adult Burn Ward | IN:ACUTE:WARD:B | 1052-0 |
| Adult Labor and Delivery Ward | IN:ACUTE:WARD:LD | 1058-7 |
| Adult Labor, Delivery, Recovery, Postpartum Suite | IN:ACUTE:WARD:LD_PP | 1059-5 |
| Adult Medical Cardiac Critical Care | IN:ACUTE:CC:C | 1028-0 |
| Adult Medical Critical Care | IN:ACUTE:CC:M | 1027-2 |
| Adult Medical Ward | IN:ACUTE:WARD:M | 1060-3 |
| Adult Medical-Surgical Critical Care | IN:ACUTE:CC:MS | 1029-8 |
| Adult Medical-Surgical Ward | IN:ACUTE:WARD:MS | 1061-1 |
| Adult Mixed Acuity Unit | IN:ACUTE:MIXED:ALL_ADULT | 1210-4 |
| Adult Neurologic Critical Care | IN:ACUTE:CC:N | 1035-5 |
| Adult Neurology Ward | IN:ACUTE:WARD:N | 1062-9 |
| Adult Neurosurgical Critical Care | IN:ACUTE:CC:NS | 1031-4 |
| Adult Neurosurgical Ward | IN:ACUTE:WARD:NS | 1063-7 |
| Adult Oncology General Hematology-Oncology Ward | IN:ACUTE:WARD:ONC_HONC | 1232-8 |
| Adult Oncology Hematopoietic Stem Cell Transplant Ward | IN:ACUTE:WARD:ONC_HSCT | 1231-0 |
| Adult Orthopedic Trauma Ward | IN:ACUTE:WARD:T_ORT | 1066-0 |
| Adult Orthopedic Ward | IN:ACUTE:WARD:ORT | 1065-2 |
| Adult Postpartum Ward | IN:ACUTE:WARD:PP | 1068-6 |
| Adult Pulmonary Ward | IN:ACUTE:WARD:PULM | 1069-4 |
| Adult Solid Organ Transplant Special Care Area | IN:ACUTE:SCA:SOTP | 1092-6 |
| Adult Step-down Unit | IN:ACUTE:STEP | 1099-1 |
| Adult Surgical Cardiothoracic Critical Care | IN:ACUTE:CC:CT | 1032-2 |
| Adult Surgical Critical Care | IN:ACUTE:CC:S | 1030-6 |
| Adult Surgical Ward | IN:ACUTE:WARD:S | 1072-8 |
| Adult Trauma Critical Care | IN:ACUTE:CC:T | 1025-6 |
| Pediatric Medical Critical Care | IN:ACUTE:CC:M:PED | 1044-7 |
| Pediatric Medical Ward | IN:ACUTE:WARD:M_PED | 1076-9 |
| Pediatric Medical-Surgical Critical Care | IN:ACUTE:CC:MS_PED | 1045-4 |
| Pediatric Medical-Surgical Ward | IN:ACUTE:WARD:MS_PED | 1081-9 |
| Pediatric Oncology General Hematology-Oncology Ward | IN:ACUTE:WARD:ONC_HONC_PED | 1235-1 |
| Pediatric Oncology Hematopoietic Stem Cell Transplant Ward | IN:ACUTE:WARD:ONC_HSCT_PED | 1234-4 |
| Pediatric Step-down Unit | IN:ACUTE:STEP:PED | 1100-7 |
| Pediatric Surgical Cardiothoracic Critical Care | IN:ACUTE:CC:CT_PED | 1042-9 |
| Pediatric Surgical Ward | IN:ACUTE:WARD:S_PED | 1086-8 |
| Neonatal Special Care Nursery (Level II) | IN:ACUTE:STEP:NURS | 1041-3 |
| Neonatal Critical Care (Level II/III) | IN:ACUTE:CC_STEP:NURS | 1039-7 |
| Neonatal Critical Care (Level III) | IN:ACUTE:CC:NURS | 1040-5 |
| Neonatal Critical Care (Level IV) | IN:ACUTE:CC:NURS_IV | 1269-0 |
While NHSN encourages facilities to submit AU data from all NHSN-defined inpatient locations (including procedural areas like operating rooms), FacWideIN, and select outpatient acute-care settings (specifically, ED, pediatric ED, and 24-hour observation area), the only locations that can generate SAARs are those mapped to the CDC locations listed above. In the future, as more facilities submit AU data, NHSN hopes to develop SAARs for additional location types.
You can still examine antimicrobial use in other locations using line lists, rate tables, or charts. See question #10 in the Data Import section for more information on NHSN AU Option Analysis.
You can find more information about NHSN location mapping for the SAAR in Table 5 of the AUR Protocol [PDF – 1 MB].
FacWideIN is not a SAAR-eligible location. It is the aggregate of ALL individual inpatient locations. The FacWideIN record captures facility-wide data— specifically, data from all inpatient locations from which the AU numerator and denominator are captured. When FacWideIN data are uploaded into NHSN, they represent aggregate use for all inpatient locations reported by your facility. NHSN cannot tease apart the FacWideIN counts to know how many antimicrobial days and days present came from each individual inpatient location.
The SAAR models were developed for specific patient care locations. FacWideIN was not included in the SAAR modeling because it includes different patient and location types mapped within NHSN for each facility. Please refer to the list of locations in question #6 in this section to see which adult, pediatric, and neonatal location types can generate SAAR reports. To generate a SAAR report, you must report data from at least one of the individual inpatient location types listed in question #6 in this section.
Please refer to question #3 in the Locations section for additional information on limitations of reporting AU data for only the FacWideIN location.
None of the SAARs contain AU data from all locations in a facility. The closest alternative is the All Antibacterial Agents SAAR, which users can pool across all SAAR-eligible locations within any baseline year and baseline population. For example, you can pool observed and predicted antimicrobial days for All Antibacterial Agents across all 2023 baseline adult SAAR-eligible locations. You can do the same separately for 2023 baseline pediatric or neonatal SAAR-eligible locations. For additional guidance, please see Introduction to the NHSN 2023 Baseline SAAR Models and Analysis Reports [PDF – 2 MB].
NHSN uses data from the most recent Patient Safety Component Annual Hospital Survey for risk adjustment in the SAAR models at the facility-level. Once a facility completes the most recent survey and generates new data sets within NHSN, the SAAR reports update to use the most recent survey data for risk-adjustment. For example, prior to the completion of the 2025 survey, 2025 SAARs for facilities are risk adjusted based on the 2024 survey responses (the most recent survey data available). After completion of the 2025 survey, the 2025 SAARs are risk adjusted based on the 2025 survey responses.
It is possible that a facility’s survey responses moved them into a different risk adjustment category for one or more SAARs. The survey is due in March each year and it is normal to see small changes in the predicted antimicrobial days and in SAAR values compared to what they were before the survey was completed. Please refer to the “Anticipate shifts from annual survey risk adjustment updates” section of the SAAR Guide [PDF – 701 KB] for more information.
You can generate a SAAR by month, quarter, half year, year, or cumulative time periods. You can generate a SAAR report for a specific location or location type. To generate a SAAR by location and month, follow the steps in the SAAR Table – By Location Quick Reference Guide [PDF – 563 KB]. NHSN provides quick reference guides for each SAAR report on the Analysis Quick Reference Guides webpage.
No. Each SAAR includes a grouping of antimicrobial agents (except for pediatric azithromycin and neonatal ampicillin, fluconazole, and vancomycin). NHSN designed the SAAR antimicrobial agent groupings to enable hospitals and other entities to assess progress toward antibiotic stewardship goals. These categories are generally mutually exclusive, meaning individual antimicrobials are found in only one SAAR category, except for the SAAR for All antibacterial agents and the SAAR for Antibacterial agents posing highest risk for CDI, which include antimicrobials found in other SAAR categories. The SAAR antimicrobial groupings are listed in Appendix E in the AUR Module Protocol [PDF – 1 MB].
NHSN currently offers four SAAR baselines, each applicable to a select set of patient care locations and time periods.
| SAAR Baseline | Locations | Dates |
| 2014 baseline adult and pediatric SAARs | 6 adult and pediatric intensive care units (ICUs)
and wards |
January 1, 2014 – December 31, 2018 |
| 2017 baseline adult and pediatric SAARs | 13 adult and pediatric medical, surgical, medical-surgical ICUs, wards, step down units, and oncology units | January 1, 2017 – December 31, 2026 |
| 2018 baseline neonatal SAARs | 4 neonatal units, including step-down nurseries
and neonatal critical care units |
January 1, 2018 – December 31, 2026 |
| 2023 baseline adult, pediatric, and neonatal SAARs | 26 adult, 9 pediatric, and 4 neonatal units | January 1, 2023 – present |
Note: you cannot directly compare SAARs calculated under different baselines, i.e. 2014, 2017, 2018, and 2023 baselines because they include different baseline populations, risk adjustments, and SAAR agent categories.

You may not have the correct user rights to view the SAAR reports. NHSN uses the Patient Safety Component Annual Facility Survey for risk adjustment in the SAARs. Without access to the survey data, you cannot view the SAAR data. Review your user rights with your NHSN Facility Administrator and, once the Facility Administrator corrects your rights, generate new data sets. Refer to the guidance document [PDF – 492 KB] that outlines minimum AUR rights.
There are a few circumstances under which you cannot either generate SAAR reports or obtain a SAAR value for certain locations.
You will not be able to obtain a SAAR value in the following situations.
All SAARs:
- Locations reporting zero days present for the selected time period
- Locations reporting more antimicrobial days than days present for any SAAR agent category (except the adult and pediatric All Antibacterial Agents SAARs)
- Locations with less than one predicted antimicrobial day to enforce a minimum precision criterion
You will not be able to generate SAAR reports in the following situations:
Adult SAARs:
Adult SAAR locations in a long-term acute care (LTAC) hospital or rehabilitation hospital cannot generate SAAR reports. The 2023 SAAR baseline adult referent population does not include these facility types.
Pediatric SAARs:
Pediatric SAAR locations in a critical access, LTAC, oncology, orthopedic, pediatric LTAC, psychiatric, rehabilitation, surgical, women’s, or Veterans Affairs (VA) hospital cannot generate SAAR reports. The 2023 SAAR baseline pediatric referent population does not include these facility types.
Neonatal SAARs:
- Neonatal SAAR locations in a critical access, LTAC, oncology, orthopedic, pediatric LTAC, psychiatric, rehabilitation, or VA hospital cannot generate SAAR reports. The 2023 SAAR baseline neonatal referent population does not include these facility types.
- Facilities that indicate they do not care for neonates on the Patient Safety Annual Facility Survey. Specifically, hospitals that respond: “N/A, my hospital does not provide neonatal or newborn patient care services at any level.”
- Facilities reporting zero inborn and zero outborn admissions on the Patient Safety Component Annual Facility Survey.
If you tried everything in the FAQ above and still can’t generate a SAAR, please email the NHSN Helpdesk at nhsn@cdc.gov.
The NHSN AU Data Reports provide comprehensive summaries of SAAR distributions and percentages of use within SAAR antimicrobial agent categories across adult, pediatric, and neonatal locations. Percentile distributions for state-specific SAARs are also available. Note: percentile data is omitted for states with fewer than 10 reporting facilities due to insufficient data. For states with 10 to 19 reporting facilities, only median values are presented. The Inpatient Antibiotic Use profile within the Antimicrobial Resistance & Patient Safety Portal (AR&PSP) also enables users to view both national and state-specific SAAR data in an interactive format.
The SAAR distributions can help inform stewardship efforts by enabling hospitals to see how their SAARs compare to the national distribution. Facilities can use distributions to help set facility-specific SAAR goals. The percentage of AU by class and drug within a SAAR antimicrobial agent category provides insight into prescribing practices across differing patient locations, such as medical critical care units compared to medical wards. Facilities may evaluate these usage patterns in the context of their local treatment guidelines, antimicrobial resistance rates, and formulary.
Tracking AU over time using SAARs should be limited to comparing two SAAR values across two points in time. You can find more information about comparing two SAAR values in NHSN’s Guide to the SAAR [PDF – 701 KB]. You can also visually assess SAAR values over time to get a sense of whether values increased or decreased during that time period using the SAAR Plot report [PDF – 661 KB].
However, you should not use SAARs for trend analyses, where SAAR values are simultaneously compared across many points in time to determine whether there is a statistically significant change in AU.
Trend analyses, where SAAR values are simultaneously compared across many points in time to determine whether there is a statistically significant change in AU, may violate the proportionality assumption that the SAAR models rely on. When statistically (as opposed to visually) comparing any pair of SAARs, the comparison is most valid when the constant proportionality assumption is satisfied. Specifically, when the distribution of exposure among the model strata is proportional to that of the referent population. Please see NHSN’s Guide to the SAAR [PDF – 701 KB] for more information about scalability of the SAAR and the proportionality assumption.
For example, let’s say in the referent population for the pediatric antifungal SAAR model, the proportion of days present (exposure) was 80% in pediatric ICUs and 20% in pediatric wards. The SAAR models assume other facilities not in the referent population have a similar distribution of days present. If one facility has 50% of its days present in pediatric ICUs and 50% in pediatric wards, comparisons can still be made, but there is a higher chance that changes in SAAR values over time are due to this difference in exposure rather than due to other factors such as stewardship interventions. As the distribution of the exposure shifts over time, the chances of violating the constant proportionality assumption increase.
If you are comparing SAARs within one facility and the days present distribution does not change much across the factors in the model and your time period of interest, it may be fine to make pair-wise comparisons of SAARs across various time points (2022 vs. 2023, 2023 vs. 2024, 2024 vs. 2025 etc.).
You can also use rates for trend analyses to determine whether antimicrobial use has increased or decreased in a statistically significant way over your time period of interest. If you are assessing rates across various hospitals (rather than just within your own facility), you can work with a statistician to include risk factors from SAAR models as factors in the trend analysis.
Rates of inpatient AU in 2020-2021 for some SAAR agent categories were affected by rates of COVID-19 (see “Impact of the COVID-19 Pandemic on Inpatient Antibiotic Use in the United States, January 2019 Through July 2022”). AU patterns had begun to stabilize in 2023, making it a more appropriate and representative year to establish a new baseline.
In addition, facility participation in NHSN’s AU Option has greatly increased since 2017 and 2018. Using 2023 data allows the SAAR models to reflect more current AU and stewardship practices across a larger and more diverse set of facilities, while also supporting updates to SAAR antimicrobial agent categories and the addition of new SAAR-eligible location types.
Each SAAR baseline is built using a new set of models and data, so changes are expected when moving from the 2017/2018 baseline to the 2023 baseline. The models used to calculate predicted days of therapy may include different risk adjustment factors, and those factors may be defined or grouped differently. In some cases, there may be fewer or more factors included, and the cut-points or groupings within those factors may also change. Additionally, the parameter estimates used in the models will be updated.
SAARs created using the 2023 baseline may be higher than those created using the 2017/2018 baseline because SAARs have been recalibrated. For many SAAR types, national AU incidence in 2023 was lower than in 2017/2018, which can result in lower predicted values (the SAAR denominator) and, in turn, higher SAARs, even if observed use has not changed.
No. SAAR values calculated using different baselines should not be compared because each baseline represents different reference populations and risk adjustments.
When comparing SAARs from two time periods, both SAARs must have been calculated under the same baseline. For example, if you were to compare 2021 vs. 2022 adult SAARs, both should be generated using the 2017 baseline. When comparing 2023 vs. 2024 adult SAARs, both SAARs should be generated using either the 2017 or the 2023 baseline for both SAARs in the comparison.
No. The 2023 SAAR models are intended for use with data from January 1, 2023 and onward, so they should not be applied to earlier data. As with prior SAAR baselines, each baseline is based on a specific time period and set of patient care locations. The NHSN application will not generate 2023 SAARs for data prior to January 1, 2023, and attempting to do so will result in a “No Records Met Your Criteria” message.
No new location mapping is required. The NHSN AUR Module uses the same location mappings as the rest of your reporting within the NHSN Patient Safety Component, including HAI reporting. NHSN does not recommend mapping locations inaccurately to obtain SAARs or creating duplicate mappings for AUR reporting purposes. If you are already submitting AU data for a mapped location that is SAAR eligible under the 2023 baseline (e.g., mixed-acuity units or surgical cardiothoracic ICUs), then those data will automatically be included in the new 2023 SAAR reports.
Resources regarding the 2023 SAAR rebaseline are available on the NHSN 2023 AU SAAR Rebaseline page. This page provides an overview of the rebaseline and includes materials on the methods behind the 2023 SAAR update, webinars, educational resources, and quick reference guides. New educational materials will be added to this webpage as they become available.
Targeted Assessment for Stewardship (TAS)
The AU-CAD is the number of antimicrobial days needed to achieve a desired SAAR target. The higher the AU-CAD value, the greater the number of antimicrobial days that need to be reduced to meet the SAAR target.
NHSN calculates the AU-CAD by multiplying a numerical SAAR target value by predicted antimicrobial days and then subtracting that from observed antimicrobial days, rounded to the nearest whole number.
A positive AU-CAD value can be interpreted as the number of antimicrobial days to reduce per time period to decrease the SAAR value and reach your SAAR target. A negative AU-CAD value can be interpreted as the number of antimicrobial days to add per time period to increase the SAAR value and reach your SAAR target.
There are many factors to consider when defining target SAAR values. Unlike the HAI Targeted Assessment for Prevention (TAP) Strategy and Standardized Infection Ratios (SIRs), there are no national SAAR goals. Higher SAARs might reflect opportunities to improve use, but these values might be justified in some instances. Additionally, a SAAR value of 1.000 does not necessarily mean AU is ideal. Clinical judgement and patient information should be considered when interpreting SAAR values and setting SAAR targets.
SAAR target values may differ among facilities based on factors such as the original SAAR value for a given SAAR agent category, stewardship priorities, and clinical relevance. Additionally, SAAR target values may differ among SAAR agent categories and/or populations (adult, pediatric, neonatal) within a given facility.
The TAS Guide [PDF – 1 MB] contains resources to help you select SAAR targets.
No, zero is not an appropriate SAAR target. While working towards zero healthcare associated infections is a meaningful goal, zero antimicrobial use is not the goal of antimicrobial stewardship. Stewardship interventions focus on reducing inappropriate antimicrobial use, not eliminating antimicrobial use altogether.
You have to enter SAAR targets within the NHSN application before using the TAS reports or TAS dashboard. These SAAR target values will be saved and used each time you run TAS reports and TAS dashboard until you manually update the values. You can update your SAAR target values at any time by following the same steps.
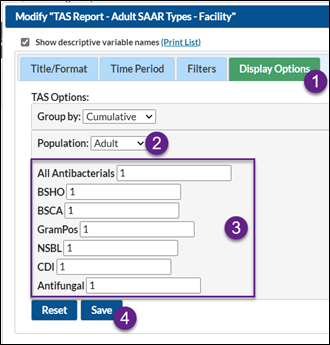
To enter your SAAR target values within the TAS Reports, select any TAS report and click Modify Report.
- On the Modification Screen, click the Display Options tab (see below screenshot).
- Note the population (adult, pediatric, or neonatal).
- Enter each SAAR target value.
- After entering your SAAR target values, click Save.
To enter your SAAR target values from the TAS dashboard, navigate to the TAS dashboard by selecting “Dashboard” from the lefthand menu in NHSN, and then “TAS Dashboard”.
- Note the population (adult, pediatric, or neonatal).
- Enter each SAAR target value.
- After entering your SAAR target values, click Save.
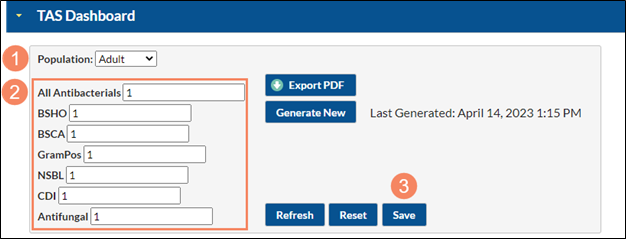
Please be sure to enter a SAAR target for each population and SAAR Type. Click Save after entering the SAAR target values for each population.
The Keys to Success with TAS webpage provides a flow chart and questions to help you choose which TAS report fits your needs. You can read more about each of the reports in the TAS Guide [PDF – 1 MB] and TAS quick reference guides.
The TAS reports and TAS dashboard are both tools to help stewards identify where stewardship efforts may have the greatest impact.
The TAS reports display AU-CADs for the most recent complete 12 calendar months at the group, facility, location group, and location level. The TAS reports are modifiable and allow you to drill down AU-CAD values by a variety of factors.
The TAS dashboard allows you to visualize AU-CAD values over time by quarter for the most recent complete four calendar quarters at the group, facility, and location level. Unlike the TAS Reports, the time period and level of aggregation displayed by the TAS Dashboard cannot be changed.
By default, the TAS reports use data reported from the most recent 12 calendar months. Specifically, a TAS report run on July 15, 2026, will automatically include all reported AU data from July 2025 through June 2026. You can modify the output to display tables according to calendar year, half-year, quarter, or month within that 12-month span. For example, a TAS report run on July 15, 2026, using the modification to “group by summaryYQ” would produce 4 tables for the quarters in the 12-month span between July 2025-June 2026 (Quarter 3, 2025, Quarter 4, 2025, Quarter 1, 2026, and Quarter 2, 2026). You cannot modify the TAS reports to include additional months outside of the most recent 12 calendar months.
The TAS reports and TAS dashboard include only those location types that can generate SAARs; in other words, the same locations in your SAAR reports will also be included in the TAS reports. See question #6 in the SAARs section for more information on which locations are included in the SAARs.