An official website of the United States government



Using NHSN AU Data to Deliver Automated Antibiotic Use Feedback to Colorado Hospital Stewardship Programs
- Automated antibiotic use (AU) feedback and adherence reports were feasible, scalable, and well-received.
- Reports fostered a connection between Colorado Department of Public Health and Environment (CDPHE) and antibiotic stewardship programs (ASPs) within hospitals.
- CDPHE provided analytic support that gave ASPs concise, comprehensive summaries of their hospital’s AU.
- AU feedback reports allowed hospitals to benchmark antibiotic use against Colorado hospitals of similar bed size and facility type.
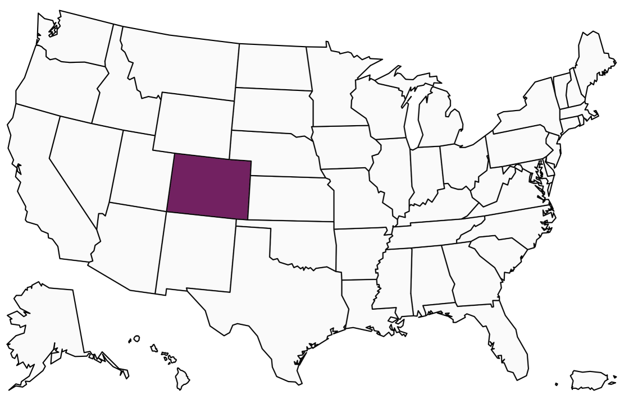
Tracking and reporting antibiotic use (AU) are core elements of antibiotic stewardship within hospitals. Some hospitals may benefit from having external analytic support when they lack internal resources. Through a data use agreement with NHSN, the Colorado Department of Public Health and Environment (CDPHE) obtained and analyzed hospital AU data and provided individualized AU feedback reports to ASPs across Colorado. CDPHE pulled AU data from NHSN and used statistical software to generate and update reports for all participating facilities at the same time. This approach minimized the CDPHE resources necessary to produce and distribute the reports.
The Need
Hospital ASPs can use AU data reported to NHSN to develop initiatives that target potential antibiotic overuse or underuse. In some cases, hospitals lack resources to review and analyze AU data from NHSN. In addition, hospital-level reports generated in NHSN do not provide ranked comparisons with nearby hospitals. State public health departments can access AU data for hospitals in their jurisdiction. They can provide hospitals with AU data by drug class, and the NHSN-produced risk adjusted comparison metric, the Standardized Antimicrobial Administration Ratio (SAAR), to support local benchmarking and ranking within their jurisdiction.
The Intervention
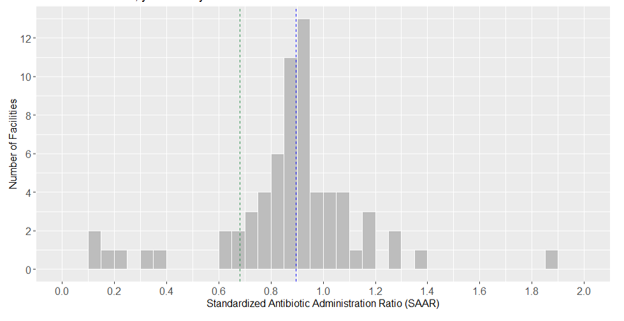
CDPHE’s AU feedback reports summarized data from the NHSN AU Option. CDPHE distributed reports in March and October each year. Each report included hospital AU rates for high-volume antibiotics, with comparison to rates from hospitals of similar type, bed size, and geographic regions of Colorado (example figures not shown). The reports also compared each hospital’s rate of prescribing for broad-spectrum antibiotics with rates from similar hospitals by region and bed size (Figure 1). In addition, the reports compared hospital SAAR values across adult categories to those of other Colorado hospitals, along with the statewide SAAR derived from the Targeted Assessment for Antimicrobial Stewardship (TAS) report (Figure 2). After soliciting feedback from hospitals, CDPHE added results from the NHSN AU Data Quality Line List [PDF – 998 KB] to the individualized AU feedback reports. CDPHE developed all data analyses and PDF generation scripts for the NHSN AU Supergroup datasets in R-Studio and R-Markdown. The analysis program produced a full report for each participating hospital. Reports included text, figures, data tables, quality alerts, and resources. The program was designed to be rerun as sites were added and data were updated.
Figure 1. Sample bar chart of rate of antimicrobial days of therapy per 1,000 days present by broad-spectrum antibiotic class.

- Figure 2. Sample histogram of 2017 baseline Standardized Antimicrobial Administration Ratios (SAARs) in the Adult All Antibacterial agents category from SAAR-eligible wards in Colorado hospitals reporting to the Antimicrobial Use Option of the National Healthcare Safety Network, January – June 2024. Blue-dashed line, state SAAR. Green-dashed line, your facility SAAR.
- Between May 2023 and September 2025, CDPHE distributed 373 AU feedback reports to all Colorado hospitals reporting AU data to NHSN (56 of 57 [98%] acute care hospitals and 24 of 31 [77%] critical access hospitals). Participating hospitals were located across the state and had a median bed size of 49, with a range of 8 to 828 beds. Among 14 hospitals that provided feedback, most users said AU feedback reports included meaningful visual comparisons and helpful data quality checks. Many facilities reported that they shared the reports with hospital leaders, pharmacists, prescribers, infection preventionists, nurses, laboratory personnel, ASPs, and steering committees.
The Result
AU feedback reports were feasible, scalable, and well-received. They created an opportunity for public health to connect with hospital ASPs and provide one-on-one mentorship in response to questions. Centrally developed, individualized reports can provide analytic support for ASPs by giving them concise, comprehensive summaries of their hospital’s AU and state-specific benchmarking against facilities of similar bed size and geographic location. Hospitals can share these reports with internal stakeholders and use them to inform ASP initiatives.
Contact the Healthcare-Associated Infection/Antimicrobial Resistance Program at cdphe_hai_ar@state.co.us with any questions or feedback.
Note: The findings and conclusions in this report are those of the authors and do not necessarily represent the official position of the Centers for Disease Control and Prevention.