Markup Include
Best Practices
Visit the new and updated Gallery!
Overview
The Markup Include visualization allows you to add an existing SSI into a Data Visualization dashboard. This was created so that textual information and imagery can be added to a dashboard, independent of the data that the dashboard is created from. Design elements can be added this way as well.
This element can be used to help the page user understand how to interact with the dashboard or interpret it. These elements are best applied to subsections of the dashboard needing context or overall dashboard guidance. If a single data visualization needs subtext, that can be added within the data visualization itself.
Note: Markup Include can currently only be used within a dashboard. Purpose-built single-use or reusable WCMS modules like a Text Box Module or an Image Module should be used as a stand-alone element on a page if a data visualization dashboard is not being used.
Go to examples at the bottom of this page to see some of the possible options.

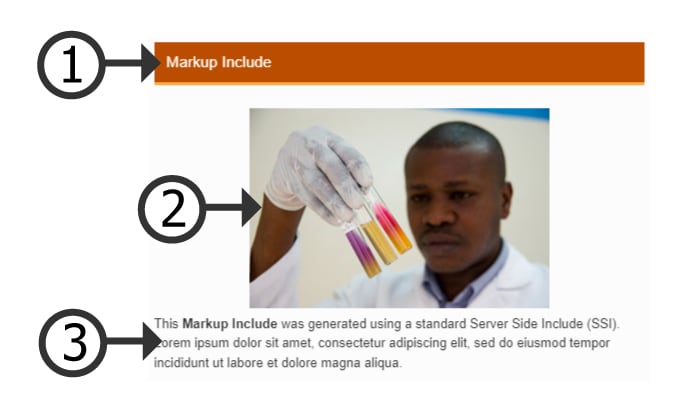
1. Title
This title is added in the Data Visualization Editor for the Markup Include. Its color can also be selected independently of the site template colors.
2. Added Element
Much like any WYSIWYG text element in the WCMS, you can “Add Element” from the “Insert” dropdown. This can be used to add any of the allowed imagery or design elements.
3. Text
The WYSIWYG editor will allow you to add any text with supported customizations.
- Go to ExamplesSee examples on this page that illustrate key options.
- Building in the WCMSSee key tips and guidelines for building a Markup Include in the WCMS.
- TP4 UX Best Practices [PPT - 14 MB]For general guidance on colors, layouts, and overall presentation, see this overview of TP4 best practices.
Usage
- When a static set of text or visuals is required
- To enhance the overall communication of the dashboard
Don’t Use:
- As a stand alone page element
- If a Data Bite static or variable image could be used with data
Other Guidance
- Markup Include Title: Good titles are helpful to the page user. However, consider if one is necessary visually or structurally for your dashboard.
- Customization: Keep the style choices for your Markup Include simple. Not all style choices will render exactly the way you created it in the SSI.
- Visual Clutter: Select the cleanest layout possible. If an image or a graphic isn’t needed, don’t add one.
- Other Modules: It may be better to simply add a row of modules before or after the dashboard to share insight or additional information instead of adding a Markup Include inside the dashboard.
Dynamic Markup Includes
Using the “Inline HTML” option of the Content Editor panel, you can set variables and insert them into your markup text. You must assign a dataset to the markup in order for this to work.
In the example below, change the state dropdown or click on the map and watch how the markup text changes.