About
- This page contains answers to commonly asked questions about the BEAM Dashboard.
- For additional questions, feedback, or comments, contact simso@cdc.gov.
Using the BEAM Dashboard
The BEAM (Bacteria, Enterics, Ameba, and Mycotics) Dashboard is an interactive tool to access and visualize data from the System for Enteric Disease Response, Investigation, and Coordination (SEDRIC) and the National Outbreak Reporting System (NORS). CDC uses SEDRIC to coordinate surveillance and response to disease outbreaks linked to food or animal contact, including data integration. The NORS View allows users to search and access data from reports of foodborne and waterborne disease outbreaks and enteric (intestinal) disease outbreaks spread by contact with environmental sources, infected people or animals, and other means. Other tabs in the BEAM dashboard focus on data for Salmonella, Shiga toxin-producing E. coli (STEC), Shigella and Campylobacter bacteria isolated from human specimens, such as stool or blood. This does include some antimicrobial resistance data.
This information provides the public, academia, industry, public health partners and regulatory agencies with timely data on pathogen trends and serotype details to inform work to prevent illnesses from food and water and all enteric illnesses from food, animal contact, water, person-to-person transmission, and the environment.
The dashboard also includes automated analytics describing Salmonella outbreak data for chicken, beef, pork, and turkey, and it will include other food categories soon. Markedly reducing infections caused by Salmonella has been a goal of the U.S. Department of Health and Human Services for decades. However, little progress has been made toward this goal during the past 25 years. Many Salmonella serotypes (types) make people sick. CDC has identified some concerning serotypes causing single-state and multistate outbreaks and is sharing data to inform partners and guide efforts on preventing infection by these types of Salmonella. Although most foodborne illnesses are not part of a recognized outbreak, outbreaks provide important information on the sources of illness, including the foods responsible.
SEDRIC integrates data from multiple sources, including PulseNet, the National Antimicrobial Resistance Monitoring System for Enteric Bacteria (NARMS), the National Outbreak Reporting System (NORS), and Epi Info, as well as investigation data from epidemiologists, environmental health partners, and state and federal regulatory agencies. The current dashboard uses PulseNet and NORS data, and we will integrate other data sources in upcoming versions.
Yes, click on the download links below to download BEAM dashboard datasets.
BEAM Dashboard – Isolates by HHS Region
For the annual and quarterly report tabs, data are updated monthly. We plan to increase the frequency to near real-time. For tabs that use NORS data (NORS and outbreak serotype tabs), we update the dashboard annually when NORS data are available.
To view tabular data, right click on any visualization and select "Show as a table."
You can filter data using the filter pane in the dashboard. To select a year or Department of Health and Human Services (HHS) region, click on the relevant filter. For the annual and quarterly report tabs, to select multiple years or regions, press and hold the Ctrl (PC) o Cmd (Mac) key on your keyboard while clicking on the filter. Additionally, you can select a variable in one of the other interactive visuals to filter data based on that variable. For example, if you select "April" in "Number of Isolates by Month," the other visuals show data for April only. Hovering over any state in the map (New Outbreaks by State) will provide pop-up isolate data for that state.
For information on filtering data in the NORS View, see "How can I customize my search?" in the "Using the NORS View" section below.
An outbreak is defined as two or more cases of similar illness associated with a common exposure. For example, when two or more people get the same illness from the same contaminated food or drink, the event is called a foodborne disease outbreak. Similarly, when two or more people get the same illness from contact with the same animal or animal environment, the event is called an animal contact outbreak.
A bacterial isolate is a group of the same type of bacteria. In public health surveillance systems, an isolate can come from a patient's clinical sample or from the environment, a food, or animal. Scientists use a standardized laboratory and data analysis method called whole genome sequencing to get detailed information about the bacterium, including whether it is closely related genetically to other bacteria.
Serotypes are groups within a single species of microorganisms, such as bacteria or viruses, which share distinctive surface structures. Salmonella has many serotypes. Some can cause especially severe illnesses when they infect people, while others cause milder illnesses.
The quarterly report compares isolate data for the top 15 most common serotypes during the selected quarter with the average during the same quarter in the previous two years. You can filter data by selecting the quarter from the quarter filter.
The Office of Intergovernmental and External Affairs hosts 10 regional offices that directly serve state and local organizations. The regional directors ensure that HHS maintains close contact with state, local, and tribal partners and addresses the needs of communities and individuals served through HHS programs and policies.
PulseNet offers guidelines (shown below) based on the context of the sample submission. However, submitter's interpretation can vary as rigid definitions may not apply to all scenarios. For example, feces might be considered environmental if part of a Food and Drug Administration (FDA) investigation (e.g., romaine lettuce outbreak) or categorized as animal waste in Food Safety and Inspection Service (FSIS) and public health laboratories (PHL) uploads related to canines.
Human: A sample collected from a patient.
Food: Any sample collected from an article consumed or intended to be consumed by humans or animals, including retail meats, raw materials, and ingredients.
Animal: Any sample collected from a land or aquatic animal, including live animals intended to be used as food, companion animals, wildlife, and pests, and including samples collected from animal carcasses or animal feces.
Environmental: Any sample collected from surfaces, water, air, soil, wastewater, food packaging, food production environments, and runoff from built environments.
It is important to note that FDA may choose environmental as the source type for animal waste (i.e., manure collected in the environment), and public health labs and FSIS may choose animal for animal waste (i.e., livestock feces, canine feces or ceca collected from the animal). The differences in source type for animal waste may be due to FDA collecting feces/manure from the environment and public health laboratories and FSIS collecting feces from the animal.
The interactive charts and graphs can help guide prevention efforts to reduce Salmonella infections.
- The "Outbreak Serotypes of Concern" tab has data on the burden and trajectory of outbreak illnesses caused by specific Salmonella serotypes, by food category
- The "Data Behind Outbreak Serotypes of Concern" has data on the number of outbreak illnesses and outbreaks caused by specific Salmonella serotypes, by food category and year
Other data sources should also be considered in assessing serotypes of concern because serotypes that caused outbreaks may differ from those responsible for most illnesses.
Only serotypes that caused outbreaks associated with each food category during 10 consecutive years ending with the year selected were considered in this analysis. For example, if 2020 is selected, data from 2011 through 2020 were used.
Outbreak burden
Outbreak burden was calculated as the sum of illnesses associated with outbreaks linked to the food category considered for that serotype in the most recent 5 years. For example, if 2020 is selected, data from 2016 through 2020 were considered the most recent 5 years analyzed.
- "High" corresponds to values in the 75th–100th percentile.
- In 2026, two additional criteria were added to be classified as “High” burden, both of which need to be met. If not met, the serotype is categorized as “Moderate”
- The number of outbreak illnesses linked to that serotype must be more than 1% of all outbreak illnesses for the same 5-year period across all food categories that are analyzed, AND
- The number of outbreak illnesses linked to that serotype must be more than the mean number of outbreak illnesses linked to each serotype over the 5-year period for that food category.
- "Moderate" corresponds to values in the 51st–74th percentile, or in the 75th-100th percentile that do not meet the criteria above.
- "Low" corresponds to values in the 0–50th percentile.
- "No outbreak illnesses" corresponds to serotypes that did not cause an outbreak during the most recent 5 years but caused an outbreak during the previous 5 years.
To determine percentile, we ordered serotypes that caused Salmonella outbreaks linked to a particular food category during the most recent 5-year period by number of illnesses, with serotypes that caused the most illnesses at the top.
- Serotypes that did not cause an outbreak during the most recent 5 years were not included in the percentile calculation. The 75th percentile corresponds to the value that 75% of outbreak illnesses during a 5-year period would be below.
- The number of serotypes listed may depend on the number that caused outbreaks for each food category during a 10-year period.
- It is important to note that the values at or above the 75th percentile are not likely to represent 75% of all outbreak illnesses for that food category. This proportion will vary based on the distribution of the outbreak illnesses by serotype.
This approach was modified in 2026 to better account for the temporary effect of the COVID-19 pandemic on foodborne illness and outbreaks, and to ensure that only serotypes causing a more substantial number of outbreak illnesses were assigned the "high burden" category.
- This issue was noted during review of 2024 data, when two serotypes, Widemarsh and Thompson, were initially classified as "high burden" despite causing far fewer outbreak illnesses (18 and 19, respectively) than the other serotype that received this designation (Enteritidis, 452 outbreak illnesses).
- This method change was applied to previous years analyses and resulted in the following serotypes being downgraded to "moderate" burden for the following food categories and years.
- Chicken: 2023 (Blockley), 2020 (I 4,[5],12:i:-)
- Beef: 2021 (Typhimurium, Dublin), 2020 (Typhimurium, Dublin)
- Pork: none
- Turkey: 2023 (Hadar), 2022 (Hadar, I 4,[5],12:i:-)
- Vegetables: 2023 (Mississippi, Typhimurium, Thompson), 2022 (Mississippi), 2021 (Enteritidis), 2020 (Miami)
- Fruits: none
Outbreak illness trajectory
Outbreak illness trajectory was calculated as follows:
- Counts of 0 illnesses during the most recent 5 years or previous 5 years were changed to 0.5.
- The number of illnesses associated with outbreaks linked to the food category in the most recent 5 years was subtracted from the number of illnesses associated with outbreaks linked to the food category in the previous 5 years.
- The relative change was determined by dividing this number by the number of illnesses associated with outbreaks linked to the food category in the previous 5 years.
Trajectory categories:
- "Increased" trajectory is defined as a 50% or greater increase in the most recent 5 years compared with previous 5 years.
- "Stable" trajectory is defined as less than a 50% increase, no change, or less than a 50% decrease.
- "Decreased" trajectory is defined as a 50% or greater decrease.
Measures could be implemented along the farm-to-fork continuum to reduce Salmonella infections transmitted by each food category.
- Intensify prevention measures: This may be considered for 1) serotypes with high burden and increased trajectory and 2) serotypes with moderate burden and increased trajectory, which may indicate an emerging problem with a unique opportunity for focused prevention measures. Industry, academic partners, and regulatory agencies could evaluate current measures and use findings to design and implement new measures or intensify current measures.
- Enhance prevention measures: This may be considered for serotypes with high burden and stable trajectory; these serotypes have continued to cause outbreaks and ongoing illness. Industry, academic partners, and regulators could evaluate current measures to determine how and if they could be improved or whether additional measures should be implemented.
- Continue prevention measures: This may be considered for serotypes with high burden and decreased trajectory, moderate burden and decreased or stable trajectory, and all serotypes with low burden.
- Continue surveillance: Surveillance is needed for all serotypes regardless of burden or trajectory. This includes surveillance of illnesses in people and detection of pathogens in food products, production or processing plants, food-producing animals and their environments, and food growing environments.
Suggested Citation for BEAM Dashboard:
Centers for Disease Control and Prevention (CDC). BEAM (Bacteria, Enterics, Ameba, and Mycotics) Dashboard. Atlanta, Georgia: U.S. Department of Health and Human Services. www.cdc.gov/beam/dashboard/index.html. Accessed MM/DD/YYYY.
The dashboard shows the percentage of outbreak-associated isolates that have clinically important antimicrobial resistance. This percentage is calculated by dividing the number of isolates with resistance determinants (resistance genes and mutations) for antibiotics recommended for treatment by the total number of sequenced isolates analyzed by the National Antimicrobial Resistance Monitoring System (NARMS).
NARMS uses special software to predict resistance based on the bacterial genomes of whole genome sequenced isolates in PulseNet. This method of predicted resistance correlates well with traditional antimicrobial susceptibility testing for enteric pathogens.
For Salmonella and Shigella, we define clinically important resistance as the presence of at least one resistance determinant for at least one of five antibiotics recommended for treatment (ampicillin, azithromycin, ceftriaxone, ciprofloxacin, or trimethoprim-sulfamethoxazole). For Campylobacter, we define clinically important resistance as the presence of at least one resistance determinant for either ciprofloxacin or azithromycin. For Shiga toxin-producing E. coli (STEC), we do not report resistance information because antibiotics are not generally recommended to treat STEC infection.
For more information about resistance data for enteric pathogens, see NARMS Now: Human Data.
Using the NORS view
No. The NORS View does not have information on all disease outbreaks for several reasons:
- NORS collects information only on disease outbreaks of enteric illness, except for some non-enteric illness outbreaks spread through contaminated food or water.
- NORS does not collect information on disease outbreaks that result from an exposure in a non-U.S. location. For example, an outbreak linked to people who became ill after eating a contaminated meal when traveling outside the country, even if the person became ill after returning to the United States.
- Health departments might not report all foodborne, waterborne, or enteric disease outbreaks to NORS.
- Some outbreaks are never identified.
- Some outbreaks are not investigated.
- Some outbreak investigations cannot be completed.
- The NORS View contains only information reported to NORS that CDC has reviewed.
The default view for the NORS View shows data for all outbreaks reported to NORS.
You can customize your search in several ways.
- Primary Mode of Transmission: Select types of outbreaks.
- Year: Specify a date range.
- State: Select states and territories where outbreak cases were exposed
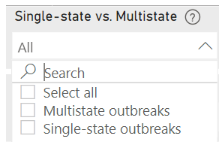
- Single-state vs. Multistate: Choose to include multistate or single-state outbreaks only.
- Etiology (Cause):Select which agents to include, such as Salmonella or norovirus.
- Setting: Select specific settings, such as long-term care facilities or restaurants.
For foodborne disease outbreaks, you can select:
- Food/Ingredient: Search by food, including those with more than one ingredient, and by ingredients.
- IFSAC Category: Search by food category, as defined by the Interagency Food Safety Analytics Collaboration (IFSAC)
For enteric disease outbreaks associated with animal contact, you can select:
- Animal Type: Select one or more animal sources associated with the outbreak, such as goat or dog.
For waterborne disease outbreaks, you can select:
- Water Exposure: Select one or more water exposures, such as treated recreational water or drinking water.
- Water Type: Select types of venues or systems to include
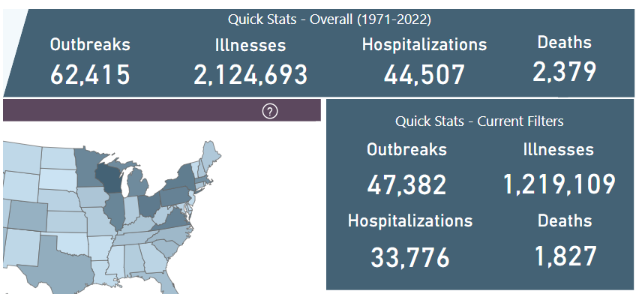
In "Quick Stats — Overall," you'll find the number of outbreaks, illnesses, hospitalizations, and deaths for all outbreaks in the NORS View. If you perform a search, you'll see customized numbers for your search in "Quick Stats — Current Search."
A multistate outbreak is defined as an outbreak in which exposures to the implicated source (such as a food item or drinking water supply) occurred in more than one state.
When a user searches for outbreaks in a particular state, the tab shows all single-state outbreaks and multistate outbreaks in which that state was involved. The number of illnesses listed for each multistate outbreak represents the total number in all states involved in the outbreak. Similarly, the number of hospitalizations and deaths includes those for all states with cases in the multistate outbreak.
When a user searches for multistate outbreaks only, without a particular state specified, the map may display case counts by state among multistate outbreaks. Of note, case counts by state for multistate outbreaks are only available starting in 2009.
In a single-state outbreak, exposure to an outbreak source, such as a food or swimming pool water, occurs in only one state. However, ill people may live in states other than the one where they got infected.
An etiology is the cause of the outbreak. The NORS View lets you select genus or name among bacterial, viral, parasitic, chemical, and toxic agents. You may also select "unknown." For more information on the etiologies you select, visit data.cdc.gov to download data.
When you download the full NORS dataset from data.cdc.gov, you can see if the etiology of an outbreak was confirmed or suspected.
In general, NORS reporting sites follow CDC's "Guide to Confirming an Etiology in Foodborne Disease Outbreak" when determining whether the etiology is confirmed or suspected. However, not all outbreak reports use these definitions. NORS etiology data reflect what was reported to NORS and reviewed by CDC.
You can type a specific food into the "Food/Ingredient" field using the Search bar or select foods from the drop-down list. Doing so will search both the food and the contaminated ingredient fields for your specified food. However, the NORS dataset contains more than 2,000 food names and variations, so searching on a single food name may not provide complete information on all outbreaks linked to that type of food. For example, outbreaks linked to contaminated beef in hamburgers could be entered under beef, hamburger, or both. As a result, searching for "beef" alone may not identify all outbreaks linked to beef hamburgers. You should include all relevant variations of a specific food.
To see all of the food variables associated with your search, you can download data from data.cdc.gov. When you download search data, you also will see a food category for each food and contaminated ingredient, if available.
A food vehicle is the contaminated food item a person ate before becoming sick. It may contain more than one ingredient. When searching for a food, both of these fields will be included in the search.
If a contaminated ingredient is listed in NORS View, it is more specific than the food vehicle and is the specific food or ingredient in the food vehicle that was implicated. For example, in August 2010, Michigan reported an outbreak of 41 illnesses caused by Salmonella serotype Javiana. Potato salad was the food vehicle; yellow onion was the contaminated ingredient.
If a contaminated ingredient is not listed in NORS View, the food vehicle category provides the best information available.
NORS uses data from both the implicated food and contaminated ingredient fields to assign foods to a category from the Interagency Food Safety Analytics Collaboration (IFSAC) Food Categorization Scheme. If a contaminated ingredient is reported, that takes precedence for category assignment. For example, if the food vehicle in the outbreak is a chicken Caesar salad, and the contaminated ingredient is reported to be chicken, the most specific IFSAC category that could be assigned would be "chicken". In many cases, sufficient data are not available to assign an outbreak to a single, specific food category.
The specific category captured in the IFSAC category filter is the Current Analytical Food Category (CAFC). There are 24 CAFCs, each of which contains enough outbreaks to facilitate appropriate outbreak summary analyses.
Animal contact is defined in NORS as contact with an animal; its bodily fluids (excluding raw milk or other fluids consumed as food), fur, hair, feathers, scales, or skin, its food, or the animal's environment.
You can search for animal names or select specific animal(s) using the dropdown list under the Animal Type filter. The Animal Type filter describes the implicated animal source (both confirmed and suspected) associated with the outbreak. The NORS dataset may contain multiple variations of the same animal name, so searching on a single animal name may not provide complete information on all outbreaks linked to that type of animal. You should include all relevant name variations of a specific animal. An outbreak may also contain multiple implicated animals.
The water exposure category describes how the people in the outbreak were exposed to contaminated water. For example, the treated recreational water category includes outbreaks that involve people who got ill after swimming in a pool or another water venue.
The five water exposure categories in NORS are:
- Treated recreational water
- Untreated recreational water
- Drinking water
- Other/Environmental water
- Undetermined water (for example, when multiple water exposures were suspected and no single exposure was confirmed as the exposure responsible for the outbreak).
The water type category describes the water venue (for example, swimming pool or lake) or water system (such as a public water system or private well) that contained or distributed the contaminated water.
Some waterborne disease outbreaks are caused by germs, such as Legionella, that can grow inside the water pipes of a building. When drinking water outbreaks caused by these germs are reported in NORS, the water type describes the drinking water system that supplied the water to the building. This does not necessarily mean that the water coming into the building was contaminated.
A water type may not be listed in the NORS View, if it was not identified or reported. In that situation, the water exposure category provides the best information available about the source of the contaminated water.
- Hospitalizations: The number of hospitalizations reported
- Info on Hospitalizations*: The number of ill people for whom information on hospitalization is available
- Deaths: The number of deaths reported
- Info on Deaths*: The number of ill people for whom information on death is available
Often, outbreak investigators can't obtain information for all the sick people in the outbreak, so the "Info on Hospitalizations" or "Info on Deaths" numbers may be smaller than the number of illnesses reported.
*These fields are not available for outbreaks that happened before 2009.
The NORS View includes data
- from 1998 through the most recent year of available data* for foodborne outbreaks,
- from 1971 through the most recent year of available data* for waterborne outbreaks, and
- from 2009 through the most recent year of available data* for outbreaks associated with all other modes of transmission.
*CDC typically updates the NORS dataset once a year. This updating schedule allows CDC to review NORS reports and work with local, state, and territorial health departments to fill in missing information and to correct possible errors. However, this process means the most current year(s) of data may not be available through the NORS View. The years of data available may vary by mode of transmission.
Yes. The original NORS reporting forms from 2009 were based on forms used for surveillance of foodborne and waterborne disease outbreaks and included additional questions for other modes of transmission. NORS forms have been updated over time as outbreak surveillance has changed.
Please contact NORSDashboard@cdc.gov if you have questions about how variables might have changed over time.
Data in the NORS View come from NORS. NORS outbreak reports can be entered and edited at any time, even months or years after an outbreak occurs. Therefore, data in the NORS View may differ from data previously published.
Yes. The data included in NORS View and downloadable on data.cdc.gov are a subset of all available data fields. Therefore, these data alone may not completely represent the findings of all reported outbreak investigations.
If you have questions about NORS data or would like to request a more detailed dataset for analysis or publication, contact NORSDashboard@cdc.gov.
COVIS data
Cholera and Other Vibrio Illness Surveillance (COVIS) is a national surveillance system at CDC that tracks cases of human infections with pathogenic (illness-causing) species of the family Vibrionaceae, which cause vibriosis and cholera. COVIS helps public health officials monitor, investigate, and respond to these infections.
COVIS collects data on laboratory-confirmed Vibrio infections through a standardized reporting form, which captures information about illnesses, including:
- Laboratory testing method and species identified
- A comprehensive description of the individual's illness and any underlying health conditions
- Information on recent seafood consumption
- Data on recent exposures to bodies of water, raw or live seafood, seafood drippings, or marine life
- Source(s) of implicated seafood
BEAM Dashboard includes COVIS data on culture-confirmed and probable cases of vibriosis reported to CDC from 2018 through the most recent year of available data*. It does not display cases of toxigenic V. cholerae O1, otherwise known as cholera. Data can be filtered by Vibrio-positive test type (i.e., all cases, bacterial culture, or culture-independent diagnostic test (CIDT) only) and selected species (among the top 5 most reported species).
If you have questions about COVIS data or would like to request a more detailed dataset for analysis or publication, contact COVISResponse@cdc.gov.
State and territorial health departments submit data to COVIS. These health departments gather information from local health departments, laboratories, healthcare providers, and ill people.
BEAM Dashboard includes COVIS data on culture-confirmed and probable cases of vibriosis reported to CDC from 2018 through the most recent year of available data*. It does not display cases of toxigenic V. cholerae O1, otherwise known as cholera. Data can be filtered by Vibrio-positive test type (i.e., all cases, bacterial culture, or culture-independent diagnostic test (CIDT) only) and selected species (among the top 5 most reported species).
If you have questions about COVIS data or would like to request a more detailed dataset for analysis or publication, contact COVISResponse@cdc.gov.
*The most current year(s) of data may not be available through the BEAM Dashboard because of time needed to confirm accuracy of the information.
COVIS data for some years were published in annual reports that are available on the COVIS webpage and CDC Stacks.
Free-living Ameba
FLASS is CDC's database for collecting information about free-living ameba (FLA) infections in humans including those caused by Acanthamoeba (non-keratitis), Balamuthia mandrillaris, and Naegleria fowleri. FLASS helps public health officials monitor, investigate, and respond to these infections.
FLASS collects data on confirmed cases of free-living ameba infections in the United States including those caused by Acanthamoeba species (non-keratitis infections), Balamuthia mandrillaris, and Naegleria fowleri. A standardized reporting form is used to collect information about the infections, including:
- Laboratory testing method and species identified
- A description of the patient's illness and any underlying health conditions, clinical imaging and treatment
- Information on recent exposure(s) to water and soil
Data will be updated once per year following CDC’s annual case closeout review with the reporting jurisdictions.
Data on Naegleria fowleri infections from 1930–1960 were retrospectively diagnosed in 1970 at the Centers for Disease Control and Prevention using banked cerebrospinal samples. Associated metadata for these cases may be limited.
State and territorial health departments voluntarily submit data to FLASS. These health departments gather information from local health departments, laboratories, healthcare providers, and patients with these infections.
Data from 1960–2025 are available in the BEAM Dashboard. Case-level data is not available and will not be released to protect patient privacy.
Because there are so few cases of FLA reported each year, certain images and statistics cannot be displayed within the BEAM Dashboard; this is to protect the privacy of individual patients. If filtering criteria limit to 5 or fewer cases further breakdown of the data will not be available.
State of exposure was not always clear for Acanthamoeba and Balamuthia. For those pathogens, state of residence is reported. Naegleria fowleri reports state of exposure.
Data reported in FLASS are passively collected. Data may be missing or incomplete, particularly for cases before 2012 when no standard case definition for FLA existed. FLA are not nationally notifiable and may not be reportable conditions in some states.
Unless otherwise noted, unknown values were included in the denominator of frequencies for FLA.
Tap water includes domestic aquatic activities (such as sprinklers and hose recreation) and nasal irrigation with tap water.