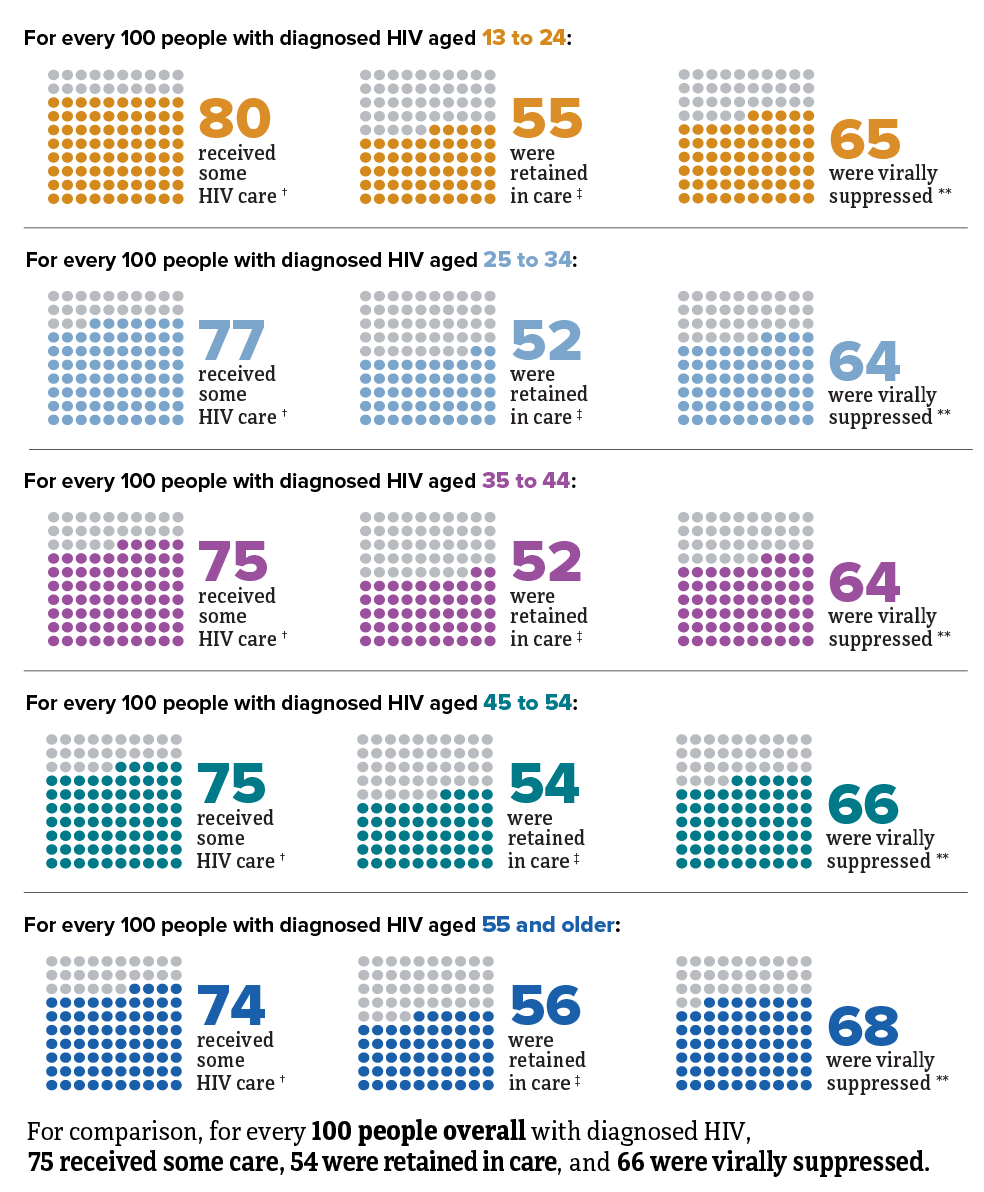
HIV in the United States by Age: Viral Suppression
Viral suppression is one of the six Ending the HIV Epidemic in the U.S. indicators. Viral suppression refers to the percentage of people with diagnosed HIV who have less than 200 copies of HIV per milliliter of blood.


* Data not available for children aged 12 and under.
† At least 1 viral load or CD4 test.
‡ Had 2 viral load or CD4 tests at least 3 months apart in a year.
** Based on most recent viral load test.
Source: CDC. Monitoring selected national HIV prevention and care objectives by using HIV surveillance data—United States and 6 dependent areas, 2021. HIV Surveillance Supplemental Report 2023;28(4).
Many people with HIV experience challenges with achieving and maintaining viral suppression over time. Some of these challenges include HIV stigma, physical health, mental health, and structural issues—such as food insecurity, unemployment, and unstable housing or homelessness.
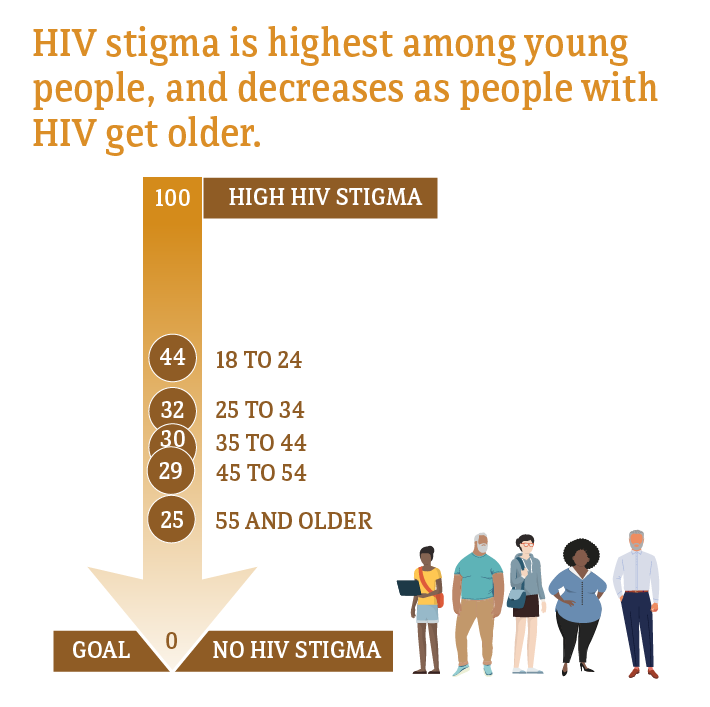
Median HIV stigma scores are presented based on a ten-item scale ranging from 0 (no stigma) to 100 (high stigma) that measures personalized stigma during the past 12 months, current disclosure concerns, current negative self-image, and current perceived public attitudes about people with HIV.
* Data not available for people aged 17 and under.
Source: CDC. Behavioral and clinical characteristics of persons with diagnosed HIV infection—Medical Monitoring Project, United States 2020 cycle (June 2020–May 2021). HIV Surveillance Special Report 2022;29.
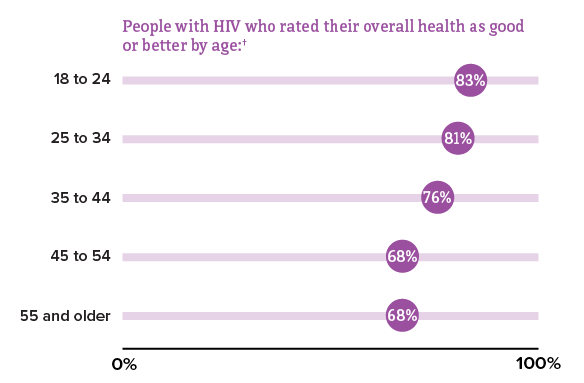
* Data not available for people aged 17 and under.
†Good or better self-rated health is defined as rating one’s health as good, very good, or excellent (as opposed to poor or fair) at the time of interview.
Source: CDC. Quality of life and HIV stigma—Indicators for the National HIV/AIDS Strategy, 2022–2025, CDC Medical Monitoring Project, 2017–2020 cycles. HIV Surveillance Special Report 2022;30.

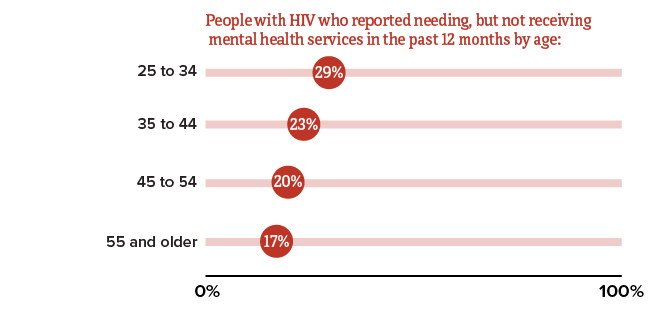
* Data not available for people aged 24 and under.
† Among people with diagnosed HIV who reported an unmet need for mental health services in the past 12 months.
Source: CDC. Quality of life and HIV stigma—Indicators for the National HIV/AIDS Strategy, 2022–2025, CDC Medical Monitoring Project, 2017–2020 cycles. HIV Surveillance Special Report 2022;30.
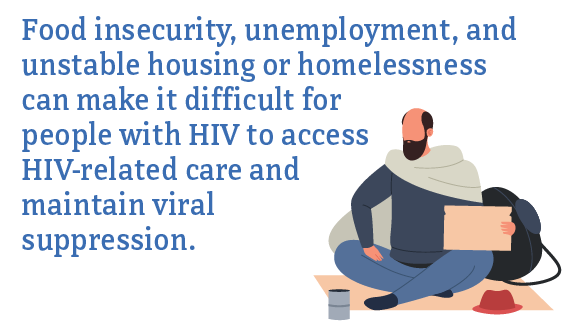
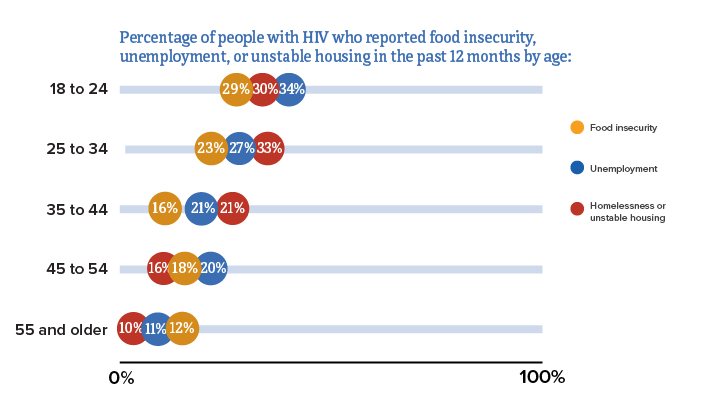
* Data not available for people aged 17 and under.
Source: CDC. Quality of life and HIV stigma—Indicators for the National HIV/AIDS Strategy, 2022–2025, CDC Medical Monitoring Project, 2017–2020 cycles. HIV Surveillance Special Report 2022;30.
-
- CDC. Diagnoses of HIV infection in the United States and dependent areas, 2021. HIV Surveillance Report 2021;34.
- CDC. Estimated HIV incidence and prevalence in the United States 2017–2021. HIV Surveillance Supplemental Report 2023;28(3).
- CDC. Monitoring selected national HIV prevention and care objectives by using HIV surveillance data—United States and 6 dependent areas, 2021. HIV Surveillance Supplemental Report 2023;28(4).
- CDC. HIV infection risk, prevention, and testing behaviors among persons who inject drugs—National HIV Behavioral Surveillance: injection drug use, 23 U.S. Cities, 2018. HIV Surveillance Special Report 2021;24.
- CDC. Sexually transmitted disease surveillance, 2021. Accessed April 26, 2023.
- National Institute on Aging. HIV, AIDS, and older people. Accessed April 26, 2023.
- CDC. Quality of life and HIV stigma—Indicators for the National HIV/AIDS Strategy, 2022–2025, CDC Medical Monitoring Project, 2017–2020 cycles. HIV Surveillance Special Report 2022;30.
- CDC. Behavioral and clinical characteristics of persons with diagnosed HIV infection—Medical Monitoring Project, United States 2020 cycle (June 2020–May 2021). HIV Surveillance Special Report 2022;29.
