State Statistics
The Behavioral Risk Factor Surveillance System (BRFSS) is the best source for state-specific arthritis prevalence estimates. BRFSS is a state-based, random-digit-dialed telephone survey of the noninstitutionalized, civilian US population aged 18 years or older. The survey is administered in all 50 states, the District of Columbia, and three territories. Since 1996, selected states have been collecting information on arthritis through BRFSS.
Arthritis and BRFSS History
- Starting with the 2003 BRFSS and continuing in odd-numbered years, all states collected information on arthritis. From 1996 through 2001 and from 2002 to present, the survey used different questions to collect data.
- In 2002, the case definition of arthritis also changed. Beginning in 2002, CDC’s Arthritis Program has focused on doctor-diagnosed arthritis only.
- In 2011, additional survey changes were made. The 2011 BRFSS data reflect a change in weighting methodology (raking) and the addition of cell phone only respondents. For these reasons, it is not valid to look at trends that cross from 2001 into 2002 or from 2010 into 2011 and later.
- Beginning in 2012, the arthritis case definition has been collected annually, while other arthritis information continues to be collected in odd-numbered years.
Thus, 2011 is the new baseline for data trends, and prior years should not be incorporated in any trend analysis using 2011 data to present. Read more about the BRFSS arthritis-specific questions and the arthritis case definitions.
This Morbidity and Mortality Weekly Report surveillance summary on arthritis prevalence can help improve the understanding of arthritis differences and the impact at the state and local level. This release is the first comprehensive report of state-level estimates for adults with arthritis using 2015 BRFSS data. The findings highlight large geographic variability in prevalence, health-related characteristics, and management of arthritis.
Access the report: “Geographic Variations in Arthritis Prevalence, Health-Related Characteristics, and Management — United States, 2015.”
State Data of Arthritis Prevalence by Select Characteristics
View the state-specific state arthritis data from the 2011, 2013, and 2015 BRFSS on the Chronic Disease Indicators (CDI) Interactive Database. CDC’s Arthritis Program analyzed BRFSS arthritis data for all 50 states, the District of Columbia, Puerto Rico, and Guam.
Arthritis Prevalence Maps
The maps below show the age-adjusted prevalence of arthritis for each state. Estimates are based on the 2015 BRFSS.
Prevalence by State (Age-Adjusted)
Arthritis is reported by at least 1 in 6 adults in every state. In the 15 states with the highest prevalence, arthritis affects up to 1 in 4 adults.

Click here to view the data table [XLS – 14KB] for this map.
View an interactive map within the Chronic Disease Indicators Database.
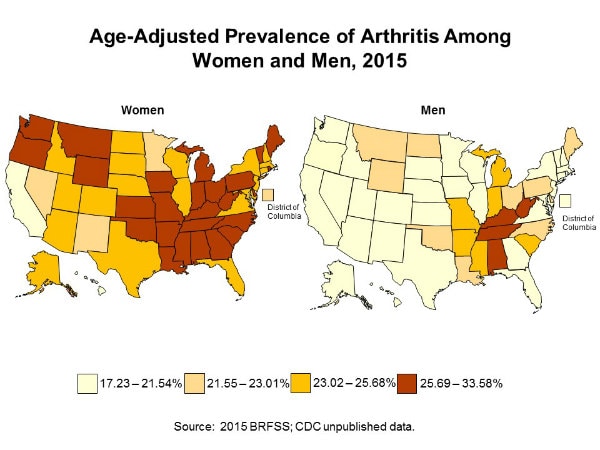
Arthritis in Women and Men (Age-Adjusted)
Women have a higher age-adjusted prevalence of arthritis than men in every state. When examined by the same prevalence cutoff points (17.23%–21.54%; 21.55%–23.01%; 23.02%–25.68%; and 25.69%–33.58%), there are only four states in which both women and men are in the highest prevalence group (Kentucky, West Virginia, Tennessee, and Alabama). For the most part, women were in the middle and high prevalence groups, while men are in the lowest prevalence group. In the majority of jurisdictions (31 states), at least 1 in 4 women reported having arthritis.
Click here to view the data table [XLS – 11KB] for this map.
To view state-specific prevalence estimates in men and women, go to the interactive map in the Chronic Disease Indicators database and select Gender in the “View by” drop down menu.
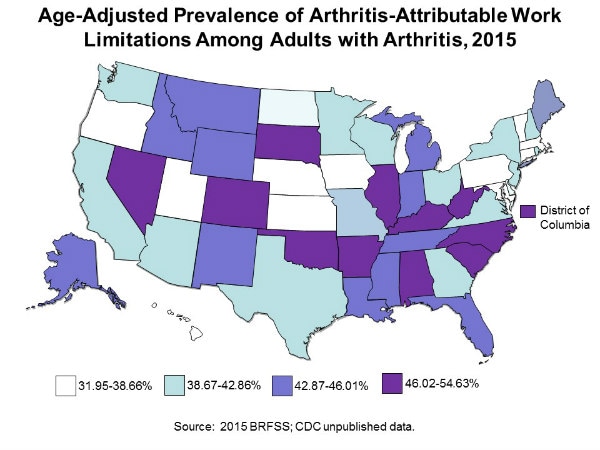
Work Limitation Attributable to Arthritis Among Adults with Arthritis (Age-Adjusted)
Arthritis-attributable work limitation is very common among working-age (18 to 64 years) adults with arthritis. In states with the lowest prevalence of arthritis-attributable work limitations, it is still reported by almost 1 in 3 working-age adults with arthritis (32%). In states with the highest prevalence of arthritis-attributable work limitation, the prevalence is about half of working-age adults with arthritis.
Click here to view the data table [XLS – 174KB] for this map.
Activity Limitations Attributable to Arthritis Among Adults with Arthritis (Age-Adjusted)
The age-adjusted prevalence of arthritis-attributable activity limitations among adults with arthritis is substantial. In every state, at least 1 in 3 adults with arthritis reports arthritis-attributable activity limitations. In some states, the prevalence is more than half of adults with arthritis.

Click here to view the data table [XLS – 13KB] for this map.
View an interactive map within the Chronic Disease Indicators Database.
Social Participation Restriction Attributable to Arthritis Among Adults with Arthritis (Age-Adjusted)
The prevalence of age-adjusted arthritis-attributable social participation restriction ranges from about 1 in 8 to more than 1 in 4 adults with arthritis across states, indicating that it is a substantial problem.

Click here to view the data table [XLS – 14KB] for this map.
Severe Joint Pain Attributable to Arthritis Among Adults with Arthritis (Age-Adjusted)
Pain is a common symptom of arthritis. Arthritis-attributable severe joint pain is reported by at least 1 in 5 adults with arthritis in every state. In states with the highest prevalence, it occurs in more than 1 in 3 adults with arthritis.

Click here to view the data table [XLS – 12KB] for this map.
Prevalence by County
The estimated model-predicted prevalence of doctor-diagnosed arthritis among United States counties ranged from 11.2% to 42.7% in the 3,142 counties in 50 states and DC.
Percentage of adults with doctor-diagnosed arthritis varies greatly within most states. In general, the southern United States has the highest percentages of doctor-diagnosed arthritis, particularly Alabama, Tennessee, Virginia, and West Virginia. In general, the lowest percentages of doctor-diagnoses arthritis were in Hawaii, Texas, California, and parts of the Midwest.
At the county level, counties in Appalachia and along the lower Mississippi River tended to have higher predicted prevalences of arthritis. The majority of counties in Alabama, Arkansas, Kentucky, Michigan, Missouri, Tennessee, and West Virginia were in the highest quartile (31.2%–42.7%).

Click here to view the data table [XLS – 112KB] for this map.
For arthritis prevalence estimates by selected city or census tract, view PLACES.