Flu Vaccination Coverage, United States, 2018–19 Influenza Season
FluVaxView webpage report posted online September 26, 2019
An annual influenza (flu) vaccination is recommended by the Advisory Committee on Immunization Practices (ACIP) for all people 6 months and older who do not have contraindications to vaccination; vaccination is the primary way to prevent sickness and death caused by flu.[1] The Centers for Disease Control and Prevention (CDC) analyzed data from two telephone surveys, the National Immunization Survey-Flu (NIS-Flu) and the Behavioral Risk Factor Surveillance System (BRFSS), to estimate flu vaccination coverage for the U.S. population during the 2018–19 flu season. Vaccination coverage with ≥1 dose of flu vaccine was 62.5% among children 6 months through 17 years, an increase of 4.7 percentage points from the 2017–18 flu season and 3.5 percentage points higher than coverage in the 2016–17 season. Flu vaccination coverage among adults ≥18 years was 45.3%, an increase of 8.2 percentage points from the 2017–18 flu season and 2.0 percentage points higher than the 2016–17 season. Vaccination coverage varied by state, ranging from 45.7%–81.9% among children and from 33.9%–56.3% among adults, and of the ten states with the lowest coverage for children eight were also among the ten states with the lowest coverage for adults. Interpretation of the estimates in this report should take into account limitations of the surveys, including reliance on self-report/parental-report of vaccination status, low response rates, and level of consistency with findings from other surveys and data sources. CDC is exploring the use of administrative data sources to track flu vaccination coverage.
To improve flu vaccination coverage, healthcare providers are encouraged to offer influenza vaccination during routine health care visits and hospitalizations, continuing to offer vaccination as long as influenza viruses are circulating. For people who cannot visit a doctor’s office during the flu season, there are alternative and convenient places available for flu vaccinations. Improvements in vaccination coverage could provide greater benefit; in a recently published study, CDC estimated that increasing coverage by five percentage points could have prevented another 4,000 to 11,000 hospitalizations, depending on the severity of the season.[2]
Methods
For this report CDC analyzed data from the NIS-Flu for children 6 months through 17 years and the BRFSS for adults ≥18 years to estimate national- and state-level flu vaccination coverage for the 2018–19 flu season. The analyses included data collected from interviews completed during September (BRFSS) or October (NIS-Flu) 2018 through June 2019 and report on vaccinations received between July 1, 2018 and the time of interview or by May 31, 2019 for those interviewed in June.
The NIS-Flu is a national random-digit-dialed cellular telephone survey of households. Respondents ≥18 years most knowledgeable about the child’s vaccinations (hereafter in this report referred to as “parent” for simplification) were asked if their child had received a flu vaccination since July 1, 2018, and, if so, in which month and year; this information was parent-reported and not verified by medical records. For the 18.7% of respondents who indicated their child had been vaccinated but had a missing month of vaccination, month was imputed from other survey respondents with non-missing month of vaccination matched for week of interview, age group, state of residence, and race/ethnicity. Children with a missing parental response for the vaccination status question (2.5%) were excluded from analyses. The range of the Council of American Survey and Research Organizations (CASRO) response rates for the NIS-Flu for the 2018–19 season was 23.1%–24.6%.
BRFSS is a state-based random-digit-dialed cellular and landline telephone survey which collects information on a variety of health conditions and risk behaviors from one randomly selected adult ≥18 years in a household. BRFSS included survey questions asking whether the respondent had received a flu vaccination in the past 12 months, and if so, in which month and year. Responses to the flu vaccination status questions were not verified by medical records. Respondents who did not have either a yes or no response to the flu vaccination status question were excluded from the analysis; this included 0.3% who reported they did not know, 0.1% who refused to answer the question, and 6.5% who most likely ended the interview before the flu question was asked. For 7.1% of BRFSS participants who indicated they had been vaccinated but had a missing month and year of vaccination, the month of vaccination was imputed from other survey respondents with non-missing month of vaccination matched for week of interview, age group, state of residence, and race/ethnicity. Information on high-risk conditions was missing for 1.3% of adults and were not included in the estimates by risk condition. The median state BRFSS response rate for a complete or partially complete interview was 50.2% for September–December 2018 and 49.6% for January–June 2019. There were no BRFSS interviews conducted during September–June for New Jersey and the District of Columbia therefore, estimates could not be produced for these states for the 2018–19 season. An analysis of BRFSS data for the 2015-16 through 2017-18 seasons found that removing New Jersey and the District of Columbia changed the national estimates only minimally (-0.1 to 0.2 percentage points).
Flu vaccination coverage estimates from both surveys were calculated using Kaplan-Meier survival analysis using month of reported flu vaccination to determine cumulative flu vaccination coverage. All estimates were weighted and analyzed using SAS and SAS-callable SUDAAN statistical software to account for the complex survey designs. Differences between groups and between 2018–19 and prior seasons (2016–17, 2017–18) estimates were determined using t-tests with significance at p<0.05. Increases or decreases noted in this report were statistically significant differences.
To assess consistency with estimates from other surveys, flu vaccination coverage estimates from NIS-Flu and BRFSS were compared to estimates from past seasons from the National Health Interview Survey (NHIS). The NHIS is conducted by in-person interviews of a sample of the civilian, non-institutionalized population of the United States throughout the year using an area probability design.[3]
Results
Children (6 months through 17 years)
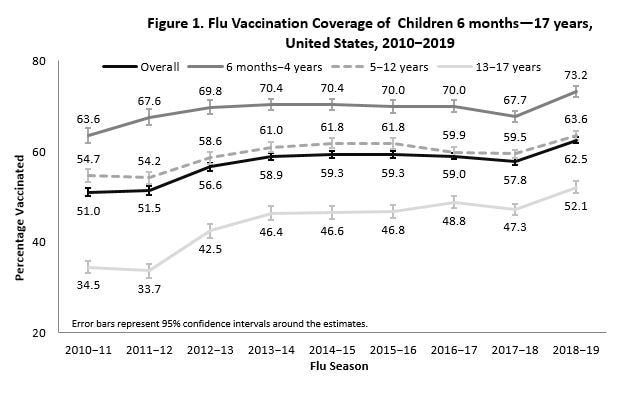
Among children 6 months through 17 years, the percentage receiving ≥1 dose of flu vaccine during the 2018–19 season was 62.5%, which was 4.7 percentage points higher than coverage in the 2017–18 season (57.8%) and 3.5 percentage points higher than coverage in the 2016–17 season (59.0%; Figure 1). Flu vaccination coverage increased 5.5 percentage points among children 6 months–4 years, 4.1 percentage points among children 5–12 years, and 4.8 percentage points among children 13–17 years compared with the 2017–18 season. As observed each flu season, flu vaccination coverage among children decreased with increasing age.
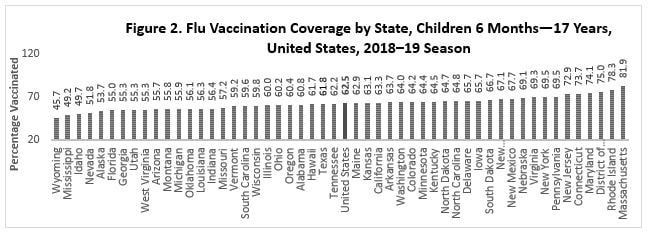
There was large between-state variability in flu vaccination coverage among children, ranging from 45.7% (Wyoming) to 81.9% (Massachusetts; Figure 2). See the interactive FluVaxView application for additional state-level estimates by age-groups and multiple flu seasons.
Among children, coverage during the 2018–19 season increased significantly compared with the 2017–18 season for all racial/ethnic groups except for Asian children (Table 2). Similar to the 2017–18 season, significant differences in flu vaccination coverage were observed between racial/ethnic groups. Asian children had higher flu vaccination coverage than children in all other racial/ethnic groups. Hispanic children had higher flu vaccination coverage than children in all other racial/ethnic groups except for Asian children and American Indian/Alaska Native children. There were no other statistically significant pair-wise differences.
| Race/Ethnicity‡ | Unweighted Sample Size | %§ ± 95% CI|| | Difference from the 2017–18 Season ± 95% CI |
|---|---|---|---|
| Overall | 139,358 | 62.5 ± 0.7 | 4.7 ± 1.0¶ |
| White only, non-Hispanic | 80,684 | 60.5 ± 0.8 | 4.9 ± 1.1¶ |
| Black only, non-Hispanic | 13,171 | 59.5 ± 2.2 | 4.2 ± 3.0¶ |
| Hispanic | 28,163 | 66.4 ± 1.7 | 4.6 ± 2.3¶ |
| Other, non-Hispanic Overall | 17,340 | 65.4 ± 1.8 | 3.3 ± 2.5¶ |
| Asian | 5,766 | 72.4 ± 2.9 | 2.7 ± 4.2 |
| American Indian/Alaska Native (AI/AN) | 1,794 | 61.7 ± 5.3 | 9.9 ± 7.9¶ |
| Other or multiple races ** | 9,780 | 60.8 ± 2.6 | 3.8 ± 3.5¶ |
* Estimates of the percentage of children vaccinated are based on interviews conducted October 2018 through June 2019 and reported vaccinations from July 2018 through May 2019.
† Excludes U.S. territories.
‡ Race is reported by parent/guardian; people of Hispanic ethnicity may be of any race.
§ Percentage vaccinated. Percentages are weighted to the U.S. population. Month of vaccination was imputed for respondents with missing month of vaccination data.
|| Confidence interval (CI) half-widths.
¶ Statistically significant difference between the 2018–19 season and the 2017–18 season by t-test (p<0.05).
** Includes Native Hawaiian or other Pacific Islander, multiracial, and other races.
Adults (≥18 years)
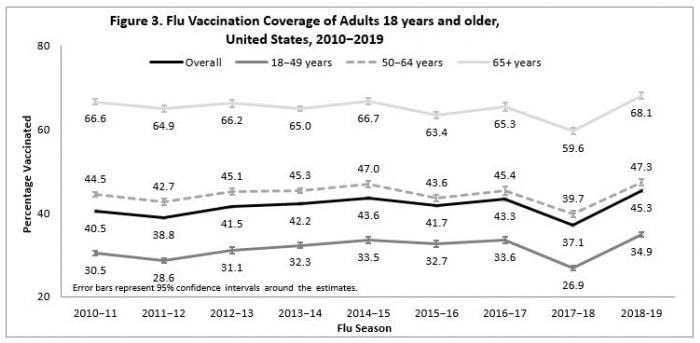
Overall among adults ≥18 years, coverage was 45.3%, 8.2 percentage points higher than coverage during the 2017–18 season (37.1%) and 2.0 percentage points higher than the 2016–17 season (43.3%; Figure 3). Coverage for 2018–19 was higher for every age group compared with the 2017–18 season. As observed each flu season, flu vaccination coverage among adults increased with increasing age.
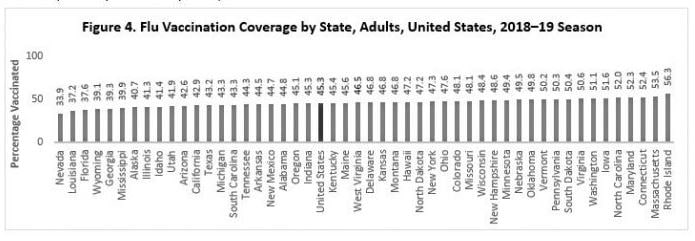
There was large between-state variability in flu vaccination coverage among adults, ranging from 33.9% in Nevada to 56.3% in Rhode Island (Figure 4). See the interactive FluVaxView application for additional state-level estimates by age-groups and multiple flu seasons. Of the ten states with the lowest influenza vaccination coverage for children in 2018–19, eight were also among the ten states with the lowest coverage for adults. Child and adult influenza vaccination coverage estimates by state were positively associated (r=0.77).
Among adults ≥18 years, coverage during the 2018–19 season increased for all racial/ethnic groups compared with the 2017–18 season, except for Asian and American Indian/Alaska Native adults (Table 2). Similar to the 2017–18 season, significant differences in flu vaccination coverage were observed between racial/ethnic groups. Non-Hispanic white adults had higher flu vaccination coverage than non-Hispanic black, Hispanic, Asian, and AI/AN adults and adults of other or multiple races. Additionally non-Hispanic black adults had higher flu vaccination coverage than Hispanic adults, while Asian adults had higher coverage than non-Hispanic black, Hispanic, and AI/AN adults and adults of other or multiple races. There were no other statistically significant pair-wise differences.
| Race/Ethnicity‡ | Unweighted Sample Size | %§ ± 95% CI|| | Difference from the 2017–18 Season ± 95% CI |
|---|---|---|---|
| Overall | 302,148 | 45.3 ± 0.4 | 8.2 ± 0.6¶ |
| White only, non-Hispanic | 232,228 | 48.7 ± 0.4 | 8.5 ± 0.6¶ |
| Black only, non-Hispanic | 21,809 | 39.4 ± 1.6 | 7.1 ± 2.0¶ |
| Hispanic | 22,404 | 37.1 ± 1.4 | 8.7 ± 1.8¶ |
| Other, non-Hispanic Overall | 20,794 | 41.2 ± 1.8 | 4.5 ± 2.5¶ |
| Asian | 6,224 | 44.0 ± 2.7 | 2.0 ± 3.8 |
| American Indian/Alaska Native (AI/AN) | 5,153 | 37.6 ± 3.5 | 4.5 ± 5.1 |
| Other or multiple races ** | 9,417 | 39.7 ± 2.7 | 7.3 ± 3.8¶ |
* Estimates of the percentage of adults vaccinated are based on interviews conducted September 2018 through June 2019 and reported vaccinations from July 2018 through May 2019. No BRFSS interviews were conducted in New Jersey or the District of Columbia from September 2018 through June 2019.
† Excludes U.S. territories.
‡ Race is self-reported; people of Hispanic ethnicity may be of any race.
§ Percentage vaccinated. Percentages are weighted to the U.S. population. Month of vaccination was imputed for respondents with missing month of vaccination data.
|| Confidence interval (CI) half-widths.
¶ Statistically significant difference between the 2018–19 season and the 2017–18 season by t-test (p<0.05).
** Includes Native Hawaiian or other Pacific Islander, multiracial, and other races.
Comparisons to the National Health Interview Survey (NHIS)
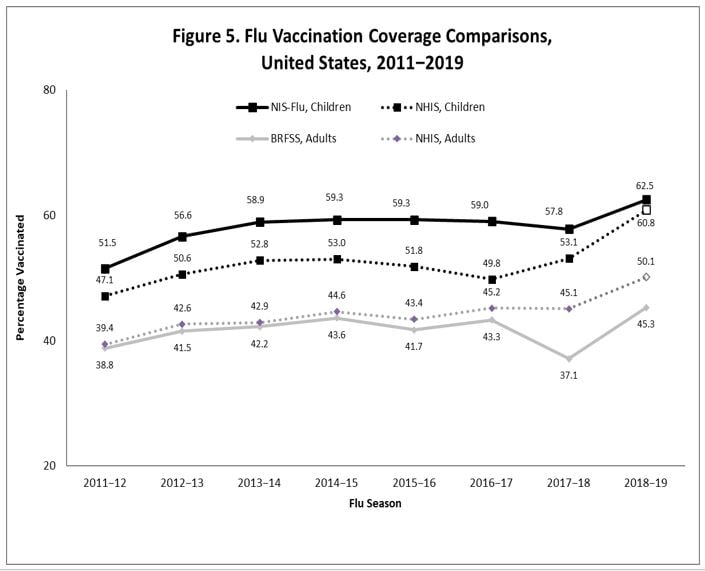
Estimated flu vaccination coverage by season among children was 2–9 percentage points higher based on NIS-Flu compared to NHIS (Figure 5). For adults, estimated flu vaccination coverage from BRFSS and NHIS were similar until the 2017–18 season, when the BRFSS estimate was eight percentage points below the NHIS estimate. The dip in adult flu vaccination coverage for the 2017–18 season from BRFSS was not observed in NHIS estimates. For both children and adults, estimates from NHIS suggest increases in coverage in 2018-19 compared to 2017-18, based on preliminary 2018-19 season coverage.
Discussion
Annual flu vaccination is an effective way to prevent flu illness and increases in flu vaccination coverage in children and adults will prevent additional influenza illnesses, medical visits, and hospitalizations.[2] The large variation in flu vaccination coverage by state and correlation between state coverage for children and adults are not well understood but indicate opportunity for improvement. Flu vaccination coverage among children during the 2018–19 season remains lower than coverage for other childhood vaccinations.[4, 5] A recent national study found that the most common reasons parents reported for not having their child vaccinated against influenza are concern about side-effects/safety, belief that the flu vaccine does not work well, and belief that their child is unlikely to get very sick from influenza.[6] As the 2019–20 season is beginning, it is important that providers prioritize flu vaccination for their patients.[1] This includes client reminders when flu vaccination supplies become available, assessing the vaccination status at every visit, making an effective recommendation for vaccination, and offering the vaccine or referring to a vaccine provider. For more information about flu, including flu vaccine recommendations, flu activity and surveillance, and resources for discussing flu vaccination with patients, visit the CDC flu webpage.
Survey data indicated an increase in flu coverage compared with the 2016–17 and 2017–18 seasons for both children and adults; the observed increases may reflect true increases in coverage or may be due to limitations of the telephone surveys described below. NIS-Flu estimates have been consistently higher than those from the NHIS by 4–9 percentage points for the 2011–12 through 2017–18 flu seasons. NHIS achieves higher response rates than NIS-Flu, and uses an area probability design with in-person interviews, while NIS-Flu samples from and conducts interviews by cellular telephone. Despite differences in survey methodology, similar to NIS-Flu, projected coverage for 2018–19 from NHIS indicates a possible increase compared to prior seasons for children. Both NIS-Flu and NHIS estimates may be too high because of reliance on parental-reported flu vaccination status; vaccination status is not confirmed by medical records.
Flu vaccination coverage among adults during the 2018–19 season remains lower than national objectives, at only 45.3% based on BRFSS. BRFSS data indicated a 6.2 percentage point decrease from the 2016–17 to the 2017–18 season, and then an 8.2 percentage point increase in coverage for 2018–19 compared with the 2017–18 season. However, preliminary estimates from several other data sources did not show a dip in coverage for the 2017–18 season. It is not clear why estimates for the 2017–18 season showed a different pattern compared to other data sources when historically the seasonal pattern between sources has been consistent. It is reassuring that the increase in BRFSS estimates for the 2018–19 season are consistent with other sources: projected coverage for 2018–19 from NHIS indicates a possible increase compared to prior seasons for adults and coverage estimates for flu vaccinations received through mid-November from the National Internet Flu Survey showed a 6.4 percentage point increase from the 2017–18 season (38.6%) to the 2018–19 season (44.9%).[7]
CDC will continue to assess consistency between flu vaccination coverage estimates from different surveys and other data sources, and evaluate accuracy of estimates from these data sources. CDC is also exploring other potential non-survey data sources to track flu vaccination coverage. Using IQVIA™ data, the projected number of flu vaccinations administered among adults in retail pharmacies (chain, independent, food stores, and mass merchandizers) and the projected number of flu vaccinations billed in outpatient medical offices among adults increased an average of 20% and 4% per season, respectively, from the 2016–17 through 2018–19 seasons (CDC, unpublished data) thus further lending support that flu vaccination coverage for adults increased in the 2018–19 season.
Additional Flu Vaccination Coverage Estimates
Additional flu vaccination coverage estimates for the 2018–19 and earlier flu seasons by state and Health and Human Services (HHS) region are provided on FluVaxView as interactive maps, figures, and tables. Flu vaccination coverage was estimated for additional age groups, and by sex, race/ethnicity, and select local areas including territories (see box below).
Children:
- Flu Vaccination Coverage, by Age Group, Children, United States, 2018–19 Season [XLS – 16 KB]
- Flu Vaccination Coverage by Sex, Children, United States, 2018–19 Season [XLS – 19 KB]
- Flu Vaccination Coverage by Race/Ethnicity and Age Group, Children, United States, 2018–19 Season [XLS – 21 KB]
- Flu Vaccination Coverage for Local Areas and Territories, Children, 2018–19 Season [XLS – 67 KB]
- Place of Flu Vaccination, Children, United States, 2018–19 Season [14 KB]
- Comparison of NHIS and NIS-Flu Flu Estimates, Children, United States, 2017–18 Season [XLS – 21 KB]
Adults:
- Flu Vaccination Coverage, by Age Group, Adults, United States, 2018–19 Season [11 KB]
- Flu Vaccination Coverage by Sex, Adults, United States, 2018–19 Season [13 KB]
- Flu Vaccination Coverage by Race/Ethnicity and Age Group, Adults, United States, 2018–19 Season [15 KB]
- Flu Vaccination Coverage for Local Areas and Territories, Adults, 2018–19 Season [49 KB]
- Comparison of NHIS and BRFSS Flu Estimates, Adults, United States, 2017–18 Season [16 KB]
Limitations
The NIS-Flu and BRFSS estimates in this report are subject to at least five limitations. First, weighting adjustments may not eliminate possible bias from using an incomplete sample frame; both surveys exclude households with no telephones, and NIS-Flu also excludes households with only landline telephones. Second, response rates for both surveys were low, flu vaccination coverage may differ between survey respondents and non-respondents, and survey weighting adjustments may not adequately control for these differences. Third, there may be errors in flu vaccination status due to recall error of parents for NIS-Flu, and self-report for BRFSS.[8-10] Fourth, errors from incomplete sample frame, nonresponse, and accuracy of reported flu vaccination status might change over time, which could lead to inaccurate assessment of trends in flu vaccination coverage. Finally, comparisons of estimates from different surveys should be interpreted with caution given possible differences in the precision of estimates and survey methods (including different sampling frames, survey mode, survey questions, order of survey questions, interview period, operations, response rates, and weighting).
Further evaluation of BRFSS data was conducted to identify possible explanations for the dip in coverage between the 2016–17 and 2018–19 seasons, similar to the evaluation conducted for the 2017-18 season.[11] No evidence was found for systematic differences in BRFSS survey operations, methods, or data collection process that could account for the increase in coverage from 2017-18 to 2018-19. Respondents with missing data on flu vaccination status were excluded from the analysis, which could also affect representativeness of the sample. Prevalence of missing a response to the question about receipt of flu vaccine in the past 12 months was 6.9% for respondents interviewed during September 2018 through June 2019 (4.1%–4.8% during September-December 2018 and 6.4%–10.4% during January–June 2019). Using available factors associated with vaccination coverage, estimated vaccination coverage based on multiple imputation of vaccination status was 43.9%, slightly lower than the observed estimate of 45.3% that excluded respondents with missing data on flu vaccination receipt in the past 12 months. The increase in coverage in 2018–19 compared with 2017–18 was 7.0 percentage points using multiply imputed estimates for both seasons, similar to the 8.2 percentage point increase based on estimates excluding respondents with missing data.
References
- Grohskopf, L.A., et al., Prevention and Control of Seasonal Influenza with Vaccines: Recommendations of the Advisory Committee on Immunization Practices – United States, 2019-20 Influenza Season. MMWR Recomm Rep, 2019. 68(3): p. 1-21.
- Hughes, M.M., et al., Projected Population Benefit of Increased Effectiveness and Coverage of Influenza Vaccination on Influenza Burden – United States. Clin Infect Dis, 2019.
- CDC. About the National Health Interview Survey. 2019 [cited 2019 9/10/2019]; Available from: https://www.cdc.gov/nchs/nhis/about_nhis.htm.
- Hill, H.A., et al., Vaccination Coverage Among Children Aged 19-35 Months – United States, 2017. MMWR Morb Mortal Wkly Rep, 2018. 67(40): p. 1123-1128.
- Walker, T.Y., et al., National, Regional, State, and Selected Local Area Vaccination Coverage Among Adolescents Aged 13-17 Years – United States, 2018. MMWR Morb Mortal Wkly Rep, 2019. 68(33): p. 718-723.
- Kahn, K.E., T.A. Santibanez, and Y. Zhai, Parental reasons for non-receipt of influenza vaccination among children 6 months-17 years, United States, 2015-16 and 2016-17 influenza seasons, in National Adult and Influenza Immunization Summit. 2019: Atlanta, GA.
- CDC. Early-season flu vaccination coverage–States, November 2018. 2018 9/10/2019]; Available from: https://www.cdc.gov/flu/fluvaxview/nifs-estimates-nov2018.htm.
- Brown, C., et al., Validity of parental report of influenza vaccination in young children seeking medical care. Vaccine, 2011. 29(51): p. 9488-92.
- Irving, S.A., et al., Evaluation of self-reported and registry-based influenza vaccination status in a Wisconsin cohort. Vaccine, 2009. 27(47): p. 6546-9.
- Rolfes, M.A., et al., Effects of Influenza Vaccination in the United States during the 2017-2018 Influenza Season. Clin Infect Dis, 2019.
- CDC. Estimates of influenza vaccintion coverage among adults–United States, 2017-18 flu season. 2018; Available from: https://www.cdc.gov/flu/fluvaxview/coverage-1718estimates.htm.