What to know
The burden of influenza (flu) on the United States can vary widely from season to season and is affected by many factors including the characteristics of circulating viruses, the timing of the season, population immunity to circulating viruses, how well flu vaccines are working, and how many people have gotten vaccinated. While the impact of flu varies from season to season, it places a substantial burden on the health of people in the United States each year.
Overview
CDC uses a mathematical model to estimate the annual number of flu illnesses, medical visits, hospitalizations, and deaths in the United States123. The methods used to calculate the burden of flu have been described previously12. More recently, the same model was adopted to estimate flu-associated deaths in the United States. This methodology has been used to retroactively calculate flu burden, including deaths, going back to 2010.
This page includes information on current and past methods for estimating the number of flu illnesses, medical visits, flu-associated hospitalizations, and flu-associated deaths that occur in the United States during a given season.
How CDC estimates Flu-Associated Hospitalizations in the United States
Laboratory-confirmed flu-associated hospitalization rates are obtained from the Influenza Hospitalization Surveillance Network (FluSurv-NET), a collaboration between CDC, the Emerging Infections Program Network, and selected state and local health departments in 14 geographically distributed areas in the United States that conduct population-based surveillance. The network includes hospitals that serve roughly 9% of the U.S. population. The reported numbers of hospitalizations are used to calculate hospitalization rates and the rates are adjusted to correct for under-detection of influenza. This adjustment is done by using the percent of persons hospitalized with respiratory illness who were tested for influenza and the average sensitivity of influenza tests used in the participating FluSurv-NET hospitals. The data on influenza testing can lag up to two years after the end of the season, so for more recent seasons, testing data from prior seasons is used1.
Adjusted rates are applied to the U.S. population by age group to estimate the total number of flu-associated hospitalizations.
How CDC estimates Flu Illness in the United States
The numbers of flu illnesses were estimated from hospitalizations based on how many illnesses there are for every hospitalization, which was measured previously4.
Some people with flu will seek medical care, while others will not. CDC estimates the number of people who sought medical care for flu using data from the 2010 Behavioral Risk Factor Surveillance Survey, which asked people whether they did or did not seek medical care for a flu-like illness in the prior flu season.
How CDC estimates Flu-Associated Deaths in the United States
The methods to estimate the annual number of flu-associated deaths have been described in detail elsewhere12. The model uses a ratio of deaths-to-hospitalizations to estimate the total flu-associated deaths from the estimated number of flu-associated hospitalizations.
We first look at how many in-hospital deaths were observed in FluSurv-NET. The in-hospital deaths are adjusted for under-detection of influenza using methods similar to those described above for hospitalizations using data on the frequency and sensitivity of influenza testing. Second, because not all deaths related to flu occur in the hospital, we use death certificate data to estimate how likely deaths are to occur outside the hospital. We look at death certificates that have pneumonia or influenza causes (P&I), other respiratory and circulatory causes (R&C), or other non-respiratory, non-circulatory causes of death, because deaths related to flu may not have flu listed as a cause of death. We use information on the causes of death from FluSurv-NET to determine the mixture of P&I, R&C, and other coded deaths to include in our investigation of death certificate data. Finally, once we estimate the proportion of flu-associated deaths that occurred outside of the hospital, we can estimate the deaths-to-hospitalization ratio.
Data needed to estimate flu-associated deaths may lag for up to two years after the season ends. When this is not yet available for the season being estimated, we adjust based on values observed in prior seasons (e.g., the 2010-2011 season through the 2019-2020 season) and update the estimates when more current data become available.
Underreporting of flu on death certificates
Seasonal flu may lead to death from other causes, such as pneumonia, congestive heart failure, or chronic obstructive pulmonary disease. It has been recognized for many years that flu is underreported on death certificates. There may be several reasons for underreporting, including that patients aren't always tested for seasonal influenza virus infection, particularly older adults who are at greatest risk of seasonal flu complications and death. Even if a patient is tested for influenza, influenza virus infection may not be identified because the influenza virus is only detectable for a limited number of days after infection and many people don't seek medical care in this interval. Additionally, some deaths – particularly among those 65 years and older – are associated with secondary complications of flu (including bacterial pneumonias). For these and other reasons, modeling strategies are commonly used to estimate flu-associated deaths. Only counting deaths where flu was recorded on a death certificate would be a gross underestimation of flu's true impact.
Datasets
Limitations of Flu Burden Estimates
These estimates are subject to several limitations.
- First, rates of flu-associated hospitalizations are based on data reported to the Influenza Hospitalization Surveillance Network (FluSurv–NET) that are current as of the time estimates are made. Final case counts may differ slightly as further data cleaning is conducted by FluSurv–NET sites. The most updated crude rates of hospitalization for FluSurv-NET sites are available on FluView Interactive5.
- Second, national rates of flu-associated hospitalizations and in-hospital death are adjusted for the frequency of influenza testing and the sensitivity of influenza diagnostic assays, using a multiplier approach3. However, data on testing practices during the current season may not be available at the time of estimation. In such cases, we adjust rates using data from prior seasons. Burden estimates from a given season will be updated at a later date when data on contemporary testing practices become available.
- Third, estimates of flu-associated illness are made by multiplying the number of hospitalizations by the ratio of illnesses to hospitalizations; estimates of medical visits are made by a similar process. These multipliers are based on data from prior seasons, which may not be accurate if patterns of care-seeking have changed.
- Fourth, our estimate of flu-associated deaths relies on information about location of death from death certificates. However, death certificate data for a given season may not be available at the time of estimation. When this occurs, we use death certification data from prior flu seasons where these data are available from the National Center for Health Statistics. Specifically, our model uses the frequency of influenza-associated deaths that have cause of death related to pneumonia or influenza (P&I), other respiratory or cardiovascular (other R&C), or other non-respiratory, non-cardiovascular (non-R&C) to account for deaths occurring outside of a hospital by cause of death. If these frequencies are not available from a given season at the time of estimation, we use the average frequencies of each cause from previous seasons.
More information about how these estimates compare to other burden estimates and past studies can be found on CDC's Frequently Asked Questions about Estimated Flu Burden.
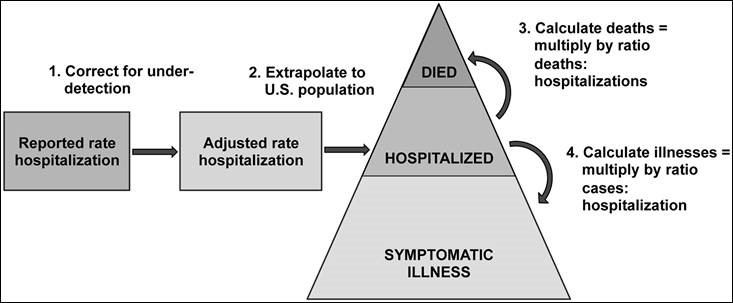
508 Text Description of Image
Starting on the left, there are two sequential boxes with arrows that lead to a pyramid. The left-most box is labelled "Reported rate of hospitalization". There is an arrow leading right to the next box, which is labelled "Adjusted rate of hospitalization", and over the arrow is a label "1. Correct for under-detection".
From the box, labelled "Adjusted rate of hospitalization", is an arrow leading right to the middle of the pyramid, which is labelled "Hospitalized" and over the arrow is a label "2. Extrapolate to U.S. population". In the pyramid, the base is labelled "Symptomatic Illness", the middle section is labelled "Hospitalized", and the top is labelled "Died". On the right-side of the pyramid are arrows coming from the middle section, with one leading up to the top section, labelled "Died", and another arrow leading down to the bottom section, labelled "Symptomatic Illness".
Next to the arrow leading up to "Died" is a label stating "3. Calculate deaths equals multiply by ratio deaths to hospitalizations". On the arrow leading from the middle of the pyramid down to the base, which is labelled "Symptomatic Illnesses", there is a label stating "4. Calculate illnesses equals multiply by ratio of cases to hospitalizations".
- Reed C, Chaves SS, Daily Kirley P, Emerson R, Aragon D, Hancock EB, et al. Estimating influenza disease burden from population-based surveillance data in the United States. PLoS One. 2015;10(3):e0118369.
- Rolfes, MA, Foppa, IM, Garg, S, et al. Annual estimates of the burden of seasonal influenza in the United States: A tool for strengthening influenza surveillance and preparedness. Influenza Other Respi Viruses. 2018; 12: 132– 137. https://onlinelibrary.wiley.com/doi/10.1111/irv.12486
- Centers for Disease Control and Prevention. Estimated influenza illnesses and hospitalizations averted by influenza vaccination – United States, 2012-13 influenza season. MMWR Morb Mortal Wkly Rep. 2013 Dec 13;62(49):997-1000.
- Reed C, Angulo FJ, Swerdlow DL, Lipsitch M, Meltzer MI, Jernigan DB, et al. Estimates of the Prevalence of Pandemic (H1N1) 2009, United States, April–July 2009. Emerg Infect Dis. 2009;15(12):2004-2007. https://dx.doi.org/10.3201/eid1512.091413
- Shrestha SS, Swerdlow DL, Borse RH, Prabhu VS, Finelli L, Atkins CY, et al. Estimating the Burden of 2009 Pandemic Influenza A (H1N1) in the United States (April 2009–April 2010). Clin Infect Dis. 2011;52(suppl_1):S75-S82.