FoodCORE Year Seven Summary
January 1, 2017 to December 31, 2017
Background
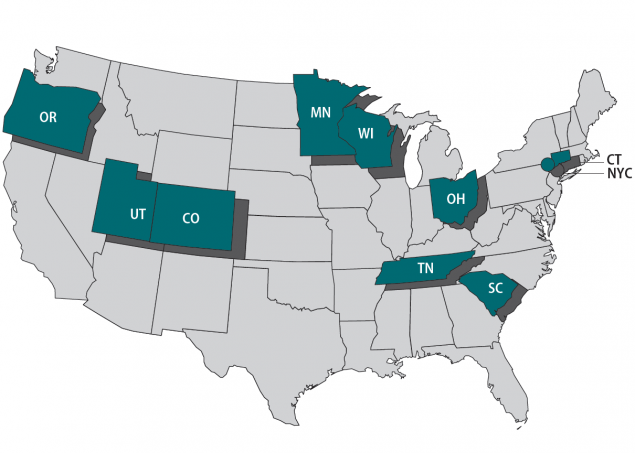
Foodborne Diseases Centers for Outbreak Response Enhancement (FoodCORE) centers address gaps in foodborne disease response through enhanced capacity in laboratory, epidemiology, and environmental health to improve timeliness and completeness of outbreak response activities. The FoodCORE centers during Year Seven (January 1 – December 31, 2017) were Colorado, Connecticut, Minnesota, New York City, Ohio, Oregon, South Carolina, Tennessee, Utah, and Wisconsin.
Program Highlights
In Year Seven, FoodCORE program participants delivered presentations at meetings and conferences across the country to showcase their outbreaks, projects, and successes. The CDC FoodCORE Team presented program overviews at scientific conferences, programmatic meetings, and invited talks including collaborations with OutbreakNet Enhanced sites to show the wider scope of CDC’s capacity-building strategy. Presentations included:
- Breakout and roundtable sessions at the Council of State and Territorial Epidemiologists (CSTE) Annual Conference
- An open session at the Integrated Foodborne Outbreak Response and Management (InFORM) Conference
- Updates at the Southeast, Mountain/West, Central/Midwest, and Northeast/Mid-Atlantic PulseNet, OutbreakNet, and Environmental Health Regional Meetings
A FoodCORE Success Story on culture-independent diagnostic testing (CIDTs) was added to the FoodCORE website in Year Seven. This story covers the basics of CIDTs and the challenges they pose to public health surveillance systems but also illustrates how the FoodCORE centers have adapted to and benefited from the new technology. CIDTs have been used to find additional outbreaks and identify pathogens faster which results in faster public health action and the prevention of additional cases. The FoodCORE centers will continue to share lessons learned with other state and local health departments as they work with the real-world implications of CIDTs.
In Year Seven, the fourth FoodCORE Model Practice was published to the FoodCORE website. This model practice describes successful strategies used in FoodCORE centers to establish and maintain connections among laboratorians, epidemiologists, and environmental health specialists. Having strong partnerships is critical for establishing clear lines of communication. Delays or interruptions in communication and data sharing between team members can impede investigations; a prepared and coordinated team can work together to quickly solve and stop outbreaks, preventing additional illnesses.
The Communication and Collaboration Model Practice is a great resource for health departments that wish to establish or strengthen trusting, respectful relationships with multidisciplinary team members.
Additionally, this model practice contains a checklist and a list of trainings and resources to help health departments implement the practices described in the document.
Program Performance
Centers report metrics twice a year to document changes resulting from targeted FoodCORE resources. Metrics for Salmonella, Shiga toxin-producing Escherichia coli (STEC), and Listeria (SSL) have been collected since late 2010. Metrics for norovirus, other etiologies, and unknown etiology (NOU) investigations have been collected since 2012. The metrics collected by FoodCORE centers are revised as needed to best meet program goals. See below for figures and graphs for selected metrics. Information on all of the metrics and complete data tables are available on the FoodCORE website.
Graphs for Selected Metrics – Year Seven
Centers increased the proportion of primary SSL isolates with whole genome sequencing (WGS) information between Year 6 and Year 7 while increasing the proportion of primary SSL isolates with pulsed-field gel electrophoresis (PFGE) information.
To evaluate the timeliness and completeness of WGS, centers pilot tested a set of expanded SSL metrics in Year 6. The expanded metrics went into effect in Year 7. Download and view chart data Cdc-excel[XLS – 29.8 KB].
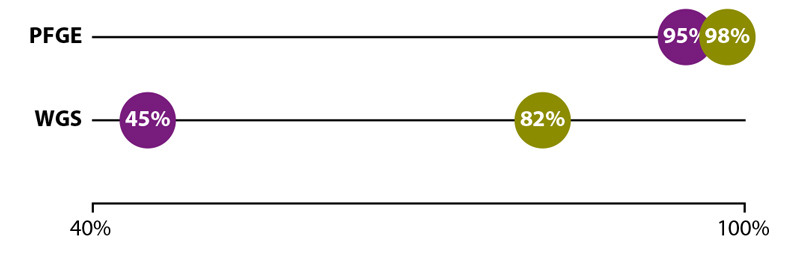
Purple = Year 6. Green = Year 7.

Over 13,000 SSL isolates
submitted to or recovered
at the public health lab

More than 12,000
cases reported to
epidemiology staff

Approximately 760
SSL and 1,400 NOU*
investigations conducted
Centers increased the proportion of confirmed Salmonella, STEC, and Listeria cases with exposure history obtained from Baseline to Year 7.
In Year 7, it took centers 1.3 days to attempt an interview and 2.8 days to complete an interview for confirmed SSL cases. Download and view chart data Cdc-excel[XLS – 29.8 KB].
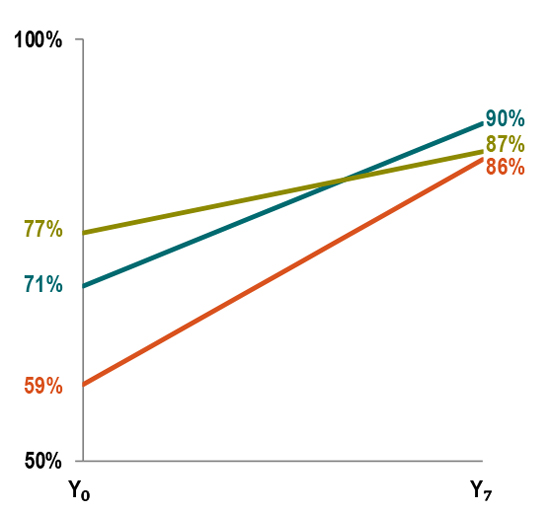
Orange = Salmonella. Teal = STEC. Green = Listeria.
In Year 7, centers conducted 66 SSL and 140 NOU* environmental health assessments as part of investigations where there was a link to a common location of exposures.

Environmental health assessments provide information needed to recommend effective short and long-term interventions that stop ongoing foodborne outbreaks and prevent them in the future.
| FoodCORE Reporting Periods | |||
| Baseline (Y0) =
Oct 2010 – Mar 2011 |
Year 1 (Y1) =
Oct 2010 – Sept 2011 |
Year 2 (Y2) =
Oct 2011 – Dec 2012 |
Year 3 (Y3) =
Jan 2013 – Dec 2013 |
| Year 4 (Y4) =
Jan 2014 – Dec 2014 |
Year 5 (Y5) =
Jan 2015 – Dec 2015 |
Year 6 (Y6) =
Jan 2016 – Dec 2016 |
Year 7 (Y7) =
Jan 2017 – Dec 2017 |
FoodCORE centers have demonstrated that targeted investments can improve the completeness and timeliness of outbreak response activities. They have strengthened their outbreak response programs for faster, better, and more complete investigations, to ultimately help stop the spread of enteric diseases. Download a print version of the FoodCORE Year Seven Summary Cdc-pdf[PDF 2 pages].
*Only foodborne and point-source investigations are reported for NOU metrics.
Download a print version of the FoodCORE Year Seven Summary Cdc-pdf[PDF - 2 pages].