FoodCORE Center: Tennessee

Program Overview
The Tennessee Department of Health established the Tennessee-FoodCORE program to improve response to foodborne outbreaks. Tennessee-FoodCORE collaborates with several food safety programs and ensures food safety is a coordinated initiative. Tennessee has a centralized public health infrastructure with 7 regional and 6 metropolitan health offices, representing 95 counties.

“The FoodCORE Program has been a tremendous resource for me as a Field Epidemiologist. The quality of the data and the promptness with which the information is collected is invaluable. The Tennessee FoodCORE Interview Team has identified outbreaks in my health region we were able to quickly respond to.”
Kevin Morris, MPH, MPA, Regional Epidemiologist for the West Tennessee Region
Year joined FoodCORE: 2011
Population: 6.6 M1
Structure: Centralized
Number of local and tribal health departments: 95
Epidemiology:
- Increased capacity for centralized interviewing
- Created a student interview team: FoodCORE Interview Team (FIT)
Laboratory:
- Provided stool kits to local health offices, ensuring timely specimen collection
- Partnered with the state laboratory to provide stool collection training
Environmental Health
- Provided National Voluntary Environmental Assessment Reporting System training to all field staff
- Evaluated Tennessee’s Foodborne Outbreak Complaint Surveillance System
12015 Population Estimate https://www.census.gov/quickfacts/External
In Tennessee, foodborne illnesses are the leading cause of outbreaks. The Tennessee Department of Health conducts foodborne disease surveillance and outbreak investigations in partnership with 13 regional and local health departments. Tennessee-FoodCORE has improved surveillance and outbreak investigation activities through centralized interviewing. Using a detailed questionnaire, the Tennessee FoodCORE Interview Team (FIT) interviews all sick people with Salmonella and Shiga toxin-producing E. coli infections who are reported to 11 of 13 regional and local health departments. Since 2011, the FIT has interviewed over 3,000 Salmonella and Shiga toxin-producing E. coli cases.
The FIT meets daily to review individual cases and clusters. In 2015, FoodCORE assisted in 8 cluster and outbreak investigations. The FIT and FoodCORE epidemiologist work closely with local health offices to keep them informed of potential outbreaks in their region.
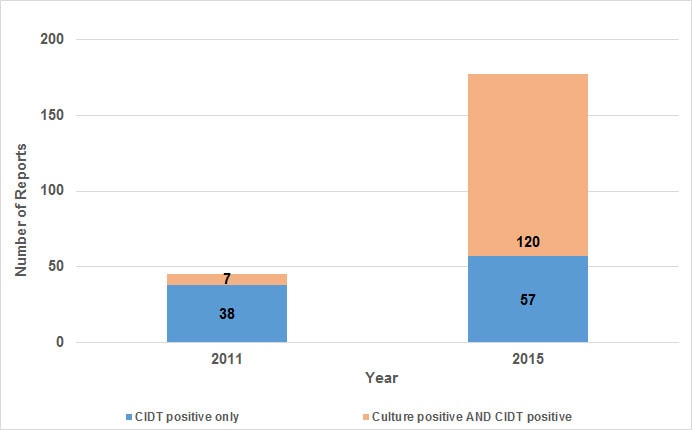
In the last 5 years, FoodCORE capacity has allowed TN to interview all culture-independent diagnostic test (CIDT) positive results received without waiting for culture confirmation. The FIT allows TN to take advantage of the rapid test results afforded by CIDT, while the TN State Public Health Laboratory has continued to work with clinical laboratories to ensure CIDT positive specimens are submitted to the public health lab for culture testing and cluster identification. In addition, the centralized nature of the program allows the subject matter experts at TN Central Office to interpret any unusual or new CIDT tests, so local and regional staff do not have to. In 2011, Tennessee only had 38 CIDT positive Salmonella reported, by 2015 this increased to 177 reports. Many states do not have the capacity to interview these cases and wait until they are culture confirmed. Because of the centralized FIT, TN was able to interview 177 cases with CIDT positive testing just as rapidly as culture confirmed cases. This is important because of 2015 Salmonella CIDT cases, 68% (n=120) were ultimately culture positive and nearly 100% of isolates were further characterized to identify clusters or outbreaks.