FoodCORE Center: Minnesota

Program Overview
The Minnesota FoodCORE program was established by the Minnesota Department of Health (MDH) in 2014 to improve response to foodborne outbreaks in Minnesota by enhancing epidemiologic, laboratory, and environmental health capacity.

“FoodCORE has further increased our capacity to investigate foodborne disease outbreaks by improving our ability to rapidly combine laboratory, environmental health, and epidemiologic data.”
Josh Rounds, Epidemiologist
Year joined FoodCORE: 2014
Population: 5.4 M1
Structure: Centralized
Number of local and tribal health departments: 85
Epidemiology:
- Hired additional University of Minnesota School of Public Health students for Team Diarrhea
- Increased capacity to investigate outbreaks and clusters
Laboratory:
- Increased capacity for DNA fingerprinting (PFGE and whole genome sequencing)
- Maintained a courier service to deliver specimens to state laboratory
Environmental Health
- Conducted trainings for state and local environmental health staff on outbreak investigation methods
- Conduct environmental health assessments for all foodborne outbreaks
12015 Population Estimate https://www.census.gov/quickfacts/External
In 2015, the Minnesota FoodCORE program hired students to assist with surveillance interviews and outbreak investigations. MDH investigated 60 foodborne outbreaks that resulted in over 700 illnesses. Thirty (50%) outbreaks were caused by norovirus or suspected norovirus, eleven (18%) by Salmonella, and six (10%) by Shiga toxin producing E. coli. An environmental health assessment was performed in all 53 (88%) foodborne outbreaks that occurred at a licensed facility, and laboratory specimens were collected in 58 (97%) foodborne outbreaks.
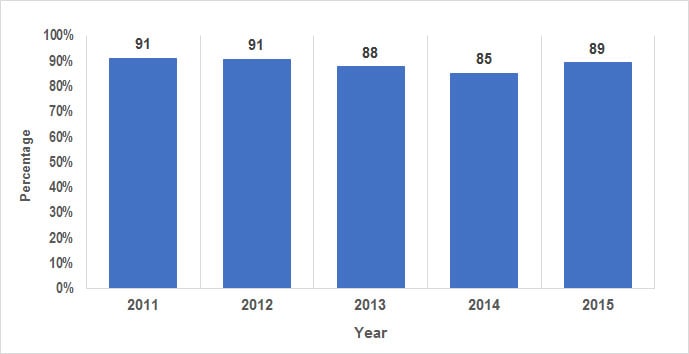
* Total number of Salmonella infections by year: 2011 (n=701), 2012 (n=780), 2013 (n=811), 2014 (n=722), 2015 (n=973)
** Minnesota became a FoodCORE site in September 2014