CDC Seasonal Flu Vaccine Effectiveness Studies
CDC conducts studies each flu season to help determine how well flu vaccines are working. These vaccine effectiveness (VE) studies help regularly assess the value of flu vaccination as a public health intervention. The results of vaccine effectiveness studies can vary based on the study design, the outcome(s) measured, the population studied, and the season studied.
U.S. Flu Vaccine Effectiveness Networks
CDC has been working with researchers at universities and hospitals since the 2003-2004 flu season to estimate how well flu vaccines work through observational studies using laboratory-confirmed flu as the outcome. Over the past few years, CDC has conducted VE studies using multiple vaccine effectiveness networks. More information on CDC’s vaccine effectiveness networks and studies is available at CDC’s Influenza Vaccine Effectiveness Networks.
Results from Prior Flu Seasons
The overall, adjusted vaccine effectiveness estimates for flu seasons from 2004-2024 are noted in the chart below. (Estimates are typically adjusted for study site, age, sex, underlying medical conditions, and days from illness onset to enrollment.)
The vaccine effectiveness estimates included in the chart and tables below are vaccine effectiveness estimates from the U.S. Flu VE Network.
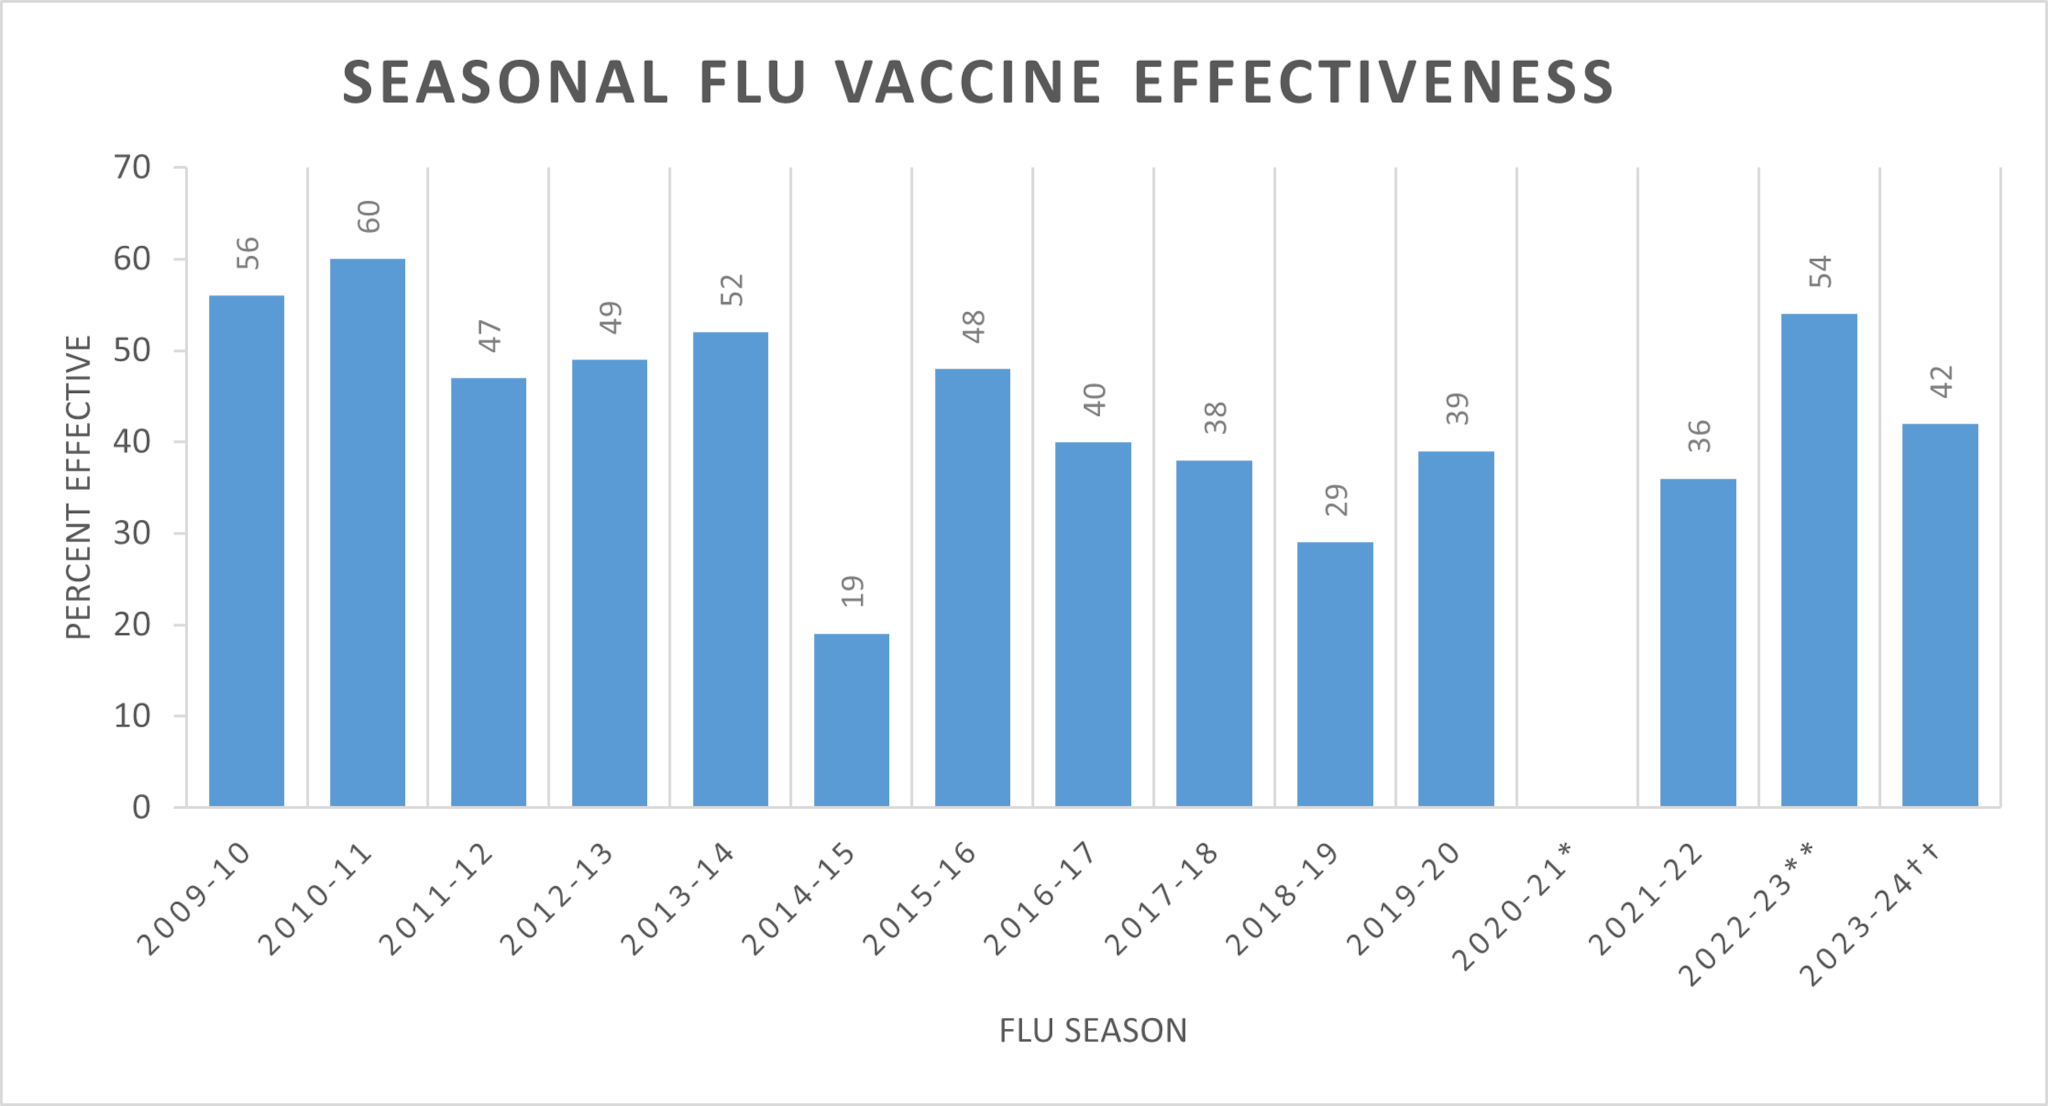
| 2009-10 | 2010-11 | 2011-12 | 2012-13 | 2013-14 | 2014-15 | 2015-16 | 2016-17 | 2017-18 | 2018-19 | 2019-20 | 2020-21* | 2021-22 | 2022-23** | 2023-24†† | |
|---|---|---|---|---|---|---|---|---|---|---|---|---|---|---|---|
| Adj. Overall VE (%) | 56 | 60 | 47 | 49 | 52 | 19 | 48 | 40 | 38 | 29 | 39 | Not enough data
to compute |
36 | 54 | 42 |
*2020-2021 flu vaccine effectiveness was not estimated due to low influenza virus circulation during the 2020-2021 flu season.
**In a Wisconsin study among patients aged 6 months to 64 years, VE was 54% against medically attended outpatient acute respiratory illness (ARI) associated with laboratory-confirmed influenza A virus infection.
A point estimate is a single value that is used to estimate an unknown population parameter. Point estimates are used in statistics to make inferences about population parameters based on sample data. More information is available at How Flu Vaccine Effectiveness and Efficacy are Measured.
|
Influenza Season† |
Reference |
Study Site(s) |
No. of Patients‡ |
Adjusted Overall VE (%) |
95% CI |
|---|---|---|---|---|---|
|
2004-05* |
WI |
762 |
10 |
-36, 40 |
|
|
2005-06* |
WI |
346 |
21 |
-52, 59 |
|
|
2006-07* |
WI |
871 |
52 |
22, 70 |
|
|
2007-08* |
WI |
1,914 |
37 |
22, 49 |
|
|
2008-09*† |
Unpublished |
WI, MI, NY, TN |
6,713 |
41 |
30, 50 |
|
2009-10* |
WI, MI, NY, TN |
6,757 |
56 |
23, 75 |
|
|
2010-11* |
WI, MI, NY, TN |
4,757 |
60 |
53, 66 |
|
|
WI, MI, PA, TX, WA |
4,771 |
47 |
36, 56 |
||
|
WI, MI, PA, TX, WA |
6,452 |
49 |
43, 55 |
||
|
WI, MI, PA, TX, WA |
5,999 |
52 |
44, 59 |
||
|
WI, MI, PA, TX, WA |
9,311 |
19 |
10, 27 |
||
|
WI, MI, PA, TX, WA |
6,879 |
48 |
41, 55 |
||
| Flannery 2018 | WI, MI, PA, TX, WA | 7,410 |
40 |
32, 46 | |
| Rolfes 2019 | WI, MI, PA, TX, WA | 8,436 |
38 |
31, 43 | |
| Flannery 2019 | WI, MI, PA, TX, WA | 10,041 |
29 |
21, 35 | |
| Tenforde 2021 | WI, MI, PA, TX, WA | 8,845 |
39 |
32, 44 | |
| n/a | n/a | n/a |
n/a |
||
| Price 2022 | CA, MI, PA, TN, TX, WA, WI | 4,312 |
36 |
21, 48 | |
| McLean 2023 | WI | 545 | 54 | 23, 73 | |
| ACIP Presentation on February 28, 2024 [1.5 MB, 37 pages] | AZ, MI, MO, PA, OH, TX, WA | 3,394 | 42 | 29, 53 |
*From 2004-2005 through 2010-2011, the Flu VE Network also enrolled inpatients.
**2020-2021 flu vaccine effectiveness was not estimated due to low influenza virus circulation during the 2020-2021 flu season.
***In a Wisconsin study among patients aged 6 months to 64 years, VE was 54% against medically attended outpatient acute respiratory illness (ARI) associated with laboratory-confirmed influenza A virus infection.
†Vaccine effectiveness (VE) estimates for the 2008-2009 flu season have not been published.
‡Number of patients used in VE calculation.
††VE estimates for 2022-2023 flu season are preliminary.
****Overall VE was calculated for this table to be consistent with what has been reported historically and is available for comparison with historical estimates. All other 2023-2024 VE estimates are reported by age group.
