At a glance
- Physical activity data are important tools for public health practitioners and professionals.
- This page includes maps, statistics, surveillance systems, and data about physical activity.

Links


Resources
PLACES: Local Data for Better Health
Model-based population analysis and community estimates for all U.S. counties, places (incorporated and census-designated places), census tracts, and ZIP Code Tabulation Areas (ZCTAs).
Healthy People 2030
National leading health indicators and core objectives related to physical activity.
Diagnosed Diabetes
National, state, and county data. Some data are available by age, sex, race-ethnicity, and education.
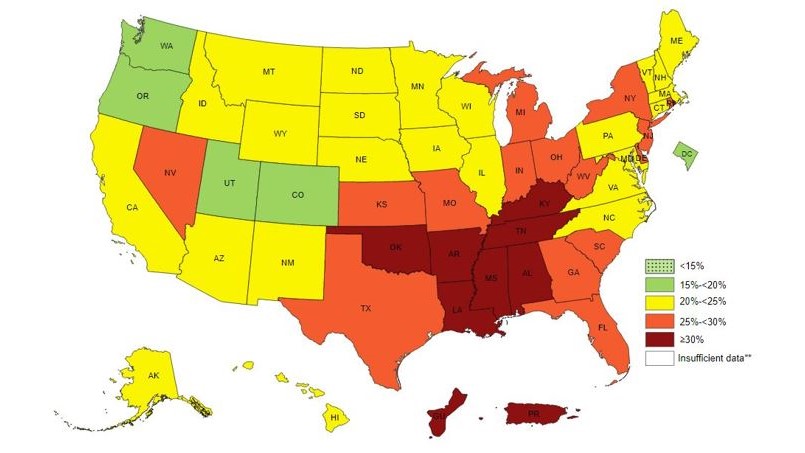
Diabetes and Obesity Maps
Age-adjusted prevalence of obesity and diagnosed diabetes among adults, by U.S. county.
Obesity Data and Statistics
Adult and childhood obesity in the United States.
Nutrition Data and Statistics
U.S. data on added sugars, water, and fruit and vegetable consumption.
Breastfeeding Data and Statistics
National and state information on breastfeeding rates and support.