Persons using assistive technology might not be able to fully access information in this file. For assistance, please send e-mail to: mmwrq@cdc.gov. Type 508 Accommodation and the title of the report in the subject line of e-mail.
Summary of Notifiable Diseases --- United States, 2009
Prepared by
Patsy A. Hall-Baker, Coordinator, Summary of Notifiable Diseases1
Samuel L. Groseclose, DVM, MPH, Acting Division Director1
Ruth Ann Jajosky, DMD1
Deborah A. Adams1
Pearl Sharp1
Willie J. Anderson1
John P. Abellera, MPH1
Aaron E. Aranas, MPH, MBA1
Michelle Mayes1
Michael S. Wodajo1
Diana H. Onweh1
Meeyoung Park2
Jennifer Ward 1
1Division of Notifiable Diseases and Healthcare Information (proposed), the Office of Surveillance, Epidemiology, and and Laboratory Services, CDC
2McKing Consulting Corporation
Preface
The Summary of Notifiable Diseases--- United States, 2009 contains the official statistics, in tabular and graphic form, for the reported occurrence of nationally notifiable infectious diseases in the United States for 2009. Unless otherwise noted, the data are final totals for 2009 reported as of June 30, 2010. These statistics are collected and compiled from reports sent by state health departments and territories to the National Notifiable Diseases Surveillance System (NNDSS), which is operated by CDC in collaboration with the Council of State and Territorial Epidemiologists (CSTE). The Summary is available at http://www.cdc.gov/mmwr/summary.html. This site also includes Summary publications from previous years.
The Highlights section presents noteworthy epidemiologic and prevention information for 2009 for selected diseases and additional information to aid in the interpretation of surveillance and disease-trend data. Part 1 contains tables showing incidence data for the nationally notifiable infectious diseases reported during 2009.* The tables provide the number of cases reported to CDC for 2009 and the distribution of cases by month, geographic location, and the patients' demographic characteristics (age, sex, race, and ethnicity). Part 2 contains graphs and maps that depict summary data for certain notifiable infectious diseases described in tabular form in Part 1. Part 3 contains tables that list the number of cases of notifiable diseases reported to CDC since 1978. This section also includes a table enumerating deaths associated with specified notifiable diseases reported to CDC's National Center for Health Statistics (NCHS) during 2002--2007. The Selected Reading section presents general and disease-specific references for notifiable infectious diseases. These references provide additional information on surveillance and epidemiologic concerns, diagnostic concerns, and disease-control activities.
Comments and suggestions from readers are welcome. To increase the usefulness of future editions, comments regarding the current report and descriptions of how information is or could be used are invited. Comments should be sent to Data Operations Team--NNDSS, Division of Notifiable Diseases and Healthcare Information (proposed), Public Health Surveillance Program Office at soib@cdc.gov.
Background
The infectious diseases designated as notifiable at the national level during 2009 are listed in this section. A notifiable disease is one for which regular, frequent, and timely information regarding individual cases is considered necessary for the prevention and control of the disease. A brief history of the reporting of nationally notifiable infectious diseases in the United States is available at http://www.cdc.gov/ncphi/disss/nndss/nndsshis.htm. In 1961, CDC assumed responsibility for the collection and publication of data on nationally notifiable diseases. NNDSS is neither a single surveillance system nor a method of reporting. Certain NNDSS data are reported to CDC through separate surveillance information systems and through different reporting mechanisms; however, these data are aggregated and compiled for publication purposes.
Notifiable disease reporting at the local level protects the public's health by ensuring the proper identification and follow-up of cases. Public health workers ensure that persons who are already ill receive appropriate treatment; trace contacts who need vaccines, treatment, quarantine, or education; investigate and halt outbreaks; eliminate environmental hazards; and close premises where spread has occurred. Surveillance of notifiable conditions helps public health authorities to monitor the effect of notifiable conditions, measure disease trends, assess the effectiveness of control and prevention measures, identify populations or geographic areas at high risk, allocate resources appropriately, formulate prevention strategies, and develop public health policies. Monitoring surveillance data enables public health authorities to detect sudden changes in disease occurrence and distribution, identify changes in agents and host factors, and detect changes in health-care practices.
The list of nationally notifiable infectious diseases is revised periodically. A disease might be added to the list as a new pathogen emerges, or a disease might be deleted as its incidence declines. Public health officials at state health departments and CDC collaborate in determining which diseases should be nationally notifiable. CSTE, with input from CDC, makes recommendations annually for additions and deletions. Although disease reporting is mandated by legislation or regulation at the state and local levels, state reporting to CDC is voluntary. Reporting completeness of notifiable diseases is highly variable and related to the condition or disease being reported (1). The list of diseases considered notifiable varies by state and year. Current and historic national public health surveillance case definitions used for classifying and enumerating cases consistently across reporting jurisdictions are available at http://www.cdc.gov/ncphi/disss/nndss/nndsshis.htm.
Infectious Diseases Designated as Notifiable at the National Level during 2009*
Anthrax
Arboviral diseases, neuroinvasive and nonneuroinvasive
California serogroup virus
Eastern equine encephalitis virus
Powassan virus
St. Louis encephalitis virus
West Nile virus
Western equine encephalitis virus
Botulism
foodborne
infant
other (wound and unspecified)
Brucellosis
Chancroid
Chlamydia trachomatis infections
Cholera
Coccidioidomycosis
Cryptosporidiosis†
Cyclosporiasis
Diphtheria
Ehrlichiosis/Anaplasmosis
Ehrlichia chaffeensis
Ehrlichia ewingii
Anaplasma phagocytophilum
Undetermined
Giardiasis
Gonorrhea
Haemophilus influenzae, invasive disease
Hansen disease (Leprosy)
Hantavirus pulmonary syndrome
Hemolytic uremic syndrome, post-diarrheal
Hepatitis, viral, acute
Hepatitis A, acute
Hepatitis B, acute
Hepatitis B virus, perinatal infection
Hepatitis C, acute
Hepatitis, viral, chronic
Chronic Hepatitis B
Hepatitis C virus infection (past or present)
Human Immunodeficiency Virus (HIV) diagnosis§
Influenza-associated pediatric mortality
Legionellosis
Listeriosis
Lyme disease
Malaria
Measles†
Meningococcal disease
Mumps
Novel influenza A virus infections
Pertussis
Plague
Poliomyelitis, paralytic
Poliovirus infection, nonparalytic
Psittacosis
Q fever†
Acute
Chronic
Rabies
Animal
Human
Rocky Mountain spotted fever
Rubella†
Rubella, congenital syndrome
Salmonellosis
Severe acute respiratory syndrome-associated coronavirus (SARS-CoV) disease
Shiga toxin-producing Escherichia coli (STEC)
Shigellosis
Smallpox
Streptococcal disease, invasive, Group A
Streptococcal toxic-shock syndrome
Streptococcus pneumoniae, drug resistant, all ages, invasive disease
Streptococcus pneumoniae, invasive disease non-drug resistant, in children aged <5 years
Provisional data concerning the reported occurrence of nationally notifiable infectious diseases are published weekly in MMWR. After each reporting year, staff in state health departments finalize reports of cases for that year with local or county health departments and reconcile the data with reports previously sent to CDC throughout the year. These data are compiled in final form in the Summary.
Notifiable disease reports are the authoritative and archival counts of cases. They are approved by the appropriate chief epidemiologist from each submitting state or territory before being published in the Summary. Data published in MMWR Surveillance Summaries or other surveillance reports produced by CDC programs might not agree exactly with data reported in the annual Summary because of differences in the timing of reports, the source of the data, or surveillance methodology.
Data in the Summary were derived primarily from reports transmitted to CDC from health departments in the 50 states, five territories, New York City, and the District of Columbia. Data were reported for MMWR weeks 1--52, which correspond to the period for the week ending January 10, 2009, through the week ending January 2, 2010. More information regarding infectious notifiable diseases, including case definitions, is available at http://www.cdc.gov/ncphi/disss/nndss/nndsshis.htm. Policies for reporting notifiable disease cases can vary by disease or reporting jurisdiction. The case-status categories used to determine which cases reported to NNDSS are published by disease or condition and are listed in the print criteria column of the 2009 NNDSS event code list (Exhibit).
Final data for certain diseases are derived from the surveillance records of the CDC programs listed below. Requests for further information regarding these data should be directed to the appropriate program.
Office of Surveillance, Epidemiology and Laboratory Services
National Center for Health Statistics (NCHS) Office of Vital and Health Statistics Systems (deaths from selected notifiable diseases)
Office of Infectious Diseases (Proposed)
National Center for HIV/AIDS, Viral Hepatitis, STD and TB Prevention Division of HIV/AIDS Prevention (AIDS and HIV infection)
Division of STD Prevention (chancroid; Chlamydia trachomatis, genital infection; gonorrhea; and syphilis)
Division of Tuberculosis Elimination (tuberculosis)
National Center for Immunization and Respiratory Diseases Influenza Division (influenza-associated pediatric mortality)
Division of Viral Diseases, (poliomyelitis, varicella [morbidity and mortality], and SARS-CoV)
National Center for Emerging and Zoonotic Infectious Diseases Division of Vector-Borne Diseases (arboviral diseases)
Division of Viral and Rickettsial Diseases (animal rabies)
Population estimates for the states are from the NCHS bridged-race estimates of the July 1, 2000--July 1, 2008 U.S. resident population from the vintage 2008 postcensal series by year, county, age, sex, race, and Hispanic origin, prepared under a collaborative arrangement with the U.S. Census Bureau. This data set was released on September 2, 2009, and is available at http://www.cdc.gov/nchs/nvss/bridged_race.htm.
Populations for territories are 2008 estimates from the U.S. Census Bureau International Data Base, available at http://www.census.gov/ipc/www/idb/summaries.html. The choice of population denominators for incidence reported in MMWR is based on 1) the availability of census population data at the time of preparation for publication and 2) the desire for consistent use of the same population data to compute incidence reported by different CDC programs. Incidence in the Summary is calculated as the number of reported cases for each disease or condition divided by either the U.S. resident population for the specified demographic population or the total U.S. resident population, multiplied by 100,000. When a nationally notifiable disease is associated with a specific age restriction, the same age restriction is applied to the population in the denominator of the incidence calculation. In addition, population data from states in which the disease or condition was not notifiable or was not available were excluded from incidence calculations. Unless otherwise stated, disease totals for the United States do not include data for American Samoa, Guam, Puerto Rico, the Commonwealth of the Northern Mariana Islands, or the U.S. Virgin Islands.
Interpreting Data
Incidence data in the Summary are presented by the date of report to CDC as determined by the MMWR week and year assigned by the state or territorial health department, except for the domestic arboviral diseases, which are presented by date of diagnosis. Data are reported by the state in which the patient resided at the time of diagnosis. For certain nationally notifiable infectious diseases, surveillance data are reported independently to different CDC programs. For this reason, surveillance data reported by other CDC programs might vary from data reported in the Summary because of differences in 1) the date used to aggregate data (e.g., date of report or date of disease occurrence), 2) the timing of reports, 3) the source of the data, 4) surveillance case definitions, and 5) policies regarding case jurisdiction (i.e., which state should report the case to CDC).
Data reported in the Summary are useful for analyzing disease trends and determining relative disease burdens. However, reporting practices affect how these data should be interpreted. Disease reporting is likely incomplete, and completeness might vary depending on the disease and reporting state. The degree of completeness of data reporting might be influenced by the diagnostic facilities available, control measures in effect, public awareness of a specific disease, and the resources and priorities of state and local officials responsible for disease control and public health surveillance. Finally, factors such as changes in methods for public health surveillance, introduction of new diagnostic tests, or discovery of new disease entities can cause changes in disease reporting that are independent of the true incidence of disease.
Public health surveillance data are published for selected racial/ethnic populations because these variables can be risk markers for certain notifiable diseases. Race and ethnicity data also can be used to highlight populations for focused prevention programs. However, caution must be used when drawing conclusions from reported race and ethnicity data. Different racial/ethnic populations might have different patterns of access to health care, potentially resulting in data that are not representative of actual disease incidence among specific racial/ethnic populations. Surveillance data reported to NNDSS are in either individual case-specific form or summary form (i.e., aggregated data for a group of cases). Summary data often lack demographic information (e.g., race); therefore, the demographic-specific rates presented in the Summary might be underestimated.
In addition, not all race and ethnicity data are collected or reported uniformly for all diseases, the standards for race and ethnicity have changed over time, and the transition in implementation to the newest race and ethnicity standard has taken varying amounts of time for different CDC surveillance systems. For example, in 1990, the National Electronic Telecommunications System for Surveillance (NETSS) was established to facilitate data collection and submission of case-specific data to CDC's National Notifiable Diseases Surveillance System, except for selected diseases. In 1990, NETSS implemented the 1977 Office of Management and Budget (OMB) standard for race and ethnicity, in which race and ethnicity were collected in one variable. Other surveillance programs implemented two variables for collection of race and ethnicity data. The 1997 OMB race and ethnicity standard, which requires collection of multiple races per person using multiple race variables, should have been implemented by federal programs beginning January 1, 2003. In 2003, the CDC Tuberculosis and HIV/AIDS programs were able to update their surveillance information systems to implement 1997 OMB standards. In 2005 the Sexually Transmitted Diseases*Management Information System also was updated to implement the 1997 OMB standards. However other diseases reported to the NNDSS using NETSS were undergoing a major change in the manner in which data were collected and reported to CDC. This change is known as the transition from NETSS to the National Electronic Disease Surveillance System (NEDSS). NEDSS implemented the newer 1997 OMB standard for race and ethnicity. However, the transition from NETSS to NEDSS was slower than originally expected relative to reporting data to CDC using NEDSS; thus, some data are currently reported to CDC using NETSS formats, even if the data in the reporting jurisdictions are collected using NEDSS. Until the transition to NEDSS is complete, race and ethnicity data collected or reported to NETSS using different race and ethnicity standards will need to be converted to one standard. The data are now converted to the 1977 OMB standard originally implemented in NETSS.
Although the recommended standard for classifying a person's race or ethnicity is based on self-reporting, this procedure might not always be followed.
Transition in NNDSS Data Collection and Reporting
Before 1990, data were reported to CDC as cumulative counts rather than individual case reports. In 1990, using NETSS, states began electronically capturing and reporting individual case reports to CDC without personal identifiers. In 2001, CDC launched NEDSS, now a component of the Public Health Information Network, to promote the use of data and information system standards that advance the development of efficient, integrated, and interoperable surveillance information systems at the local, state, and federal levels. One of the objectives of NEDSS is to improve the accuracy, completeness, and timeliness of disease reporting at the local, state, and national levels. CDC has developed the NEDSS Base System (NBS), a public health surveillance information system adopted by 16 states; 31 states have their own NEDSS-compatible based system, and three are in the final stage of adopting their NEDSS-compatible system. A major feature of all NEDSS-compatible solutions, which includes NBS, is the ability to capture data already in electronic form (e.g., electronic laboratory results, which are needed for case confirmation) rather than enter these data manually as in NETSS. In 2009, 16 states used NBS to transmit nationally notifiable infectious diseases to CDC, 27 states used a NEDSS-compatible based system, and the remaining states and territorial jurisdictions continued to use NETSS or other applications. Additional information concerning NEDSS is available at http://www.cdc.gov/phin/activities/applications-services/nedss/index.html.
Methodology for Identifying which Nationally Notifiable Infectious Diseases are Reportable
States and jurisdictions are sovereign entities. Reportable conditions are determined by laws and regulations of each state and jurisdiction. It is possible that some conditions deemed nationally notifiable might not be reportable in certain states or jurisdictions. Determining which nationally notifiable infectious diseases are reportable in NNDSS reporting jurisdictions was determined by analyzing results of the 2009 CSTE State Reportable Conditions Assessment (SRCA). This assessment solicited information from each NNDSS reporting jurisdiction (all 50 U.S. states, the District of Columbia, New York City, and five U.S. territories) regarding which public health conditions were reportable for more than 6 months in 2009 by clinicians, laboratories, hospitals, or "other" public health reporters, as mandated by law or regulation. To assist in the implementation of SRCA, the NNDSS program provided technical assistance to the CSTE for the 2009 SRCA.
In 2007, SRCA became the first collaborative project of such technical magnitude ever conducted by CSTE and CDC. Previously, CDC and CSTE had gathered public health reporting requirements independently. The 2009 SRCA collected information regarding whether each reportable condition was 1) explicitly reportable (i.e., listed as a specific disease or as a category of diseases on reportable disease lists); 2) whether it was implicitly reportable (i.e., included in a general category of the reportable disease list, such as "rare diseases of public health importance"); or 3) not reportable. Only explicitly reportable conditions were considered reportable for the purpose of national public health surveillance and thus reflected in NNDSS. Moreover, to determine whether a condition included in SRCA was reportable across all public health reporter categories and for a specific nationally notifiable infectious disease (NNID) in a reporting jurisdiction, CDC developed and applied a condition algorithm and a results algorithm to run on the data collected in SRCA. Analyzed results of the 2009 SRCA were used to determine whether a NNID was not reportable in a reporting jurisdiction in 2009 and thus noted with an "N" indicator (for "not reportable") in the front tables of this report.
In May 2005, the World Health Assembly adopted revised International Health regulations (IHR) (2) that went into effect in the United States on July 18, 2007. This international legal instrument governs the role of the World Health Organization (WHO) and its member countries, including the United States, in identifying, responding to, and sharing information about Public Health Emergencies of International Concern (PHEIC). A PHEIC is an extraordinary event that 1) constitutes a public health risk to other countries through international spread of disease, and 2) potentially requires a coordinated international response.
The IHR are designed to prevent and protect against the international spread of diseases while minimizing the effect on world travel and trade. Countries that have adopted these rules have a much broader responsibility to detect, respond to, and report public health emergencies that potentially require a coordinated international response in addition to taking preventive measures. The IHR will help countries work together to identify, respond to, and share information about PEHIC.
The revised IHR is a conceptual shift from a predefined disease list to a framework of reporting and responding to events on the basis of an assessment of public health criteria, including seriousness, unexpectedness, and international travel and trade implications. PHEIC are events that fall within those criteria (further defined in a decision algorithm in Annex 2 of the revised IHR). Four conditions always constitute a PHEIC and do not require the use of the IHR decision instrument in Annex 2: Severe Acute Respiratory Syndrome (SARS), smallpox, poliomyelitis caused by wild-type poliovirus, and human influenza caused by a new subtype. Any other event requires the use of the decision algorithm in Annex 2 of the IHR to determine if it is a potential PHEIC. Examples of events that require the use of the decision instrument include, but are not limited to, cholera, pneumonic plague, yellow fever, West Nile fever, viral hemorrhagic fevers, and meningococcal disease. Other biologic, chemical, or radiologic events might fit the decision algorithm and also must be reportable to WHO. All WHO member states are required to notify WHO of a potential PHEIC. WHO makes the final determination about the existence of a PHEIC.
Health-care providers in the United States are required to report diseases, conditions, or outbreaks as determined by local, state, or territorial law and regulation, and as outlined in each state's list of reportable conditions. All health-care providers should work with their local, state, and territorial health agencies to identify and report events that might constitute a potential PHEIC occurring in their location. U.S. State and Territorial Departments of Health have agreed to report information about a potential PHEIC to the most relevant federal agency responsible for the event. In the case of human disease, the U.S. State or Territorial Departments of Health will notify CDC rapidly through existing formal and informal reporting mechanisms (3). CDC will further analyze the event based on the decision algorithm in Annex 2 of the IHR and notify the U.S. Department of Health and Human Services (DHHS) Secretary's Operations Center (SOC), as appropriate.
DHHS has the lead role in carrying out the IHR, in cooperation with multiple federal departments and agencies. The DHHS SOC is the central body for the United States responsible for reporting potential events to WHO. The United States has 48 hours to assess the risk of the reported event. If authorities determine that a potential PHEIC exists, the WHO member country has 24 hours to report the event to WHO.
An IHR decision algorithm in Annex 2 has been developed to help countries determine whether an event should be reported. If any two of the following four questions can be answered in the affirmative, then a determination should be made that a potential PHEIC exists and WHO should be notified:
Is the public health impact of the event serious?
Is the event unusual or unexpected?
Is there a significant risk of international spread?
Is there a significant risk of international travel or trade restrictions?
Doyle TJ, Glynn MK, Groseclose LS. Completeness of notifiable infectious disease reporting in the United States: an analytical literature review. Am J Epidemiol 2002;155:866--74.
Council of State and Territorial Epidemiologists. Events that may constitute a public health emergency of international concern. Position statement 07-ID-06. Available at
http://www.cste.org/PS/2007ps/2007psfinal/ID/07-ID-06.pdf.
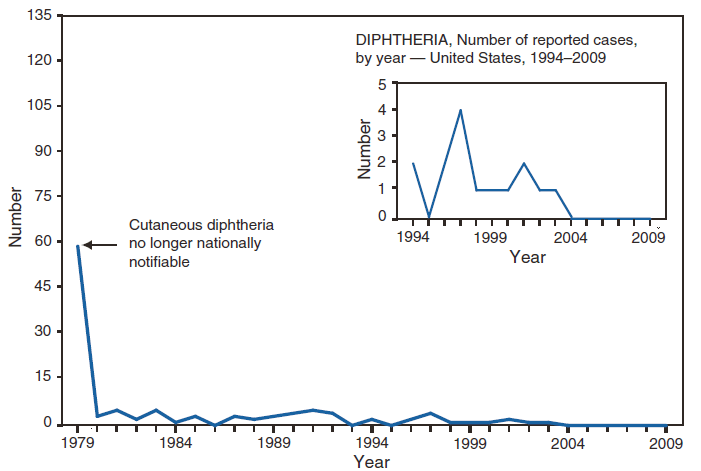
* No cases of diphtheria; poliovirus infection, nonparalytic; Powassan virus disease, non-neuroinvasive; severe acute respiratory syndrome-associated coronavirus disease (SARS-CoV); smallpox; western equine encephalitis virus disease, neuroinvasive and non-neuroinvasive; and yellow fever were reported in 2009. Data on chronic hepatitis B and hepatitis C virus infection (past or present) are not included because they are undergoing data quality review. Data on human immunodeficiency virus (HIV) infections are not included because HIV infection reporting has been implemented on different dates and using different methods than for AIDS case reporting.
* Position Statements the Council of State and Territorial Epidemiologists approved in 2008 for national surveillance were implemented beginning in January 2009. No new conditions were added to the notifiable disease list in 2009.
† In a 2009 position statement the Council of State & Territorial Epidemiologists approved the modified national TB surveillance case definition.
§ AIDS has been reclassified as HIV stage III.
EXHIBIT. Print criteria for conditions reported to the National Notifiable Diseases Surveillance System, January 2009
Event*
Print Criteria†,§
Anaplasma phagocytophilum
Confirmed and probable; unknown from California (CA)
Anthrax
Confirmed; unknown reported from CA
Botulism, foodborne
Confirmed and probable; unknown from CA
Botulism, infant
Confirmed; unknown from CA
Botulism, other (includes wound)
Confirmed; unknown from CA
Botulism, other unspecified
Confirmed; unknown from CA
Botulism, wound
Confirmed; unknown from CA
Brucellosis
Confirmed and probable; unknown from CA
California serogroup virus, neuroinvasive disease
Cases with confirmed and probable case status are printed, per request of CCID/NCZVED. Only cases reported with a disease onset date are published. Data are published according to the week and year of disease onset.
California serogroup virus, non-neuroinvasive disease
Cases with confirmed and probable case status are printed, per request of CCID/NCZVED. Only cases reported with a disease onset date are published. Data are published according to the week and year of disease onset.
Chancroid
All reports are printed.
Chlamydia trachomatis genital infection
All reports are printed.
Cholera (toxigenic Vibrio cholerae O1 or O139)
Confirmed; unknown from CA
Coccidioidomycosis
Confirmed; unknown from CA
Cryptosporidiosis
Confirmed; unknown from CA
Cyclosporiasis
Confirmed; unknown from CA
Diphtheria
CSTE VPD print criteria are used. Cases with confirmed, probable, and unknown case status are printed.
Cases with confirmed and probable case status are printed, per request of CCID/NCZVED. Only cases reported with a disease onset date are published. Data are aggregated and published according to the week and year of disease onset.
Cases with confirmed and probable case status are printed, per request of CCID/NCZVED. Only cases reported with a disease onset date are published. Data are aggregated and published according to the week and year of disease onset.
Ehrlichia chaffeensis
Confirmed and probable; unknown from CA
Ehrlichia ewingii
Confirmed and probable; unknown from CA
Ehrlichiosis/Anaplasmosis, undetermined
Confirmed and probable; unknown from CA
Giardiasis
Confirmed and probable; unknown from CA
Gonorrhea
All reports are printed.
Haemophilus influenzae, invasive disease
CSTE VPD print criteria are used. Cases with confirmed, probable, and unknown case status are printed.
Hansen disease (Leprosy)
Confirmed; unknown from CA
Hantavirus pulmonary syndrome
Confirmed and unknown
Hemolytic uremic syndrome, postdiarrheal
Confirmed, probable, and unknown
Hepatitis A, acute
Confirmed; unknown from CA
Hepatitis B, acute
Confirmed; unknown from CA
Hepatitis C, acute
Confirmed; unknown from CA
HIV diagnoses
Print criteria are determined by NCCHSTP/DHAP.
Influenza-associated mortality
Confirmed
Legionellosis
Confirmed; unknown from CA
Listeriosis
Confirmed; unknown from CA
Lyme disease
Confirmed and probable; unknown from CA
Malaria
Confirmed; unknown from CA
Measles (rubeola), total
CSTE VPD print criteria are used. Cases with confirmed and unknown case status are printed.
Meningococcal disease (Neisseria meningitidis)
Confirmed and probable; unknown from CA
EXHIBIT. (Continued) Print criteria for conditions reported to the National Notifiable Diseases Surveillance System, January 2009
Event*
Print Criteria†,§
Mumps
CSTE VPD print criteria are used. Cases with confirmed, probable, and unknown case status are printed.
Neurosyphilis
All reports are printed.
Novel influenza A virus infections
Cases with confirmed case status are printed.
Pertussis
CSTE VPD print criteria are used. Cases with confirmed, probable, and unknown case status are printed.
Plague
All reports are printed.
Poliomyelitis, paralytic
Confirmed; unknown from CA that are verified as confirmed
Poliovirus infection, nonparalytic
Confirmed; unknown from CA that are verified as confirmed
Powassan virus, neuroinvasive disease
Cases with confirmed and probable case status are printed, per request of CCID/NCZVED. Only cases reported with a disease onset date are published. Data are published according to the week and year of disease onset.
Powassan virus, non-neuroinvasive disease
Cases with confirmed and probable case status are printed, per request of CCID/NCZVED. Only cases reported with a disease onset date are published. Data are published according to the week and year of disease onset.
Psittacosis (Ornithosis)
Confirmed and probable; unknown from CA
Q fever, acute
Confirmed and probable; unknown from CA
Q fever, chronic
Confirmed and probable; unknown from CA
Rabies, animal
Confirmed and unknown
Rabies, human
Confirmed; unknown from CA
Rocky Mountain spotted fever
Confirmed, probable, unknown
Rubella
CSTE VPD print criteria are used. Cases with confirmed and unknown case status are printed.
Rubella, congenital syndrome
CSTE VPD print criteria are used. Cases with confirmed, probable, and unknown case status are printed.
Salmonellosis
Confirmed and probable; unknown from CA
Severe Acute Respiratory Syndrome (SARS)-associated Coronavirus disease (SARS-CoV)
Confirmed
Shiga toxin-producing Escherichia coli (STEC)
All reports printed except unknown from NJ.
Shigellosis
Confirmed and probable; unknown from CA
Smallpox
Confirmed
St. Louis encephalitis virus, neuroinvasive disease
Cases with confirmed and probable case status are printed, per request of CCID/NCZVED. Only cases reported with a disease onset date are published. Data are published according to the week and year of disease onset.
St. Louis encephalitis virus, non-neuroinvasive disease
Cases with confirmed and probable case status are printed, per request of CCID/NCZVED. Only cases reported with a disease onset date are published. Data are published according to the week and year of disease onset.
VPD print criteria are used. Cases with confirmed, probable, and unknown case status are printed.
Vibriosis (non-cholera Vibrio species infections)
Confirmed, probable, and unknown from CA
West Nile virus, neuroinvasive disease
Cases with confirmed and probable case status are printed, per request of CCID/NCZVED. Only cases reported with a disease onset date are published. Data are published according to the week and year of disease onset.
West Nile virus, non-neuroinvasive disease
Cases with confirmed and probable case status are printed, per request of CCID/NCZVED. Only cases reported with a disease onset date are published. Data are published according to the week and year of disease onset.
Western equine encephalitis virus, neuroinvasive disease
Cases with confirmed and probable case status are printed, per request of CCID/NCZVED. Only cases reported with a disease onset date are published. Data are published according to the week and year of disease onset.
Western equine encephalitis virus, non-neuroinvasive disease
Cases with confirmed and probable case status are printed, per request of CCID/NCZVED. Only cases reported with a disease onset date are published. Data are published according to the week and year of disease onset.
Yellow fever
Confirmed and probable; unknown from CA
* Designated by CSTE as nationally notifiable and should be reported to CDC on a regular basis.
† An unknown case classification status is used when a reporting jurisdiction sends aggregate counts of cases or when the surveillance information system of a reporting jurisdiction does not capture case classification data. However, in both situations, cases are verified to meet the case classification (e.g., confirmed, probable, suspected) specified in the print criteria.
§ Print criteria for the National Notifiable Diseases Surveillance System: For a case report of a nationally notifiable disease to print in the Morbidity and Mortality Weekly Report (MMWR), reporting states or territories must have designated the disease reportable in their state or territory for the year corresponding to the data year of report to CDC. After this criterion is met, the disease-specific criteria listed in the exhibit are applied. When the above list indicates that "all reports" will be earmarked for printing, this means that cases designated with "unknown" or "suspect" case confirmation status will print just as "probable" and "confirmed" cases will print. Print criteria for Vaccine Preventable Diseases (VPD) reflect the case-confirmation status print criteria described by the Council of State and Territorial Epidemiologists (CSTE) 1999 Position Statement #ID-08 entitled Vaccine Preventable Diseases Surveillance Data, and subsequent CSTE position statements.
Abbreviations:
CCID Coordinating Center for Infectious Disease
CDC Centers for Disease Control and Prevention
CSTE Council of State and Territorial Epidemiologists
MMWRMorbidity and Mortality Weekly Report
NCIRD National Center for Immunization and Respiratory Diseases, CDC
NCPDCID National Center for Preparedness, Detection, and Control of Infectious Disease
NCZVED National Center for Zoonotic, Vector-Borne, and Enteric Diseases
NEDSS National Electronic Disease Surveillance System
NETSS National Electronic Telecommunications System for Surveillance
NNDL National Notifiable Disease List (infectious diseases reportable to CDC)
NNDSS National Notifiable Diseases Surveillance System
STD*MIS Sexually Transmitted Diseases Management Information System--software for STD surveillance and case management
TIMS Tuberculosis Information Management System--software for TB surveillance and case management
VPD Vaccine Preventable Diseases
Highlights for 2009
Below are summary highlights for certain national notifiable diseases. Highlights are intended to assist in the interpretation of major occurrences that affect disease incidence or surveillance trends (e.g., outbreaks, vaccine licensure, or policy changes).
Anthrax
In 2009, one confirmed case of gastrointestinal anthrax occurred in New Hampshire. The exposure was determined to be the result of participation in a drumming event where animal-hide drums were played. Although several drums were played at the event, two were found to be contaminated with the same Bacillus anthracis strain as infected the patient. The patient recovered with treatment; the case is the first related to animal-hide drum exposures that involved the gastrointestinal form of the disease (1). This event and previous unrelated cases of anthrax associated with contaminated animal-hide drums reported in 2006, 2007, and 2008 in the United States and the United Kingdom (2-5) reflect the low but potential risk for anthrax among persons who 1) make or use drums made of untreated animal hides from countries where anthrax is common in animals, and among persons who 2) are exposed to environments that are cross-contaminated by these activities.
Naturally occurring anthrax epizootics occur annually among U.S. wildlife and livestock populations; in 2009 such events were reported among wildlife and livestock in Texas, North and South Dakota, and Nevada.
Anaraki S, Addiman S, Nixon G, et al. Investigations and control measures following a case of inhalation anthrax in East London in a drum maker and drummer, October 2008. Euro Surveill 2008;13:19076.
Brucellosis
The number of reported brucellosis cases in the United States increased 46.3% in 2009 from the previous year; however, the 2009 case total remains consistent with reports from 2004 through 2007. The reason for the decline in 2008 is unknown. Overall, in 2009, the demographic characteristics of persons with brucellosis remained stable. For patients for whom ethnicity was identified, 61.5% were Hispanic. A majority of cases (55.6%) were reported from California, Florida, Georgia, Michigan, and Texas.
Substantial progress has been made to eradicate brucellosis from the U.S. domestic livestock population through the Cooperative State-Federal Brucellosis Eradication Program
(1).By the end of July 2009, all 50 States, Puerto Rico, and the Virgin Islands were officially classified as Class Free for bovine brucellosis (Brucella abortus)
(2). All States except Texas are classified as Stage III (Free) for swine brucellosis; Texas remains classified at Stage II.
Brucella abortus remains enzootic in elk and bison in the greater Yellowstone National Park area, and
Brucella suis is enzootic in feral swine in the Southeast.
Risk factors associated with brucellosis include the consumption of unpasteurized milk or soft cheeses. The risk for brucellosis from domestic dairy products is low. Unpasteurized dairy products from countries where brucellosis is endemic remain a source of the illness for immigrants and travelers. Hunters are at an elevated risk for contracting brucellosis from the carcass or meat of infected animals. In addition, exposure to
Brucella spp. can occur accidentally in diagnostic and research laboratories because of their high potential for aerosol transmission
(3). For the same reason, biosafety level 3 practices, containment, and equipment are recommended for laboratory manipulation of isolates
(4). In the event of an exposure, post-exposure prophylaxis can effectively prevent illness
(5). CDC provides recommendations for laboratory exposures and assistance with serologic monitoring of exposed laboratory workers at telephone 404-639-1711.
Donch DA, Gertonson AA, Rhyan JH, Gilsdorf MJ. Status report---fiscal year 2009 cooperative state-federal Brucellosis Eradication Program. Washington, DC: US Department of Agriculture; 2010.
CDC, National Institutes of Health. Biosafety in microbiological and biomedical laboratories (BMBL). 5th ed. Washington, DC: US Department of Health and Human Services, CDC, National Institutes of Health; 2007. Available at: http://www.cdc.gov/biosafety/publications/bmbl5/index.htm.
The incidence of coccidioiodomycosis increased in 2009, although this increase might be partially artifactual. In 2009, one of the major commercial laboratories in Arizona changed reporting practices to conform to the CSTE laboratory case definition, which was revised in 2007 to include cases with a single positive enzyme immunoassay result (1). As a result, the increase in 2009 case counts in Arizona might be attributed, at least in part, to an artifactual increase.
Approximately 60% of coccidioidomycosis cases in the United States occur in Arizona. The public health burden of this disease on Arizona is considerable, as described in a recent report, which explained the use of enhanced surveillance (2). Among this representative group of coccidioidomycosis case-patients, self-reported median duration of illness was 42 days, and 41% of case-patients were hospitalized for coccidioidomycosis; 74% of those employed and 59% of students were unable to attend school or work.
Physicians, particularly in areas where the disease is endemic, should continue to maintain a high suspicion for acute coccidioidomycosis, especially among patients with an influenza-like illness or pneumonia who live in or have visited disease-endemic areas.
Council of State and Territorial Epidemiologists. Revision of the surveillance case definition for Coccidioidomycosis. Position statement 07-ID-13. Atlanta, GA: Council of State and Territorial Epidemiologists; 2007. Available at http://www.cste.org/position%20statements/searchbyyear2007final.asp.
Tsang CA, Anderson SM, Imholte SB, Erhart LM, Chen S, Park BJ. Enhanced surveillance of coccidioidomycosis, Arizona, USA, 2007--2008. Emerg Infect Dis 2010;11:1738--44.
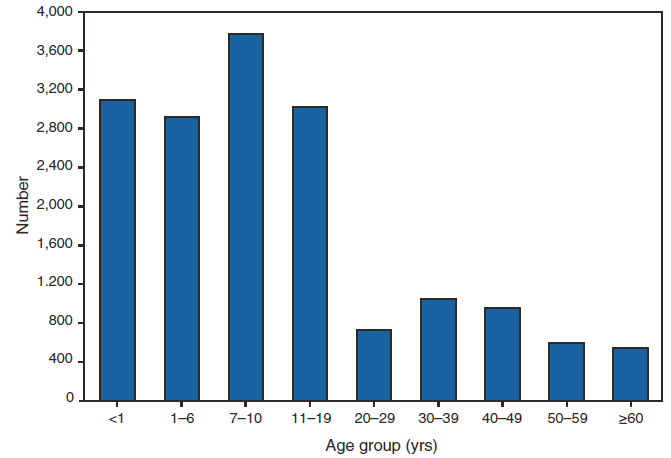
Cryptosporidiosis
In 2009, cryptosporidiosis incidence decreased for the second consecutive year. The decreases in incidence in 2008 and 2009 follow a >3-fold rise during 2005--2007. Whether the changes in cryptosporidiosis reporting reflect a true change in cryptosporidiosis incidence or reflect changing diagnosis, testing, and reporting patterns is unclear.
As in previous years, cryptosporidiosis case reports were influenced by outbreaks, particularly those associated with treated recreational water. Although cryptosporidiosis affects persons in all age groups, cases were most frequently reported in children aged 1--9 years. An almost tenfold increase in transmission of Cryptosporidium in these young children occurred during summer through early fall, coinciding with increased use of recreational water, which is a known risk factor for cryptosporidiosis. Good hygiene practices are essential to prevention, especially in high-risk settings. Persons should also avoid food and water that might be contaminated. Cryptosporidium oocysts can be detected routinely in treated recreational water (1). Contamination of, and the subsequent transmission through, recreational water is facilitated by the substantial number of Cryptosporidium oocysts that can be shed by a single person; the extended time that oocysts can be shed (2); the low infectious dose (3); and the chlorine tolerance of Cryptosporidium oocysts (4). The application of molecular epidemiology (i.e., genotyping and subtyping Cryptosporidium specimens) to clinical and environmental samples has demonstrated potential to expand our knowledge of Cryptosporidium epidemiology (5).
Shields JM, Gleim ER, Beach MJ. Prevalence of Cryptosporidium spp. and Giardia intestinalis in swimming pools, Atlanta, Georgia. Emerg Inf Dis 2008;14:948--50.
Chappell CL, Okhuysen PC, Sterling CR, DuPont HL. Cryptosporidium parvum: intensity of infection and oocyst excretion patterns in healthy volunteers. J Infect Dis 1996;173:232--6.
DuPont HL, Chappell CL, Sterling CR, Okhuysen PC, Rose JB, Jakubowski W. The infectivity of Cryptosporidium parvum in healthy volunteers. N Engl J Med 1995;332:855--9.
Shields JM, Hill VR, Arrowood MJ, Beach MJ. Inactivation of Cryptosporidiumparvum under chlorinated recreational water conditions. J Water Health 2008;6:513--20.
Xiao L. Molecular epidemiology of cryptosporidiosis: an update. Exp Parasitol 2010;124:80--89
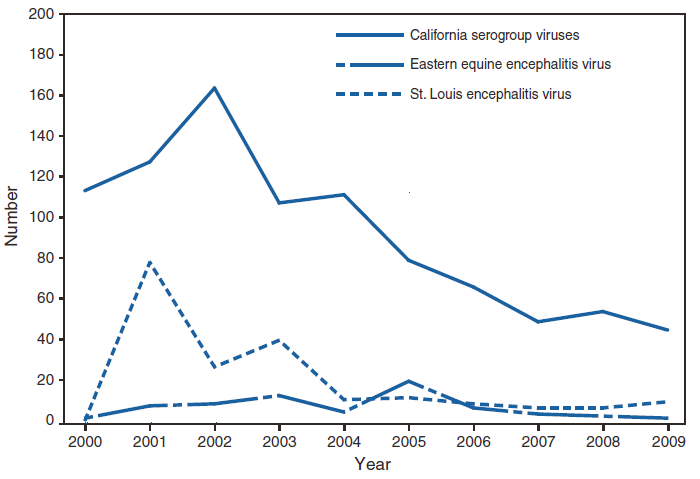
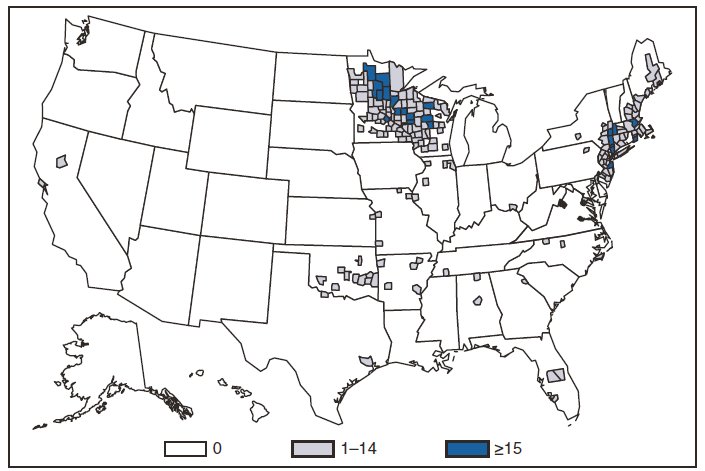
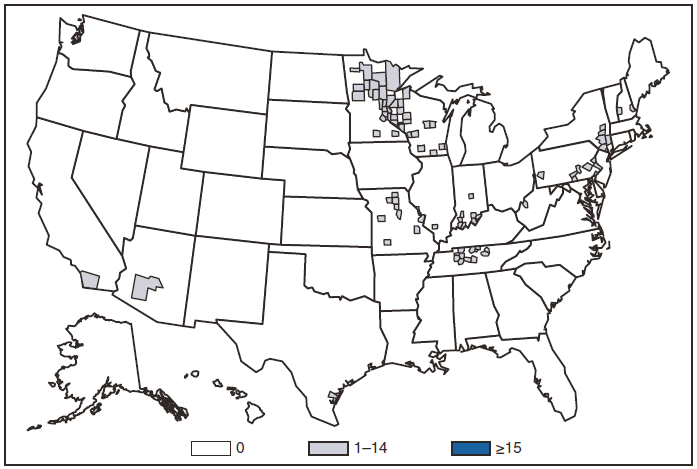
Ehrlichiosis and Anaplasmosis
Four categories of ehrlichiosis and anaplasmosis were reportable during 2009: 1) Ehrlichia chaffeensis, 2) Ehrlichia ewingii, 3) Anaplasma phagocytophilum, and 4) Human ehrlichiosis/anaplasmosis - undetermined.
During 2009, infections caused by E. chaffeensis were reported primarily from the lower Midwest and the Southeast, reflecting the historically known range of the primary tick vector species (Amblyomma americanum). Infection caused by A. phagocytophilum was reported primarily from the upper Midwest and coastal New England, reflecting both the range of the primary tick vector species (Ixodes scapularis) and preferred animal hosts for tick feeding. Missouri, Ohio, and South Carolina reported seven confirmed cases of E. ewingii infection. The category "Human ehrlichiosis/anaplasmosis - undetermined" includes cases for which a specific etiologic agent could not be identified using available serologic tests. The number of "Human ehrlichiosis/anaplasmosis - undetermined" cases reported from some northern states (1) reflects state-specific classifications based on indistinguishable antigenic cross-reactivity or situations in which physicians, confused regarding the likely causative agent, ordered single or inappropriate tests (e.g., ordering only ehrlichiosis tests in a region where anaplasmosis is expected to predominate).
During 2009, cases attributed to E. chaffeensis remained similar to numbers reported the previous year, whereas those attributed to A. phagocytophilum cases increased by 15% (1,009 to 1,161). The numbers of reported ehrlichiosis and anaplasmosis cases have increased more than twofold during the last decade. Increases in the numbers of reported cases might be the result of several factors, including ecological changes influencing vector tick populations and disease transmission, changes in diagnostic approaches that alter detection rates, or changes in surveillance and reporting. Changes in the case definition that became effective in January 2008 (2) also might have altered how cases were classified.
Council of State and Territorial Epidemiologists. Revision of the surveillance case definitions for ehrlichiosis. Position statement 07-ID-03. Atlanta, GA: Council of State and Territorial Epidemiologists; 2007. Available at http://www.cste.org/position%20statements/searchbyyear2007final.asp.
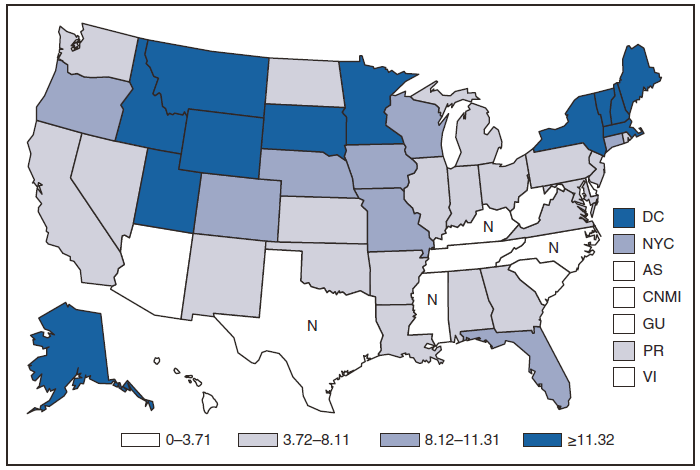
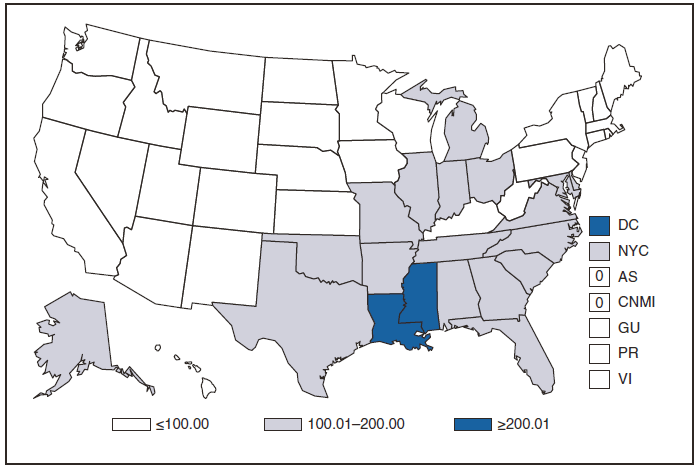
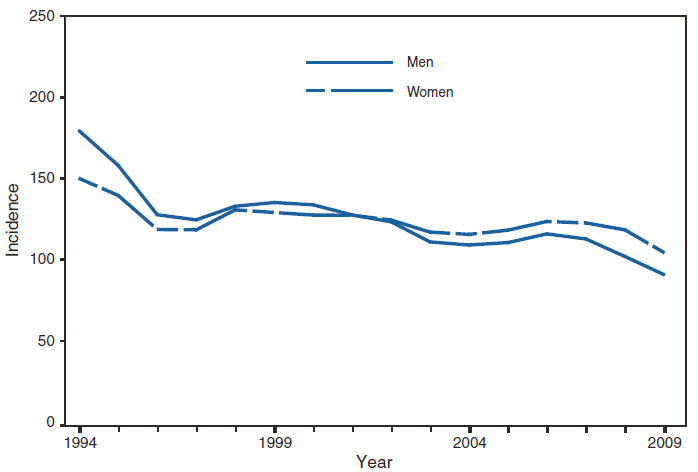
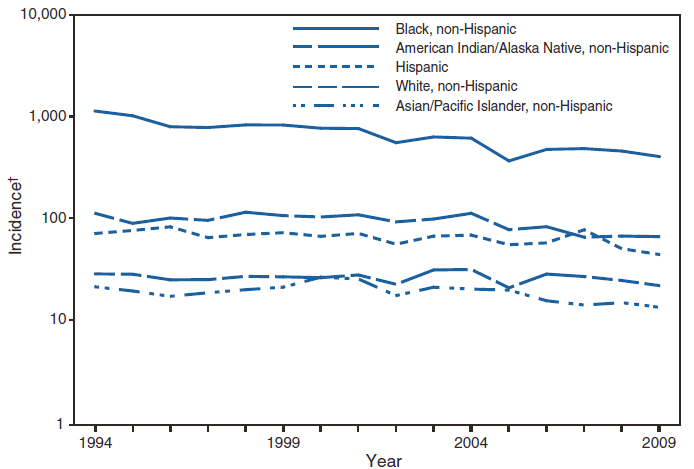
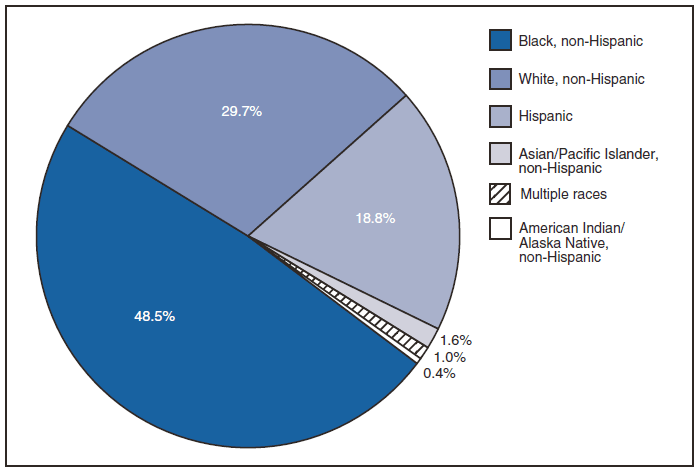
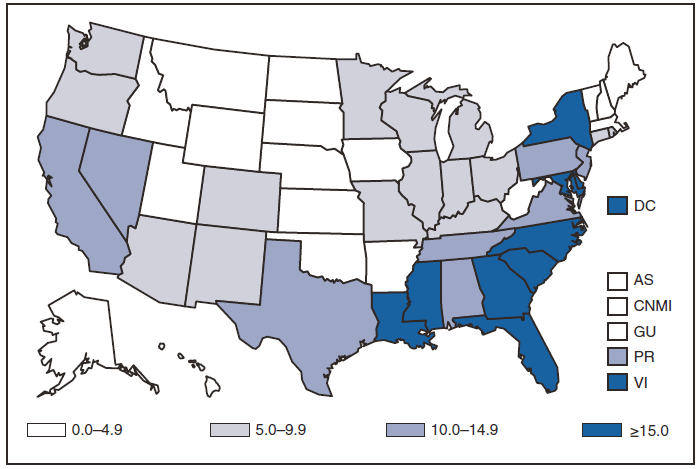
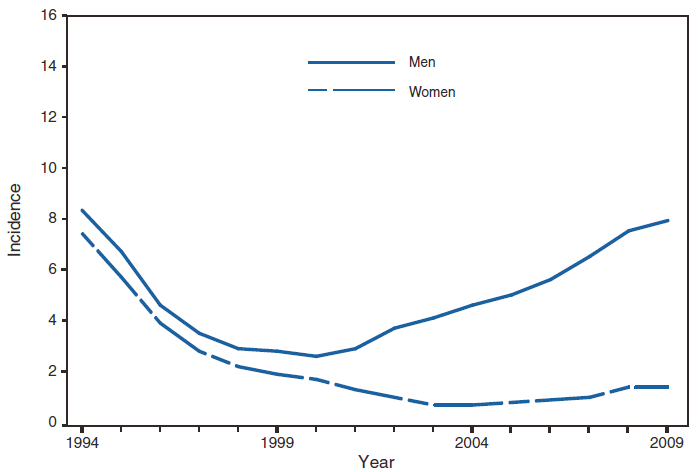
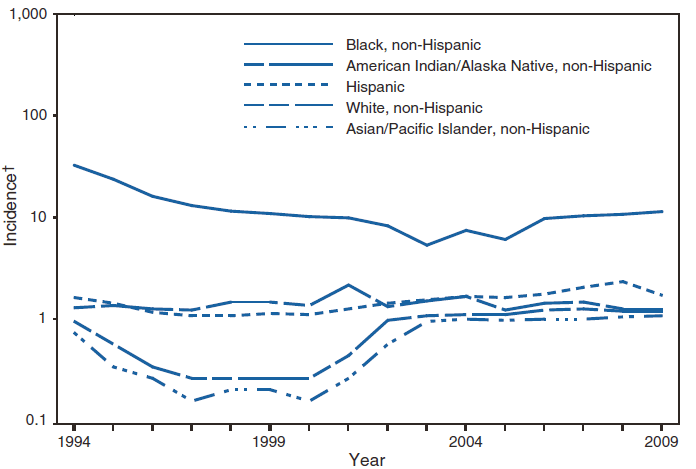
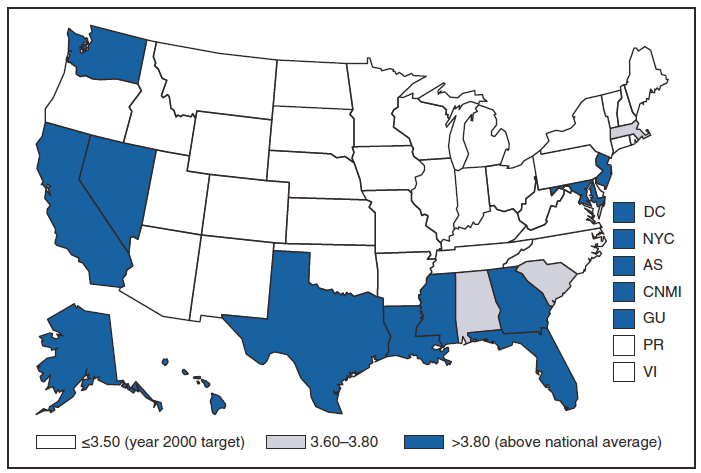
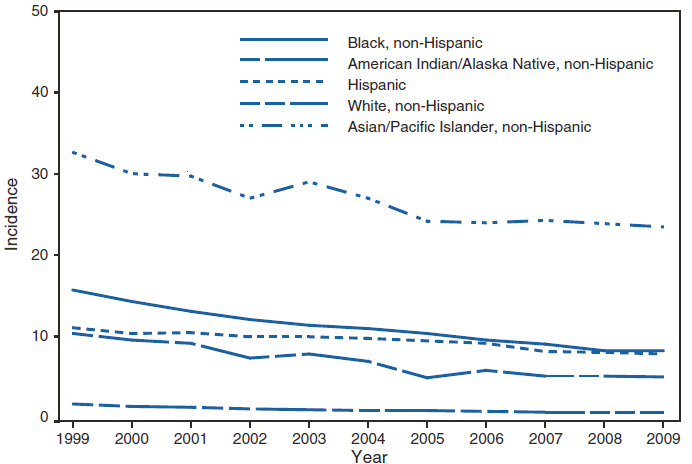
Gonorrhea
In 2009, the rate of gonorrhea was the lowest ever reported. During 2006--2009, decreases in gonorrhea rates were reported in all racial/ethnic groups and in all age groups. Although the gonorrhea rate among women has remained slightly higher than that among men, rates have decreased in both groups. Despite overall rate decreases, the rate for blacks in 2009 was 20.5 times higher than that for whites whereas the rates among American Indians/Alaska Natives and Hispanics were 4.2 and 2.2 times higher, respectively, than rates in whites (1).
CDC. Sexually transmitted disease surveillance, 2009. Atlanta, GA: U.S. Department of Health and Human Services.
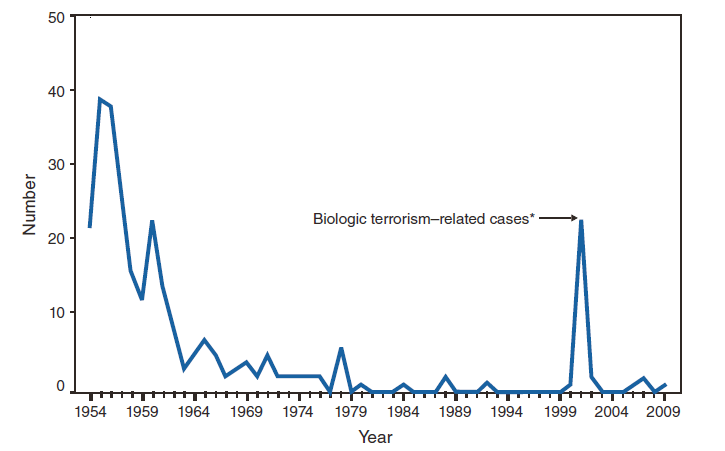
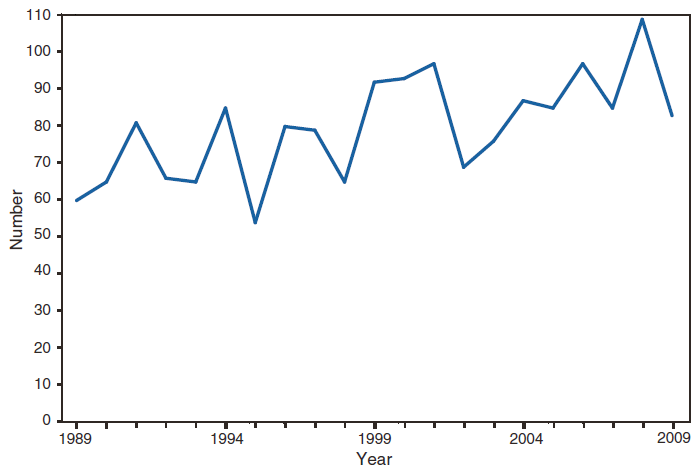
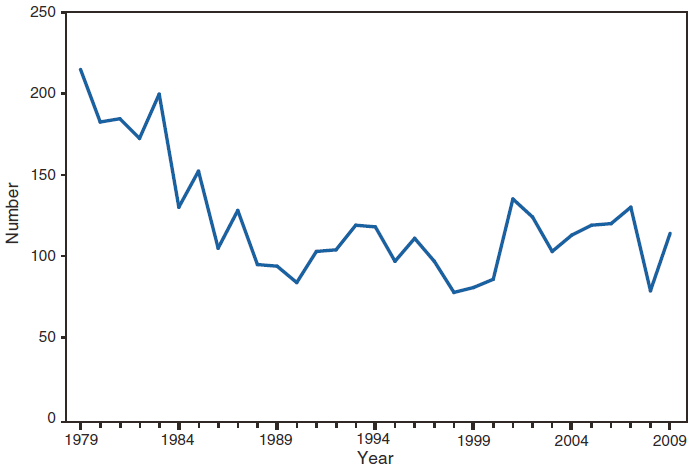
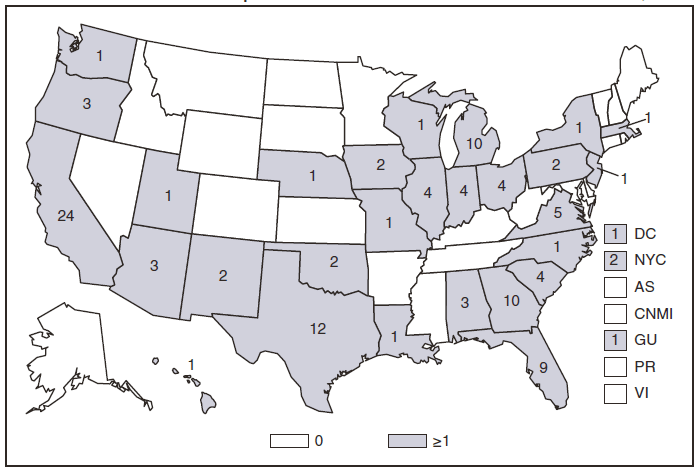
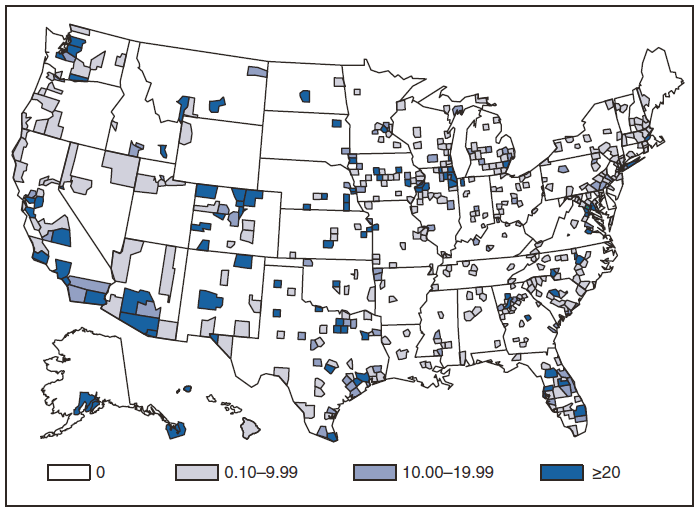
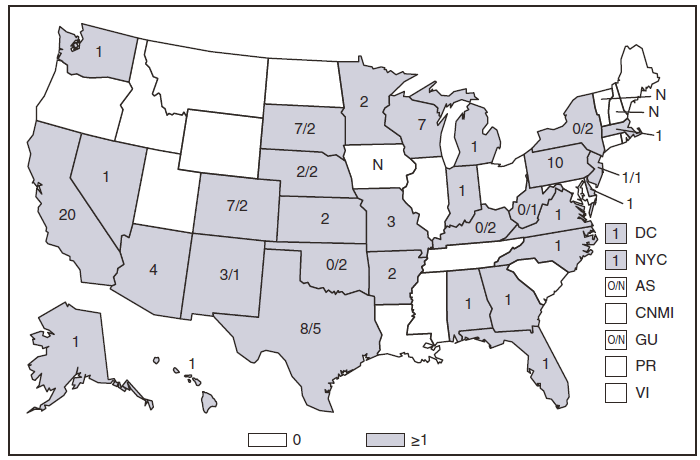
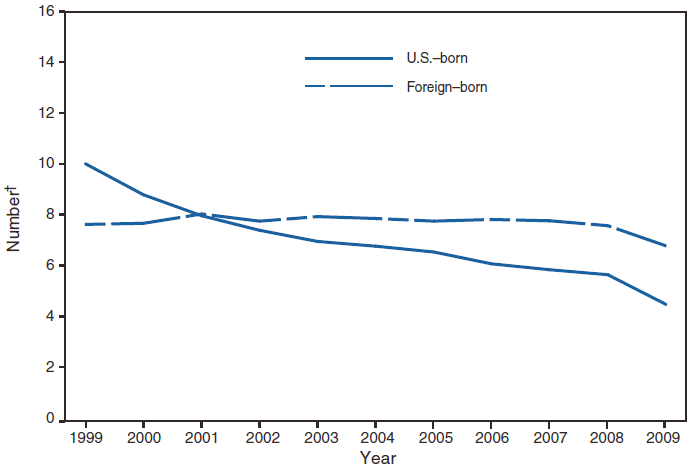
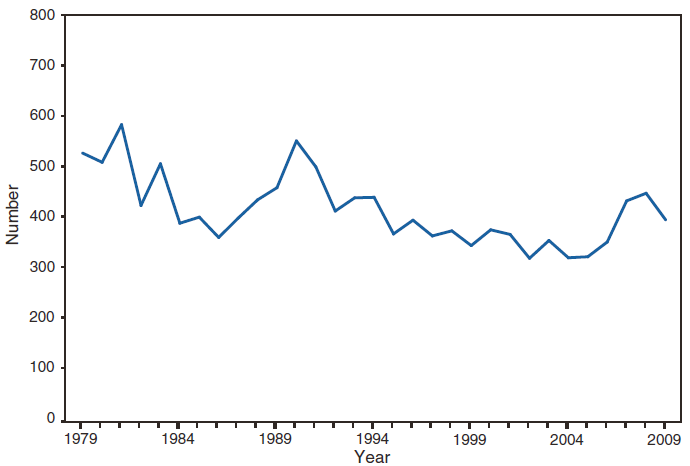
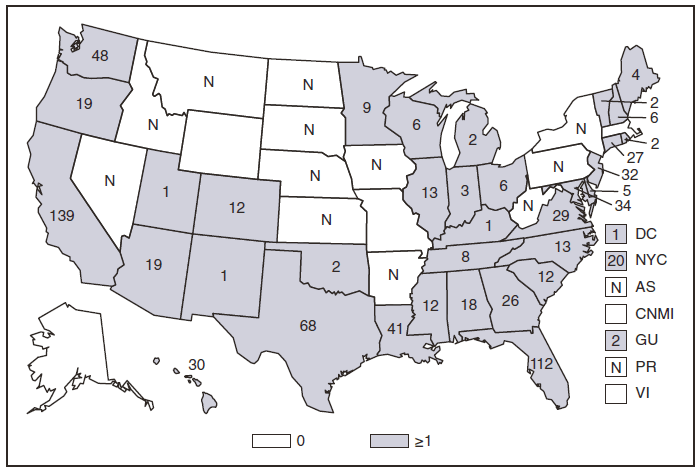
Hansen Disease (Leprosy)
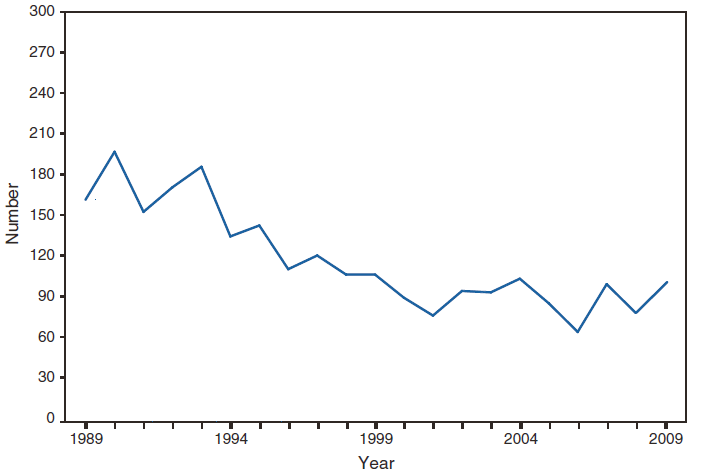
The number of cases of Hansen's disease (HD) reported in the United States peaked in 1985 and decreased until 2006. Since 2006 the annual number of reported cases has fluctuated between 73 and 109. Cases were reported from 20 states and one territory; 64.4% of cases were reported from California, Hawaii, and Texas. HD is not highly transmissible; cases appear to be related predominantly to immigration from areas in which the disease is endemic. Information on access to clinical care is available at www.hrsa.gov/hansens.
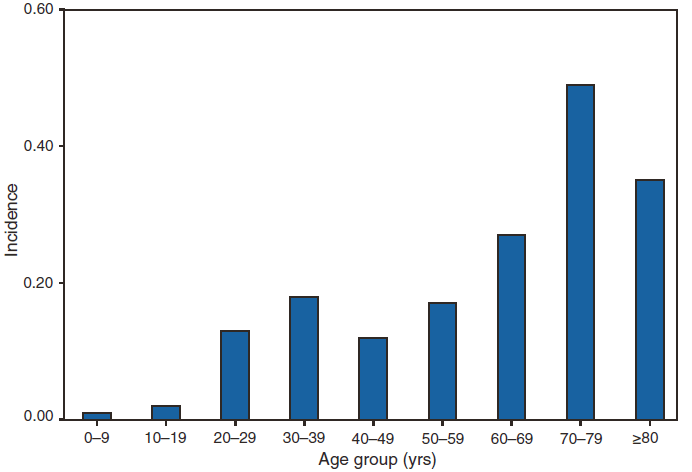
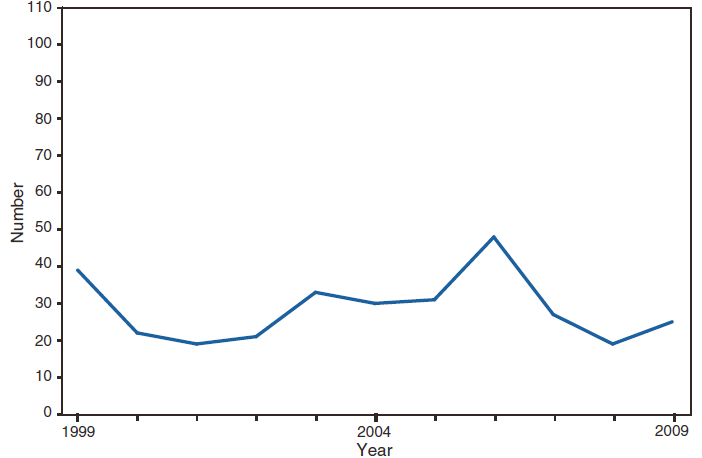
Hantavirus Pulmonary Syndrome
Less than 7% of hantavirus pulmonary syndrome (HPS) cases in the United States have been in pediatric populations. Each year, 20--40 cases of HPS occur in the United States; cases in persons aged <17 years make up fewer than 7% of those cases, and cases in children aged <10 years are exceptionally rare. However, in 2009, six pediatric cases of HPS were identified (one case resulted in a fatality), including four cases in persons aged <10 years (1).
In June 2004, the Council of State and Territorial Epidemiologists added influenza-associated pediatric mortality (i.e., among persons aged <18 years) to the list of conditions reportable to the National Notifiable Diseases Surveillance System. Cumulative year-to-date incidence is published each week in MMWR Table I for low-incidence nationally notifiable diseases.
The majority of pediatric deaths that occurred during the 2008--09 and 2009--10 influenza seasons, including those associated with the 2009 pandemic influenza A (H1N1) virus (2009 H1N1), were reported in 2009. The 2009 H1N1 virus was first detected in the United States in mid-April 2009 and became the predominant circulating influenza virus worldwide. From April 15 through the end of 2009, 96% of all subtyped influenza A viruses from the United States were 2009 H1N1. For this report, pediatric deaths associated with seasonal influenza viruses are analyzed separately from those associated with 2009 H1N1 infection. Influenza A viruses that were not subtyped are classified as seasonal influenza A viruses for deaths that occurred during January 1 -- April 14, 2009 and as 2009 H1N1 for deaths that occurred during April 15 -- December 31, 2009. Of the 358 influenza-associated pediatric deaths reported to CDC during 2009, a total of 290 (81%) were associated with the 2009 H1N1 virus and 68 (19%) were associated with seasonal influenza viruses. Of the 37 seasonal influenza A viruses, 11 (30%) were subtyped; 9 were seasonal A(H1N1) viruses and 2 were influenza A (H3N2) viruses. Twenty-six (70%) were influenza A viruses that were not subtyped and the remaining 31 were influenza B viruses.
The median age at the time of death in 2009 was higher for children presumed infected with 2009 H1N1 virus (9.3 years) than for those infected with seasonal influenza viruses (7.5 years). Both groups had a higher median age than was observed in the previous 3 years when the median age at death ranged from 4 years in 2006 to 7.4 years in 2007. The distributions of race, ethnicity, and sex were similar for children infected with the seasonal influenza viruses and children infected with the 2009 H1N1 virus. The proportion of children infected with seasonal influenza virus admitted to the hospital before death (73%) was similar to that among those infected with 2009 H1N1 virus (69%) but higher than that seen in the previous 3 years (range: 51%-- 62%). Children who died following infection with 2009 H1N1 virus were more likely to have at least one chronic condition placing them at increased risk for influenza-associated complications (67%) compared with children with seasonal influenza infection in 2009 (42%). During the previous 3 years, the percent of children with at least one chronic medical condition has ranged from 43% to 57%. Among children who had specimens collected for bacterial culture from sterile sites, no substantial difference was present in the proportion with bacterial coinfection for children with 2009 H1N1 (57%) and seasonal influenza infection (58%). For children with a bacterial coinfection, Staphylococcus aureus was identified in 12 of 18 (67%) children with seasonal influenza and 17 of 44 (39%) children with 2009 H1N1 infection. Of the S. aureus isolates identified among all deaths, 18 were methicillin-resistant, nine were methicillin-sensitive, and two did not have sensitivity testing performed. Coinfection with Streptococcus pneumoniae occurred in 2 of 18 (11%) children with seasonal influenza and 12 of 44 (27%) children with 2009 H1N1 infection.
Of 45 children aged ≥6 months who died with the seasonal influenza virus and for whom seasonal vaccination status was known, only seven (16%) were vaccinated against influenza as recommended by the Advisory Committee on Immunization Practices (ACIP) for 2009 (1). Of the 158 children aged ≥6 months who died with the 2009 A (H1N1) virus and for whom the vaccination status was known, 27 (17%) were vaccinated against seasonal influenza but only one (0.8%) received 2009 A(H1N1) vaccine according to ACIP recommendations.
Children who died with 2009 H1N1 were older and more likely to have an underlying condition that placed them at high risk for influenza complications than children who died with seasonal influenza. The proportion of children with bacterial co-infection was similar among those with seasonal influenza and 2009 H1N1. Continued surveillance of influenza-related mortality is important to monitor both the effects of seasonal and novel influenza and the effect of interventions in children.
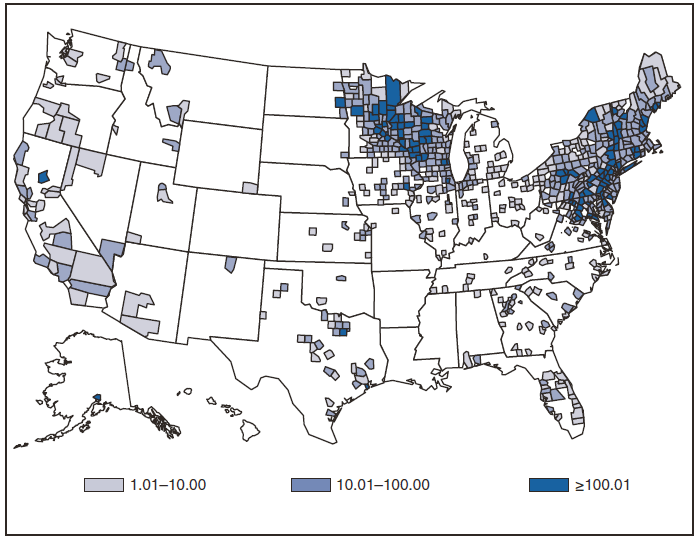
Lyme disease is caused in North America by Borrelia burgdorferi sensu stricto, a spirochete transmitted by certain species of Ixodes ticks. Manifestations of infection include erythema migrans, arthritis, carditis, and neurologic deficits. Effective January 2008, the national surveillance case definition was revised to include reporting of probable cases and to update laboratory criteria to reflect current testing practices. Between 2008 and 2009 there was a 3.6% increase in confirmed cases and 35.6% increase in probable cases. Much of the increase can be attributed to variability in surveillance practices, although evidence of true emergence exists in certain areas. Because of the burden on endemic states posed by Lyme disease surveillance, some states have modified surveillance protocols to better manage limited resources. States using modified methods, including case estimation, might report decreased case counts.
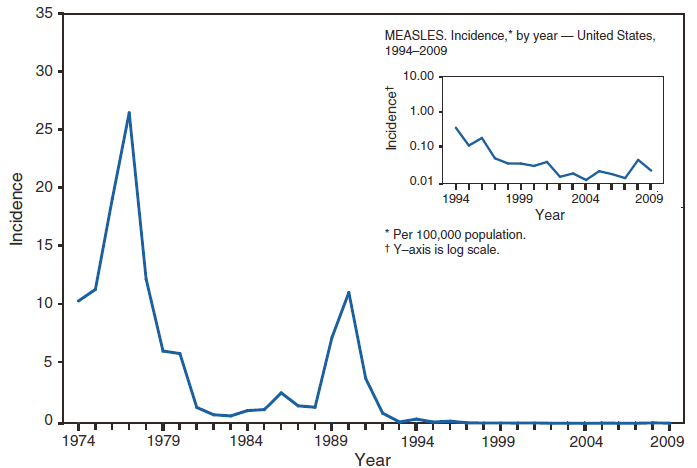
Measles
Measles was declared eliminated from the United States in 2000. Since then, elimination has been maintained through high population immunity (1). Nonetheless, because measles remains endemic in much of the world; importations continue to result in sporadic cases and outbreaks in the United States, which can be costly to control (2).In recent years, the majority of measles cases in 2009 (80%) were import associated (3). Measles was classified as internationally imported in 21 cases, 14 of which were in U.S. residents exposed while traveling abroad, and 7 of which were among international visitors. Source countries for imported measles cases in 2009 included: United Kingdom (8 ), India (6 ), China (2 ), Philippines (2 ), Vietnam (1 ), Italy (1 ), and Cape Verde (1 ).
Thirty-three states reported no measles cases in 2009; 11 states and the District of Columbia reported fewer than 3 cases, and 6 states reported a total of 8 outbreaks (defined as 3 or more epidemiologically linked cases). Outbreaks ranged from 3 to 15 cases (median: 4). Seven outbreaks (87%) had viral and/or epidemiologic evidence of imported source. Six outbreaks (75%) included case-patients who reported personal belief exemptions. Of the 45 unvaccinated U.S. residents with measles in 2009, 20 (44%) held personal or religious beliefs opposing vaccination, and 10 (22%) were among children aged 15 months to 5 years whose parents had chosen to delay their MMR vaccination.
Hutchins SS, Bellini W, Coronado V, et al. Population immunity to measles in the United States. J Infect Dis 2004:189(Suppl 1):S91--97.1.
Parker AA, Staggs W, Dayan G, et al. Implications of a 2005 measles outbreak in Indiana for sustained elimination of measles in the United States, N Engl J Med 2006; 355:447--55.
Council of State and Territorial Epidemiologists. Revision of measles, rubella, and congenital syndrome case classification as part of elimination goals in the United States. Position statement 2006-ID-16. Available at http://www.cste.org/position%20statements/searchbyyear2006.asap.
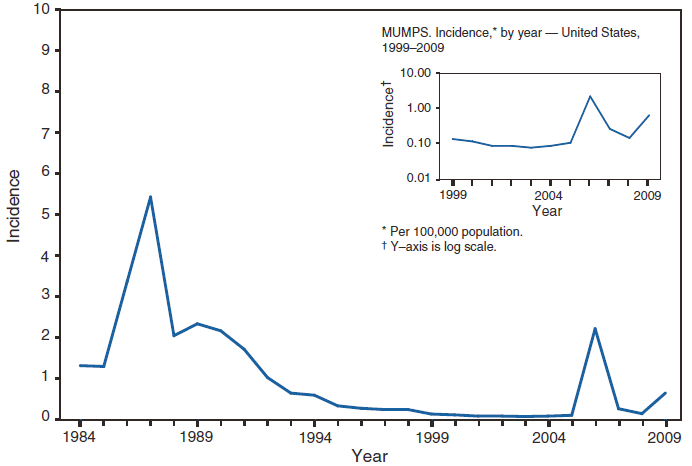
Mumps
The majority (90%) of mumps cases reported in the United States during 2009 were associated with a large outbreak focused in the Northeastern states (primarily New York and New Jersey) that began in New York in June 2009 (1). A total of 1,776 cases occurred through December 31, 2009. The outbreak primarily affected adolescent boys in the Orthodox Jewish communities. Fewer than 3% of the cases associated with this outbreak occurred among persons outside this community. Most cases (77%) were among males and 36% were among adolescents aged 13 to 17 years. Among the patients for whom vaccination status was reported, 88% had received at least 1 dose of mumps-containing vaccine, and 76% had received 2 doses. This was the largest mumps outbreak to occur in the United States since 2006 (2).
Dayan G, Quinlisk P, et al. Recent resurgence of mumps in the United States. New Engl J Med 2008;358:1580--9.
Novel Influenza A
In 2007, the Council of State and Territorial Epidemiologists added novel influenza A virus infection to the list of conditions reportable to the National Notifiable Diseases Surveillance System. Novel influenza A virus infections are human infections with influenza A viruses that are different from currently circulating human influenza A (H1) and A (H3) viruses. These viruses include those that are subtyped as non-human in origin and those that cannot be subtyped with standard methods and reagents.
After recognition of the first cases of infection with 2009 pandemic influenza A (H1N1) virus in April 2009, CDC and state health departments initiated enhanced surveillance to identify additional cases of 2009 pandemic influenza A (H1N1) virus infection. From April 15 to July 24, 2009, state and territorial health departments were asked to submit a daily line list of individual confirmed and probable cases of 2009 pandemic influenza A (H1N1) virus infections to the Influenza Division at CDC. A total of 43,771 cases were reported from all 50 states, Washington DC, and four territories during that 14-week period.
In addition, four cases of human infection with novel influenza A viruses, unrelated to the 2009 pandemic influenza A (H1N1) virus strain, were reported from three states (two from Iowa, one from Kansas, and one from Minnesota). These four cases represented sporadic cases of human infection; two patients were infected with swine influenza A (H1N1) viruses, and the remaining two were infected with swine influenza A (H3N2) viruses. Transmission of swine influenza A viruses to humans usually occurs among persons in direct contact with pigs or in those who have visited places where pigs have been present (e.g. agricultural fairs, farms, and petting zoos). Three of the four patients had direct contact with pigs. No definite exposure to swine was identified in one case. These cases did not result in sustained human-to-human transmission or community outbreaks.
Surveillance for human infections with all novel influenza A viruses remains essential even with the sustained community transmission of the 2009 pandemic influenza A (H1N1) virus. The early identification and investigation of these cases is critical to evaluate the extent of outbreaks and possible human-to-human transmission.
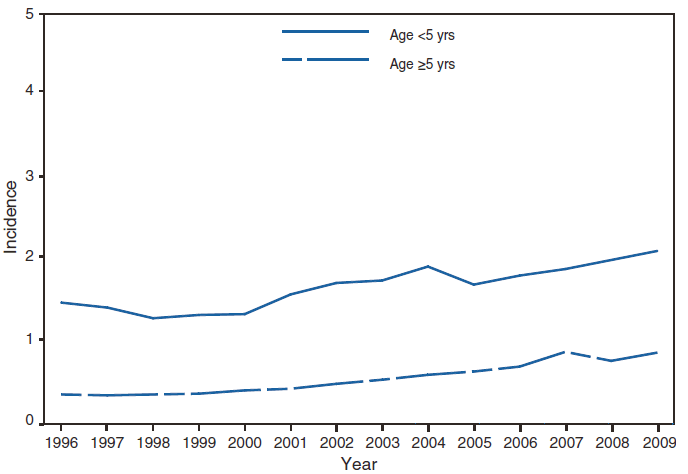
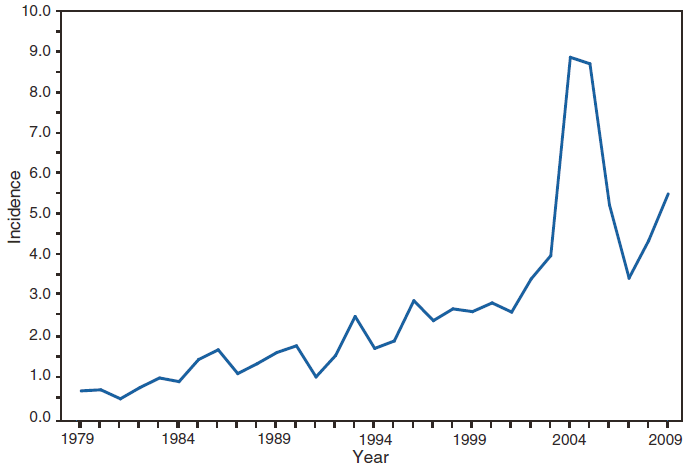
Pertussis
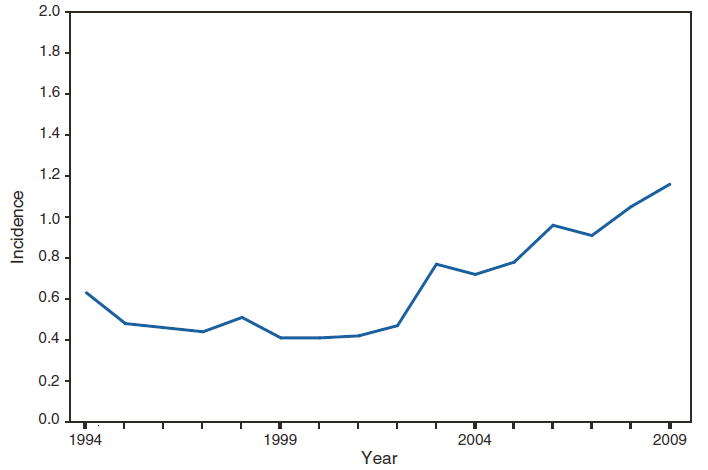
Although the incidence of reported pertussis declined in the United States following the 2004 peak (8.9 per 100,000), overall incidence is increasing again (5.54 in 2009, 4.18 in 2008, and 3.53 in 2007). Infants aged <6 months, who are at greatest risk for severe disease and death, continued to have the highest reported rate of pertussis (126.9 per 100,000). However, adolescents (aged 10--19 years) and adults (aged >20 years) accounted for approximately half of reported cases in 2009, and the contribution of cases in persons aged 7-10 years has been increasing in recent years (13% in 2007, 23.5% of cases in 2008, 23% of cases in 2009). In 2005, a combined tetanus toxoid, reduced diphtheria toxoid, and acellular pertussis vaccine (Tdap) was recommended for use among adolescents and adults (1,2). Tdap coverage continues to increase among persons aged 13--17 years (10.8% in 2006 to 55.6% in 2009) (3,4), and early data suggests a decline in reported pertussis incidence among adolescents following the introduction of Tdap (5). Continued monitoring of disease trends through national surveillance will be important to assess the direct effect of Tdap among target vaccine age groups and the indirect effects of vaccination on infants.
Poliomyelitis, Paralytic and Poliovirus Infections
Vaccine-Associated Paralytic Poliomyelitis (VAPP) is a rare adverse event that can occur following vaccination with live-attenuated oral poliovirus vaccine (OPV) (1). Inactivated poliovirus vaccine (IPV) does not cause VAPP. To reduce the risk of VAPP, the United States changed from an all OPV schedule to a sequential IPV/OPV schedule in 1997, and then to an all IPV schedule in 2000(2). Before the use of OPV was discontinued in 2000, approximately 8 cases of VAPP occurred in the United States each year (3). Since 2000, only two cases of VAPP have been reported in the United States, one in 2005 in a traveler to countries using OPV and a second, described below, who had common-variable immunodeficiency (CVID) (4).
In 2009, the Minnesota Department of Health reported VAPP in a U.S.-born resident with longstanding CVID. The case-patient, aged 44 years, had abrupt onset of limb and respiratory paralysis beginning in December 2008 and died in March 2009. A stool culture for enterovirus obtained in March 2009 tested positive for an enterovirus, which was later identified as type 2 vaccine-derived poliovirus. The number of genetic mutations in this virus suggested that it had been acquired by the case-patient in the mid 1990s, around the time that a household member was vaccinated with OPV (5).
DeVries, A, Harper, J, Murray, A. Neuroinvasive immunodeficiency-associated vaccine-derived polio Minnesota, 2008. Abstract #652 presented at the 47th Annual Meeting of IDSA, Philadelphia, PA, October 29-November 1, 2009.
Q Fever
During 2009, both acute and chronic Q fever infections were notifiable.Among the 113 cases reported in 2009, 93 were acute infection, and 20 were chronic Q fever. Cases remained distributed across the United States, in keeping with the consideration that Q fever is considered enzootic in ruminants (sheep, goats, and cattle) throughout the country.
During 2009, the number of cases of Q fever reported remained similar to those reported during the previous year.Although relatively few human cases are reported annually, Q fever is believed to be substantially underreported because of its nonspecific presentation and the subsequent failure of clinicians to suspect infection and request appropriate diagnostic tests.
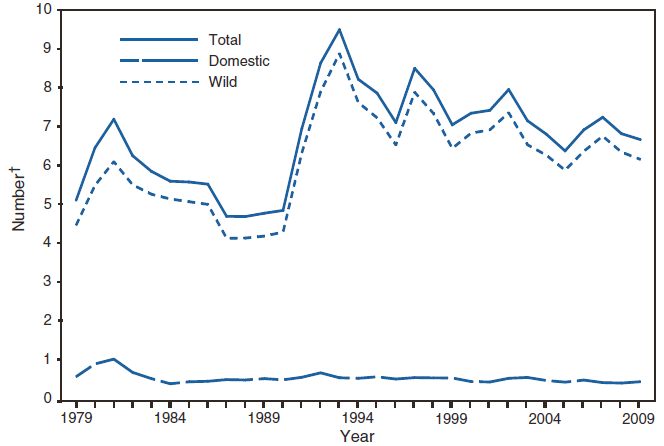
Rabies
During 2009, four cases of human rabies were reported in the United States: an abortive infection in Texas, an imported case from India in Virginia, and two indigenous cases attributed to bat rabies virus variants in Indiana and Michigan. The Texas abortive rabies case marks the first documented human rabies case in which clinical and serologic findings were indicative of rabies and no alternate etiology for the illness was determined despite an extensive investigation. The patient experienced a shorter clinical course, less severe neurologic abnormalities, less stimulation of the immune system, and recovered without extensive medical intervention (1).
During June 2009, evidence on the number of doses of rabies vaccine required for postexposure prophylaxis (PEP) was presented to the Advisory Committee on Immunization Practices, and a change in the PEP guidelines was approved.
The new guidelines recommended that immunocompetent persons not previously vaccinated against rabies should receive human rabies immune globulin (20 IU/kg; day 0) and 4 doses of rabies vaccine (1mL IM; days 0, 3, 7, and 14). Persons who are immunocompromised should continue to receive the 5-dose PEP protocol with serologic testing to confirm adequate response to the vaccine (2).
During 2009, the majority (92%) of 6,694 rabid animals reported in the United States were wildlife. Overall, a 2% decrease was reported compared with 2008. Cats remain the most commonly reported rabid domestic animal (59% of rabid domestic animals). Reports of rabid domestic animals remain low in part because of increased vaccination rates and the continued elimination of dog-to-dog rabies transmission. Canine rabies remains a serious concern in many developing countries and public health education should target travelers and health-care providers with messages regarding rabies prevention measures and the potential risk of rabies exposure in countries where the disease is endemic in domestic animals (3).
Blanton JD, Palmer D, Rupprecht CE. Rabies surveillance in the United States during 2009. J Am Vet Med Assoc. 2010; 237: (in press).
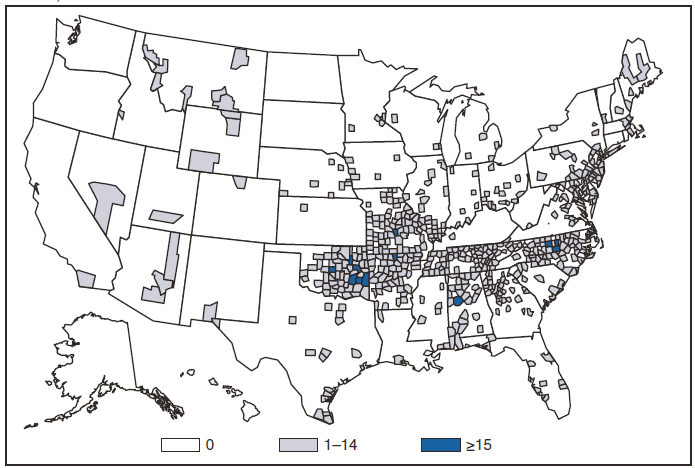
Rocky Mountain Spotted Fever
During 2009, RMSF cases decreased 29% from those reported in 2008. Cases reported in 2009 were distributed across the United States, reflecting the endemic status of Rocky Mountain spotted fever (RMSF) and the widespread ranges of the primary tick vectors (primarily Dermacentor variabilis and Dermacentor andersoni) responsible for transmission. RMSF cases associated with transmission by Rhipicephalus sanguineus, first reported in 2004 (1), continued to be reported from Arizona during 2009.
Although RMSF case reports increased more than 400% from 2000 through 2008 (495 to 2,563), case reporting in 2009 represented a decline of nearly 750 cases. This decrease might be the result of several factors, including ecological changes influencing vector tick populations and disease transmission, changes in diagnostic approaches that alter detection rates, or changes in surveillance and reporting. Because serologic tests commonly used to diagnose RMSF exhibit cross-reactivity between spotted fever rickettsial pathogens, some cases reported as RMSF during 2009 might actually have been caused by other spotted fever rickettsial infections.
L Demma, Traeger M, Nicholson W, et al. Rocky Mountain spotted fever from an unexpected tick vector in Arizona. New Engl J Med 2005;353:587--94.
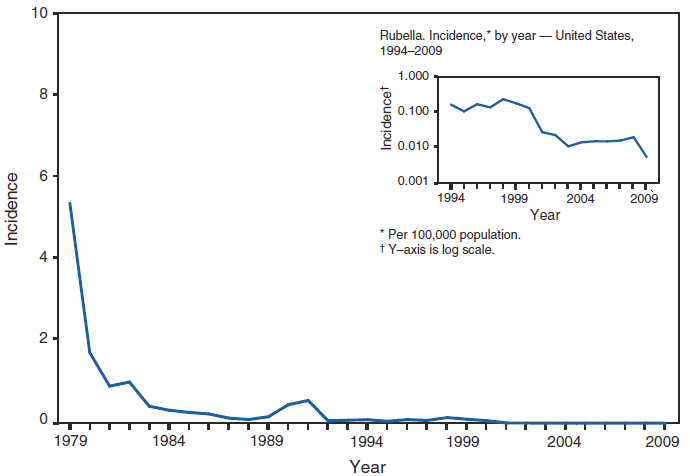
Rubella, Congenital Rubella Syndrome
Rubella virus infection usually results in mild disease, but if contracted during pregnancy can result in vertical transmission to the fetus, leading to a constellation of congenital birth defects known as congenital rubella syndrome (CRS). Although rubella is no longer endemic in the United States, it remains common in many parts of the world. The U.S. strategy for ensuring maintenance of rubella and CRS elimination includes (1) maintaining high vaccination rates among children; (2) ensuring vaccination among all women of childbearing age; (3) continuing surveillance of both rubella and CRS; and (4) responding rapidly to any outbreaks of rubella (1).
The CRS case definition requires the presence of compatible congenital anomalies and laboratory evidence of rubella infection in the first year of infancy. Birth defects most often associated with CRS include cataracts, heart defects, and deafness. For a CRS case to be classified as an international importation, the mother must have acquired rubella virus infection outside the United States, or, in the absence of documented rubella virus infection, the mother must have been out of the United States for a period covering 21 days before and 24 weeks after conception. Laboratory confirmation of CRS in infants requires either rubella virus isolation, rubella virus detection by real-time polymerase chain reaction (RT-PCR), detection of serum rubella IgM, or serum IgG levels that persist longer than expected from passive transfer of maternal IgG (i.e., rubella titer that does not drop at the expected rate of a twofold dilution per month) (1).
Two CRS cases were reported in the United States in 2009. Both infants were born during 2008 and officially reported to CDC after investigations of the cases were completed in 2009. The first case was in an infant born to a U.S. resident with a travel history to India and China during time of conception and early in her first trimester of pregnancy. The infant, with a syndrome clinically compatible with CRS, tested positive at birth for infection with rubella genotype 2B virus. The source of infection for the second CRS case reported in 2009 is unknown. This infant was born to a U.S. resident who reported no international travel during her pregnancy. The case was diagnosed by PCR testing at a commercial laboratory; however, specimens were not available for confirmation and genotyping at CDC. Neither an epidemiologic nor virologic link to an importation could be established (CDC, unpublished data).
Reef SE, Cochi SL. The evidence for the elimination of rubella and congenital rubella syndrome in the United States: a public health achievement. Clin Infect Dis 2006;43 (Suppl 3):S123−5.
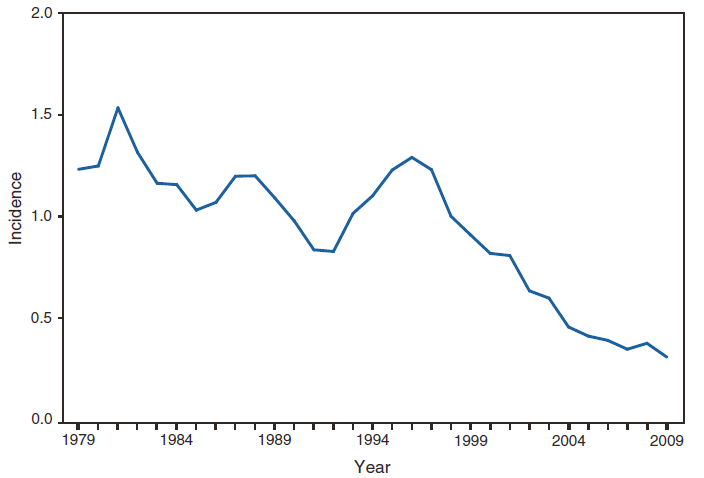
Syphilis, Primary and Secondary
In 2009, rates of primary and secondary syphilis increased for the eighth consecutive year, reaching the highest rate reported since 1995. Although increases have occurred mostly among men, in 2009 62% of cases from 44 states and the District of Columbia occurred in men who have sex with men. Increases also were observed among women during 2004--2008, mostly in the south. The overall rate in women declined slightly in 2009. In 2009, the primary and secondary syphilis rate among blacks was 9 times the rate among whites. During 2005--2009, syphilis rates increased 167% among black men aged 15-19 years and 212% among black men aged 20--24 years, the greatest increase observed in any age, sex, or racial/ethnic group. Among black women aged 15--24 years, rates more than doubled during 2005--2009 (1).
CDC. Sexually transmitted disease surveillance, 2009. Atlanta, GA: U.S. Department of Health and Human Services.
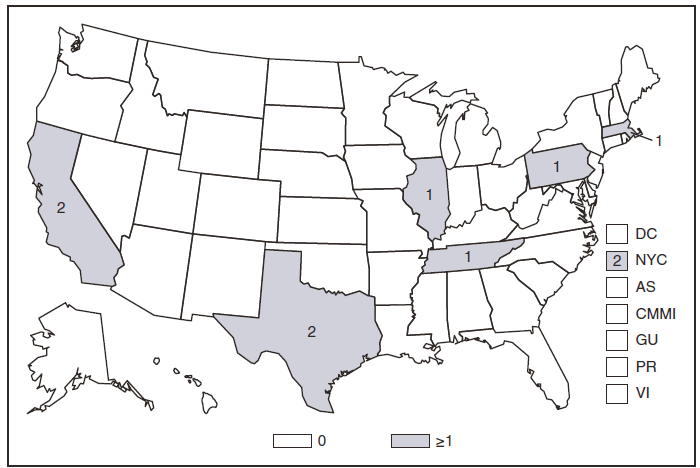
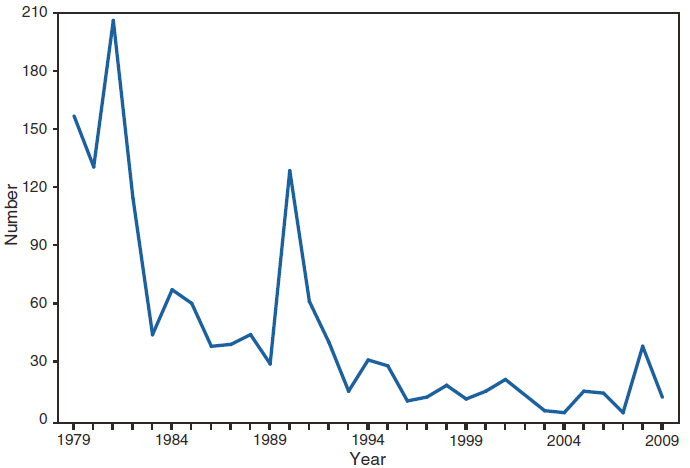
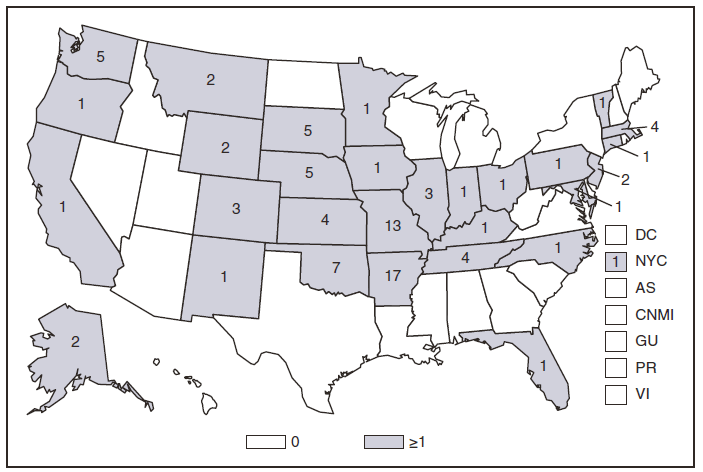
Trichinellosis
Of the 13 trichinellosis cases reported in 2009, five were associated with a shared meal that included a dish prepared with Trichinella-infected raw bear meat. One case-patient reported travelling to Southeast Asia and consuming raw pig's blood before the onset of illness. The implicated meat sources of five cases were pork (2), wild boar (2), and bear (1). Two cases of another disease were mistakenly reported as trichinellosis.
At least one outbreak associated with raw bear meat has been reported during 8 of the past 10 years (1-3). These results highlight the continued need for public health prevention messages aimed at persons who eat wild game meat, particularly bear, and for prevention messages targeted to cultural groups whose food choices might put them at a higher risk for Trichinella infection.
Proper cooking of meat dishes will prevent trichinellosis. Meat products, including sausages, ground meat, and other cuts of meat, should be cooked to internal temperatures of at least 160oF (4). Some species of Trichinella are resistant to freezing, so freezing might not be an effective prevention method.
In 1981, varicella was removed from the National Notifiable Diseases list. Because of high disease burden and lack of established national surveillance for varicella when the one-dose varicella vaccination program was implemented in 1995, active surveillance sites were created to monitor the effect of the varicella vaccination program. Data from the active surveillance sites have indicated a greater than 90% decline in cases during 1995--2005 (1).
In 2002, the Council of State and Territorial Epidemiologists recommended that states move to case-based reporting for varicella by 2005. In 2003, varicella was added back to the national notifiable diseases list. As of 2009, 36 states were conducting case-based reporting for varicella. National data on varicella incidence reported through the National Notifiable Diseases Surveillance Sytem (NNDSS) are consistent with data reported through the active surveillance sites and document a decline in cases even as the number of states reporting has increased. During 2006--2009, the number of varicella cases reported through NNDSS decreased by 58% whereas the number of states and territories reporting increased from 31 to 36.
As varicella incidence has decreased, monitoring of cases has become more feasible nationwide and thus, NNDSS will be able to replace the active surveillance sites as the primary national source of surveillance data for varicella. Further declines in varicella disease burden are expected with implementation in 2006 of the universal recommendation for two doses of varicella vaccine for children (2). Therefore, all states should be advised of the importance of conducting varicella case-based reporting.
Guris D, Jumaan AO, Mascola L, et al. Changing varicella epidemiology in active surveillance sites---United States, 1995--2005. J Infect Dis 2008;197 Suppl 2:S71--5.
Summaries of Notifiable Diseases in the United States, 2009
Abbreviations and Symbols Used in Tables
U Data not available.
N Not reportable (i.e., report of disease is not required in that jurisdiction).
--- No reported cases.
Notes: Rates <0.01 after rounding are listed as 0.
Data in the MMWR Summary of Notifiable Diseases --- United States, 2009 might not match data in other CDC surveillance reports because of differences in the timing of reports, the source of the data, and the use of different case definitions.
TABLE 1. Reported cases of notifiable diseases,* by month --- United States, 2009
Disease
Jan
Feb
Mar
Apr
May
Jun
Jul
Aug
Sept
Oct
Nov
Dec
Month not stated
Total
Anthrax
---
---
---
---
---
---
---
---
---
---
---
1
---
1
Arboviral diseases†
California serogroup virus
neuroinvasive
---
---
---
---
1
3
12
21
6
3
---
---
---
46
nonneuroinvasive
---
2
---
---
---
---
1
3
2
---
1
---
---
9
Eastern equine encephalitis virus
neuroinvasive
---
---
---
---
---
---
2
---
1
---
---
---
---
3
nonneuroinvasive
---
---
---
---
---
---
---
---
1
---
---
---
---
1
Powassan virus, neuroinvasive
1
---
---
1
---
2
---
1
---
---
1
---
---
6
St. Louis encephalitis virus
neuroinvasive
---
---
---
1
---
3
4
1
1
1
---
---
---
11
nonneuroinvasive
---
---
---
---
---
---
---
---
---
---
---
1
---
1
West Nile virus
neuroinvasive
---
---
---
---
3
11
59
182
111
18
---
1
1
386
nonneuroinvasive
---
---
---
1
4
8
57
174
74
16
---
---
---
334
Botulism, total
5
13
10
13
7
7
7
9
8
7
14
18
---
118
foodborne
1
3
---
1
2
---
1
1
---
---
---
1
---
10
infant
2
8
8
8
5
6
5
5
7
6
10
13
---
83
other (wound and unspecified)
2
2
2
4
---
1
1
3
1
1
4
4
---
25
Brucellosis
1
4
9
12
12
10
7
13
11
8
7
21
---
115
Chancroid§
---
2
6
4
---
2
---
1
---
1
4
8
---
28
Chlamydia trachomatis genitalinfection§
93,356
100,303
98,845
98,846
114,944
98,941
94,182
125,258
94,924
120,816
85,399
118,366
---
1,244,180
Cholera
1
---
---
1
---
1
4
---
1
1
---
1
---
10
Coccidioidomycosis
654
496
628
527
726
1,448
1,204
1,571
1,174
1,476
1,304
1,718
---
12,926
Cryptosporidiosis, total
328
311
353
442
602
551
791
1,320
982
883
484
607
---
7,654
confirmed
325
306
349
429
594
541
759
1,245
942
849
468
586
---
7,393
probable
3
5
4
13
8
10
32
75
40
34
16
21
---
261
Cyclosporiasis
31
9
1
5
9
23
18
20
9
3
8
5
---
141
Ehrlichiosis/Anaplasmosis
Ehrlichia chaffeensis
7
6
8
20
65
136
181
144
83
66
24
204
---
944
Ehrlichia ewingii
---
---
---
---
---
---
3
3
1
---
---
---
---
7
Anaplasma phagocytophilum
---
2
7
14
102
160
177
127
52
101
44
375
---
1,161
Undetermined
1
1
5
2
17
22
23
23
9
6
4
42
---
155
Giardiasis
1,078
1,215
1,256
1,328
1,468
1,273
1,754
2,294
1,970
2,117
1,505
2,141
---
19,399
Gonorrhea§
23,914
23,822
23,003
23,218
27,248
24,251
23,411
31,147
24,368
29,252
20,053
27,487
---
301,174
Haemophilus influenzae, invasive disease, all ages, serotypes
238
247
259
244
309
259
227
223
166
189
190
471
---
3,022
age <5 yrs
serotype b
3
3
9
2
2
2
3
2
4
4
---
4
---
38
nonserotype b
21
29
26
20
26
19
24
11
14
8
17
30
---
245
unknown serotype
15
14
15
7
22
12
7
10
5
11
11
37
---
166
Hansen disease (Leprosy)
5
12
9
6
8
12
7
12
3
11
14
4
---
103
Hantavirus pulmonary syndrome
---
---
2
---
4
2
3
1
2
1
---
5
---
20
Hemolytic uremic syndrome, post-diarrheal
6
6
15
12
24
24
22
25
23
28
17
40
---
242
Hepatitis, viral, acute
A
135
165
139
161
174
143
187
205
179
176
123
200
---
1,987
B
260
271
283
259
297
246
252
312
261
292
197
475
---
3,405
C
54
50
61
63
61
76
61
67
53
72
60
104
---
782
HIV diagnoses¶
3,746
3,810
4,136
3,996
3,354
3,764
3,543
3,191
2,969
2,583
1,493
279
6
36,870
Influenza-associated pediatric mortality**
3
18
22
13
11
17
13
14
17
80
108
42
---
358
Legionellosis
135
118
132
115
192
352
439
583
426
445
264
321
---
3,522
Listeriosis
67
40
41
41
61
47
93
113
93
90
58
107
---
851
Lyme disease, total
686
756
914
1,118
2,407
5,826
8,818
7,038
2,980
2,637
1,591
3,697
---
38,468
confirmed
488
555
650
744
1,772
4,917
7,421
5,579
2,194
1,985
1,104
2,550
---
29,959
probable
198
201
264
374
635
909
1,397
1,459
786
652
487
1,147
---
8,509
Malaria
89
80
72
77
124
101
147
228
126
131
87
189
---
1,451
Measles, total
2
2
7
11
16
12
9
5
1
3
---
3
---
71
indigenous
---
1
3
8
11
11
8
4
1
3
---
1
---
51
imported
2
1
4
3
5
1
1
1
---
---
---
2
---
20
Meningococcal disease, all serogroups
59
102
118
87
103
59
66
59
49
76
81
121
---
980
serogroup A,C,Y, and W-135
15
34
34
32
30
16
18
14
12
21
32
43
---
301
serogroup B
9
18
28
11
21
12
12
8
7
13
11
24
---
174
other serogroup
1
4
2
2
4
1
3
2
2
2
---
---
---
23
serogroup unknown
34
46
54
42
48
30
33
35
28
40
38
54
---
482
Mumps
27
24
37
40
42
24
32
45
75
137
282
1,226
---
1,991
Pertussis
956
856
912
1,177
1,425
1,342
1,627
1,981
1,333
1,316
1,021
2,912
---
16,858
Plague
---
---
---
---
2
2
2
1
1
---
---
---
---
8
Poliomyelitis, paralytic
---
---
---
---
---
---
---
---
---
---
---
1
---
1
TABLE 1. (Continued) Reported cases of notifiable diseases,* by month --- United States, 2009
* No cases of diphtheria; poliovirus infection, nonparalytic; Powassan virus disease, non-neuroinvasive; severe acute respiratory syndrome-associated coronavirus disease (SARS-CoV); smallpox; western equine encephalitis virus disease, neuroinvasive and non-neuroinvasive; and yellow fever were reported in 2009. Data on chronic hepatitis B and hepatitis C virus infection (past or present) are not included because they are undergoing data quality review. Data on human immunodeficiency virus (HIV) infections are not included because HIV infection reporting has been implemented on different dates and using different methods than for AIDS case reporting.
† Totals reported to the Division of Vector-Borne Infectious Diseases, National Center for Zoonotic, Vector-Borne, and Enteric Diseases (ArboNET Surveillance), as of May 28, 2010.
§ Totals reported to the Division of STD Prevention, National Center for HIV/AIDS, Viral Hepatitis, STD, and TB Prevention (NCHHSTP), as of May 7, 2010.
¶ Total number of HIV cases reported to the Division of HIV/AIDS Prevention, NCHHSTP through December 31, 2009.
** Totals reported to the Influenza Division, National Center for Immunization and Respiratory Diseases (NCIRD), as of December 31, 2009.
†† Includes the following categories: primary, secondary, latent (including early latent, late latent, and latent syphilis of unknown duration), neurosyphilis, late (including late syphilis with clinical manifestations other than neurosyphilis), and congenital syphilis.
§§ Totals reported to the Division of TB Elimination, NCHHSTP, as of May 14, 2010.
¶¶ Totals reported to the Division of Viral Diseases, NCIRD, as of June 30, 2010.
TABLE 2. Reported cases of notifiable diseases,* by geographic division and area --- United States, 2009
Area
Total resident population (in thousands)
Anthrax
United States
304,057
1
New England
14,303
1
Connecticut
3,501
---
Maine
1,316
---
Massachusetts
6,498
---
New Hampshire
1,316
1
Rhode Island
1,051
---
Vermont
621
---
Mid. Atlantic
40,622
---
New Jersey
8,683
---
New York (Upstate)
11,127
---
New York City
8,364
---
Pennsylvania
12,448
---
E.N. Central
46,396
---
Illinois
12,902
---
Indiana
6,377
---
Michigan
10,003
---
Ohio
11,486
---
Wisconsin
5,628
---
W.N. Central
20,165
---
Iowa
3,003
---
Kansas
2,802
---
Minnesota
5,220
---
Missouri
5,912
---
Nebraska
1,783
---
North Dakota
641
---
South Dakota
804
---
S. Atlantic
58,398
---
Delaware
873
---
District of Columbia
592
---
Florida
18,328
---
Georgia
9,686
---
Maryland
5,634
---
North Carolina
9,222
---
South Carolina
4,480
---
Virginia
7,769
---
West Virginia
1,814
---
E.S. Central
18,085
---
Alabama
4,662
---
Kentucky
4,269
---
Mississippi
2,939
---
Tennessee
6,215
---
W.S. Central
35,235
---
Arkansas
2,855
---
Louisiana
4,411
---
Oklahoma
3,642
---
Texas
24,327
---
Mountain
21,783
---
Arizona
6,500
---
Colorado
4,939
---
Idaho
1,524
---
Montana
967
---
Nevada
2,600
---
New Mexico
1,984
---
Utah
2,736
---
Wyoming
533
---
Pacific
49,070
---
Alaska
686
---
California
36,757
---
Hawaii
1,288
---
Oregon
3,790
---
Washington
6,549
---
Territories
American Samoa
65
---
C.N.M.I.
55
---
Guam
176
---
Puerto Rico
3,955
---
U.S. Virgin Islands
110
---
N: Not reportable. U: Unavailable. ---: No reported cases. C.N.M.I.: Commonwealth of Northern Mariana Islands.
* No cases of diphtheria; poliovirus infection, nonparalytic; Powassan virus disease, non-neuroinvasive; severe acute respiratory syndrome-associated coronavirus disease (SARS-CoV); smallpox; western equine encephalitis virus disease, neuroinvasive and non-neuroinvasive; and yellow fever were reported in 2009. Data on chronic hepatitis B and hepatitis C virus infection (past or present) are not included because they are undergoing data quality review. Data on human immunodeficiency virus (HIV) infections are not included because HIV infection reporting has been implemented on different dates and using different methods than for AIDS case reporting.
TABLE 2. (Continued) Reported cases of notifiable diseases,* by geographic division and area --- United States, 2009
Area
Arboviral diseases†
California serogroup virus
Eastern equine encephalitis virus
Powassan virus
St. Louis encephalitis virus
West Nile virus
Neuro- invasive
Nonneuro-invasive
Neuro- invasive
Nonneuro-invasive
Neuro- invasive
Neuro- invasive
Nonneuro- invasive
Neuro- invasive
Nonneuro- invasive
United States
46
9
3
1
6
11
1
386
334
New England
---
---
---
1
---
---
---
---
---
Connecticut
---
---
---
---
---
---
---
---
---
Maine
---
---
---
---
---
---
---
---
---
Massachusetts
---
---
---
---
---
---
---
---
---
New Hampshire
---
---
---
1
---
---
---
---
---
Rhode Island
---
---
---
---
---
---
---
---
---
Vermont
---
---
---
---
---
---
---
---
---
Mid. Atlantic
---
3
1
---
3
---
---
9
1
New Jersey
---
---
---
---
---
---
---
3
---
New York (Upstate)
---
3
1
---
3
---
---
3
1
New York City
---
---
---
---
---
---
---
3
---
Pennsylvania
---
---
---
---
---
---
---
---
---
E.N. Central
7
1
---
---
---
1
---
9
4
Illinois
---
1
---
---
---
---
---
5
---
Indiana
1
---
---
---
---
1
---
2
2
Michigan
---
---
---
---
---
---
---
1
---
Ohio
5
---
---
---
---
---
---
---
2
Wisconsin
1
---
---
---
---
---
---
1
---
W.N. Central
1
---
---
---
2
---
---
26
75
Iowa
---
---
---
---
---
---
---
---
5
Kansas
---
---
---
---
---
---
---
4
9
Minnesota
---
---
---
---
2
---
---
1
3
Missouri
1
---
---
---
---
---
---
4
1
Nebraska
---
---
---
---
---
---
---
11
41
North Dakota
---
---
---
---
---
---
---
---
1
South Dakota
---
---
---
---
---
---
---
6
15
S. Atlantic
28
5
1
---
1
---
---
16
2
Delaware
---
---
---
---
---
---
---
---
---
District of Columbia
---
---
---
---
---
---
---
2
---
Florida
---
---
---
---
---
---
---
2
1
Georgia
2
---
---
---
---
---
---
4
---
Maryland
---
---
---
---
---
---
---
---
1
North Carolina
16
---
1
---
---
---
---
---
---
South Carolina
---
---
---
---
---
---
---
3
---
Virginia
---
1
---
---
1
---
---
5
---
West Virginia
10
4
---
---
---
---
---
---
---
E.S. Central
9
---
---
---
---
2
---
38
27
Alabama
1
---
---
---
---
---
---
---
---
Kentucky
---
---
---
---
---
---
---
3
---
Mississippi
---
---
---
---
---
2
---
31
22
Tennessee
8
---
---
---
---
---
---
4
5
W.S. Central
---
---
1
---
---
7
1
117
35
Arkansas
---
---
---
---
---
4
---
6
---
Louisiana
---
---
1
---
---
---
---
10
11
Oklahoma
---
---
---
---
---
---
---
8
2
Texas
---
---
---
---
---
3
1
93
22
Mountain
1
---
---
---
---
---
---
77
123
Arizona
---
---
---
---
---
---
---
12
8
Colorado
---
---
---
---
---
---
---
36
67
Idaho
---
---
---
---
---
---
---
9
29
Montana
1
---
---
---
---
---
---
2
3
Nevada
---
---
---
---
---
---
---
7
5
New Mexico
---
---
---
---
---
---
---
6
2
Utah
---
---
---
---
---
---
---
1
1
Wyoming
---
---
---
---
---
---
---
4
8
Pacific
---
---
---
---
---
1
---
94
67
Alaska
---
---
---
---
---
---
---
---
---
California
---
---
---
---
---
---
---
67
45
Hawaii
---
---
---
---
---
---
---
---
---
Oregon
---
---
---
---
---
---
---
1
10
Washington
---
---
---
---
---
1
---
26
12
Territories
American Samoa
---
---
---
---
---
---
---
---
---
C.N.M.I.
---
---
---
---
---
---
---
---
---
Guam
---
---
---
---
---
---
---
---
---
Puerto Rico
---
---
---
---
---
---
---
---
---
U.S. Virgin Islands
---
---
---
---
---
---
---
---
---
N: Not reportable. U: Unavailable. ---: No reported cases. C.N.M.I.: Commonwealth of Northern Mariana Islands.
† Totals reported to the Division of Vector-Borne Infectious Diseases, National Center for Emerging and Zoonotic Infectious Diseases (ArboNET Surveillance), as of May 28, 2010.
TABLE 2. (Continued) Reported cases of notifiable diseases,* by geographic division and area --- United States, 2009
Area
Botulism
Total
Foodborne
Infant
Other§
Brucellosis
Chancroid¶
Chlamydia¶
United States
118
10
83
25
115
28
1,244,180
New England
---
---
---
---
1
3
40,776
Connecticut
---
---
---
---
---
---
12,127
Maine
---
---
---
---
---
---
2,431
Massachusetts
---
---
---
---
1
3
19,315
New Hampshire
---
---
---
---
---
---
2,102
Rhode Island
---
---
---
---
---
---
3,615
Vermont
---
---
---
---
---
---
1,186
Mid. Atlantic
22
---
22
---
4
---
159,111
New Jersey
11
---
11
---
1
---
23,974
New York (Upstate)
1
---
1
---
1
---
33,722
New York City
1
---
1
---
---
---
58,347
Pennsylvania
9
---
9
---
2
---
43,068
E.N. Central
7
1
5
1
23
7
197,133
Illinois
---
---
---
---
4
---
60,542
Indiana
---
---
---
---
4
1
21,732
Michigan
1
---
---
1
10
---
45,714
Ohio
5
1
4
---
4
---
48,239
Wisconsin
1
---
1
---
1
6
20,906
W.N. Central
4
1
3
---
5
---
70,396
Iowa
---
---
---
---
2
---
9,406
Kansas
1
---
1
---
---
---
10,510
Minnesota
---
---
---
---
---
---
14,197
Missouri
2
---
2
---
1
---
25,868
Nebraska
1
1
---
---
1
---
5,443
North Dakota
---
---
---
---
1
---
1,957
South Dakota
---
---
---
---
---
---
3,015
S. Atlantic
10
---
10
---
30
9
249,979
Delaware
2
---
2
---
---
---
4,718
District of Columbia
---
---
---
---
1
---
6,549
Florida
1
---
1
---
9
1
72,931
Georgia
---
---
---
---
10
---
39,828
Maryland
3
---
3
---
---
---
23,747
North Carolina
---
---
---
---
1
6
41,045
South Carolina
---
---
---
---
4
1
26,654
Virginia
4
---
4
---
5
1
30,903
West Virginia
---
---
---
---
---
---
3,604
E.S. Central
2
---
2
---
3
---
92,522
Alabama
1
---
1
---
3
---
25,929
Kentucky
---
---
---
---
---
---
13,293
Mississippi
---
---
---
---
---
---
23,589
Tennessee
1
---
1
---
---
---
29,711
W.S. Central
8
---
8
---
15
8
162,915
Arkansas
3
---
3
---
---
---
14,354
Louisiana
1
---
1
---
1
---
27,628
Oklahoma
---
---
---
---
2
---
15,023
Texas
4
---
4
---
12
8
105,910
Mountain
7
1
6
---
5
---
80,476
Arizona
3
---
3
---
3
---
26,002
Colorado
1
---
1
---
---
---
19,998
Idaho
---
---
---
---
---
---
3,842
Montana
---
---
---
---
---
---
2,988
Nevada
1
---
1
N
---
---
10,045
New Mexico
1
1
---
---
2
---
9,493
Utah
1
---
1
---
---
---
6,145
Wyoming
---
---
---
---
---
---
1,963
Pacific
58
7
27
24
29
1
190,872
Alaska
1
---
1
---
---
---
5,166
California
43
3
20
20
24
1
146,796
Hawaii
4
---
4
---
1
---
6,026
Oregon
---
---
---
---
3
---
11,497
Washington
10
4
2
4
1
---
21,387
Territories
American Samoa
---
---
---
---
---
---
---
C.N.M.I.
---
---
---
---
---
---
---
Guam
---
---
---
---
1
---
620
Puerto Rico
---
---
---
---
---
---
7,302
U.S. Virgin Islands
---
---
---
---
---
---
488
N: Not reportable. U: Unavailable. ---: No reported cases. C.N.M.I.: Commonwealth of Northern Mariana Islands.
§ Includes cases reported as wound and unspecified botulism.
¶ Totals reported to the Division of STD Prevention, NCHHSTP, as of May 7, 2010.
TABLE 2. (Continued) Reported cases of notifiable diseases,* by geographic division and area --- United States, 2009
Area
Cholera
Coccidioidomycosis
Cryptosporidiosis**
Cyclosporiasis
Total
Confirmed
Probable
United States
10
12,926
7,654
7,393
261
141
New England
1
1
470
458
12
26
Connecticut
---
N
38
38
---
18
Maine
---
N
67
55
12
N
Massachusetts
1
N
181
181
---
7
New Hampshire
---
1
83
83
---
1
Rhode Island
---
---
22
22
---
---
Vermont
---
N
79
79
---
N
Mid. Atlantic
3
---
821
820
1
39
New Jersey
---
N
53
53
---
8
New York (Upstate)
---
N
222
222
---
12
New York City
2
N
80
80
---
19
Pennsylvania
1
N
466
465
1
N
E.N. Central
1
38
1,727
1,716
11
9
Illinois
---
N
154
154
---
5
Indiana
1
N
288
284
4
1
Michigan
---
22
285
282
3
2
Ohio
---
16
388
384
4
---
Wisconsin
---
N
612
612
---
1
W.N. Central
---
11
1,162
1,124
38
2
Iowa
---
N
232
211
21
1
Kansas
---
N
104
104
---
---
Minnesota
---
---
347
347
---
1
Missouri
---
11
193
183
10
---
Nebraska
---
N
117
116
1
N
North Dakota
---
N
31
31
---
N
South Dakota
---
N
138
132
6
---
S. Atlantic
---
5
1,226
1,138
88
52
Delaware
---
1
12
12
---
---
District of Columbia
---
---
8
8
---
2
Florida
---
N
497
456
41
38
Georgia
---
N
336
336
---
6
Maryland
---
4
43
43
---
2
North Carolina
---
N
159
116
43
2
South Carolina
---
N
62
61
1
1
Virginia
---
N
86
86
---
1
West Virginia
---
N
23
20
3
---
E.S. Central
1
---
235
231
4
2
Alabama
---
N
68
68
---
N
Kentucky
---
N
67
67
---
N
Mississippi
---
N
19
19
---
N
Tennessee
1
N
81
77
4
2
W.S. Central
2
2
677
596
81
11
Arkansas
---
N
60
60
---
---
Louisiana
---
2
56
56
---
1
Oklahoma
---
N
142
128
14
---
Texas
2
N
419
352
67
10
Mountain
---
10,381
567
560
7
---
Arizona
---
10,233
34
34
---
---
Colorado
---
N
138
137
1
---
Idaho
---
N
98
97
1
N
Montana
---
N
57
57
---
N
Nevada
---
61
25
25
---
N
New Mexico
---
47
149
146
3
---
Utah
---
39
39
39
---
---
Wyoming
---
1
27
25
2
---
Pacific
2
2,488
769
750
19
---
Alaska
---
N
8
8
---
---
California
2
2,488
459
459
---
---
Hawaii
---
N
1
1
---
---
Oregon
---
N
199
185
14
---
Washington
---
N
102
97
5
---
Territories
American Samoa
---
N
N
---
---
N
C.N.M.I.
---
---
---
---
---
---
Guam
---
---
---
---
---
---
Puerto Rico
---
N
N
---
---
N
U.S. Virgin Islands
---
---
---
---
---
---
N: Not reportable. U: Unavailable. ---: No reported cases. C.N.M.I.: Commonwealth of Northern Mariana Islands.
** Revision of National Surveillance Case Definition and data display to distinguish between confirmed and probable cases.
TABLE 2. (Continued) Reported cases of notifiable diseases,* by geographic division and area --- United States, 2009
Area
Ehrlichiosis/Anaplasmosis
Giardiasis
Gonorrhea¶
Ehrlichia chaffeensis
Ehrlichia ewingii
Anaplasma phagocytophilum
Undetermined
United States
944
7
1,161
155
19,399
301,174
New England
23
---
189
2
1,757
5,162
Connecticut
---
---
22
---
290
2,558
Maine
1
---
15
---
223
143
Massachusetts
9
---
99
---
751
1,976
New Hampshire
4
---
18
2
197
113
Rhode Island
8
---
35
---
75
322
Vermont
1
---
N
---
221
50
Mid. Atlantic
196
---
322
27
3,520
31,904
New Jersey
102
---
70
---
430
4,762
New York (Upstate)
70
---
241
8
1,419
6,111
New York City
10
---
9
1
832
10,893
Pennsylvania
14
---
2
18
839
10,138
E.N. Central
84
1
283
55
2,917
62,690
Illinois
33
---
6
3
613
19,962
Indiana
---
---
---
21
312
6,835
Michigan
6
---
---
---
672
14,704
Ohio
12
1
1
---
806
15,988
Wisconsin
33
---
276
31
514
5,201
W.N. Central
160
5
323
51
1,971
14,825
Iowa
N
N
N
N
291
1,658
Kansas
6
---
1
---
161
2,505
Minnesota
8
---
317
38
674
2,303
Missouri
144
5
5
13
524
6,488
Nebraska
2
N
---
---
177
1,376
North Dakota
N
N
N
N
32
151
South Dakota
---
---
---
---
112
344
S. Atlantic
208
1
14
1
3,774
74,944
Delaware
22
---
2
---
29
971
District of Columbia
N
N
N
N
73
2,561
Florida
11
---
3
---
1,981
20,878
Georgia
18
---
1
---
747
13,687
Maryland
33
---
1
---
277
6,395
North Carolina
53
---
3
---
N
13,870
South Carolina
2
1
---
---
106
8,318
Virginia
68
---
4
---
503
7,789
West Virginia
1
---
---
1
58
475
E.S. Central
99
---
3
16
434
26,492
Alabama
8
---
2
N
204
7,498
Kentucky
12
---
---
N
N
3,827
Mississippi
6
---
---
---
N
7,241
Tennessee
73
---
1
16
230
7,926
W.S. Central
171
---
25
1
529
47,424
Arkansas
38
---
6
---
155
4,460
Louisiana
---
---
---
---
203
8,996
Oklahoma
129
---
17
---
171
4,673
Texas
4
---
2
1
N
29,295
Mountain
---
---
---
1
1,645
9,486
Arizona
---
---
---
1
198
3,250
Colorado
N
N
N
N
499
2,823
Idaho
N
N
N
N
208
110
Montana
N
N
N
N
133
80
Nevada
N
---
N
N
109
1,726
New Mexico
N
N
N
N
113
1,082
Utah
---
---
---
---
312
341
Wyoming
---
---
---
---
73
74
Pacific
3
---
2
1
2,852
28,247
Alaska
N
N
N
N
111
990
California
3
---
2
1
1,832
23,228
Hawaii
N
N
N
N
21
631
Oregon
---
---
---
---
421
1,113
Washington
N
N
N
N
467
2,285
Territories
American Samoa
N
N
N
N
---
---
C.N.M.I.
---
---
---
---
---
---
Guam
N
N
N
N
3
59
Puerto Rico
N
N
N
N
156
230
U.S. Virgin Islands
---
---
---
---
---
115
N: Not reportable. U: Unavailable. ---: No reported cases. C.N.M.I.: Commonwealth of Northern Mariana Islands.
TABLE 2. (Continued) Reported cases of notifiable diseases,* by geographic division and area --- United States, 2009
Area
Haemophilus influenzae, invasive disease
Hansen disease (leprosy)
Hantavirus pulmonary syndrome
Hemolytic uremic syndrome, postdiarrheal
All ages, serotypes
Age <5 yrs
Serotype b
Nonserotype b
Unknown serotype
United States
3,022
38
245
166
103
20
242
New England
216
3
10
3
9
---
17
Connecticut
64
---
3
---
1
N
10
Maine
21
2
2
1
N
---
2
Massachusetts
100
---
3
---
6
---
2
New Hampshire
14
---
---
---
---
---
1
Rhode Island
12
---
---
---
2
---
1
Vermont
5
1
2
2
N
---
1
Mid. Atlantic
601
13
22
34
5
---
20
New Jersey
132
---
---
11
1
---
3
New York (Upstate)
172
3
9
4
N
---
11
New York City
78
---
---
15
3
---
6
Pennsylvania
219
10
13
4
1
---
N
E.N. Central
468
3
31
27
4
---
31
Illinois
182
---
---
20
1
---
1
Indiana
84
2
7
1
---
---
---
Michigan
24
1
6
---
1
---
7
Ohio
101
---
18
2
2
---
14
Wisconsin
77
---
---
4
---
---
9
W.N. Central
192
1
10
16
---
2
42
Iowa
1
1
---
---
---
---
9
Kansas
14
---
---
---
---
---
2
Minnesota
79
---
10
2
---
1
17
Missouri
63
---
---
9
---
---
7
Nebraska
25
---
---
3
---
---
4
North Dakota
10
---
---
2
N
1
---
South Dakota
---
---
---
---
---
---
3
S. Atlantic
795
2
68
24
7
---
24
Delaware
5
---
---
1
---
---
---
District of Columbia
6
---
---
---
---
---
---
Florida
222
1
24
4
7
---
5
Georgia
162
1
18
5
---
---
5
Maryland
94
---
7
---
---
---
4
North Carolina
105
---
---
12
---
---
4
South Carolina
79
---
8
1
---
---
2
Virginia
88
---
8
1
---
---
2
West Virginia
34
---
3
---
N
---
2
E.S. Central
183
1
10
12
3
---
23
Alabama
43
---
1
---
---
N
6
Kentucky
21
---
---
6
---
---
N
Mississippi
8
---
---
2
2
---
---
Tennessee
111
1
9
4
1
---
17
W.S. Central
148
5
13
7
28
1
32
Arkansas
24
---
3
1
4
1
7
Louisiana
24
---
---
5
---
---
2
Oklahoma
93
2
10
1
N
---
17
Texas
7
3
---
---
24
---
6
Mountain
260
8
47
16
4
9
25
Arizona
84
1
17
1
---
1
2
Colorado
74
2
9
---
2
2
9
Idaho
5
---
---
2
---
---
3
Montana
2
1
---
---
---
---
2
Nevada
19
2
2
4
1
---
N
New Mexico
36
---
4
9
---
5
3
Utah
37
2
14
---
1
1
6
Wyoming
3
---
1
---
---
---
---
Pacific
159
2
34
27
43
8
28
Alaska
21
---
---
5
---
N
N
California
41
---
28
8
19
3
24
Hawaii
32
1
1
4
24
---
---
Oregon
56
---
---
7
N
2
4
Washington
9
1
5
3
N
3
---
Territories
American Samoa
---
---
---
---
---
N
N
C.N.M.I.
---
---
---
---
---
---
---
Guam
---
---
---
---
6
N
---
Puerto Rico
4
---
---
3
---
---
N
U.S. Virgin Islands
---
---
---
---
---
---
---
N: Not reportable. U: Unavailable. ---: No reported cases. C.N.M.I.: Commonwealth of Northern Mariana Islands.
TABLE 2. (Continued) Reported cases of notifiable diseases,* by geographic division and area --- United States, 2009
Area
Hepatitis, viral, acute
HIV†† diagnoses
Influenza-associated pediatric mortality§§
Legionellosis
Listeriosis
Lyme disease
Malaria
Total
Confirmed
Probable
A
B
C
United States
1,987
3,405
782
36,870
358
3,522
851
38,468
29,959
8,509
1,451
New England
108
54
66
805
10
203
77
12,440
9,030
3,410
62
Connecticut
18
16
53
308
1
55
26
4,156
2,751
1,405
7
Maine
1
15
2
48
---
10
4
970
791
179
2
Massachusetts
71
17
10
307
5
95
35
5,256
4,019
1,237
40
New Hampshire
7
6
N
38
1
15
2
1,415
996
419
4
Rhode Island
9
U
U
100
3
21
6
235
150
85
5
Vermont
2
---
1
4
---
7
4
408
323
85
4
Mid. Atlantic
275
328
99
6,339
34
1,196
205
16,346
13,682
2,664
413
New Jersey
71
93
7
908
6
218
45
4,973
4,598
375
103
New York (Upstate)
48
57
48
1,411
15
368
74
4,600
3,493
1,107
53
New York City
88
72
5
2,551
8
227
38
1,051
641
410
204
Pennsylvania
68
106
39
1,469
5
383
48
5,722
4,950
772
53
E.N. Central
284
436
92
3,564
40
723
119
2,969
2,281
688
173
Illinois
126
118
6
1,202
8
135
38
136
136
---
70
Indiana
17
74
22
425
5
62
9
83
61
22
25
Michigan
72
132
35
731
6
169
26
103
81
22
31
Ohio
36
88
26
914
15
282
30
58
51
7
37
Wisconsin
33
24
3
292
6
75
16
2,589
1,952
637
10
W.N. Central
126
154
33
1,230
20
135
25
1,693
1,176
517
84
Iowa
38
37
11
123
3
24
4
108
77
31
10
Kansas
12
6
1
136
2
7
1
18
18
---
8
Minnesota
29
38
15
358
9
28
3
1,543
1,063
480
43
Missouri
21
47
---
504
4
59
14
3
3
---
13
Nebraska
21
22
3
77
---
13
---
5
4
1
8
North Dakota
2
---
2
12
---
2
2
15
10
5
1
South Dakota
3
4
1
20
2
2
1
1
1
---
1
S. Atlantic
429
913
174
11,953
54
605
142
4,466
3,507
959
367
Delaware
4
34
U
144
2
19
7
984
984
---
5
District of Columbia
1
10
1
556
---
24
1
61
53
8
17
Florida
171
299
53
5,401
12
193
25
110
77
33
93
Georgia
54
144
31
1,606
8
60
30
40
40
---
68
Maryland
47
72
23
1,057
5
157
14
2,024
1,466
558
80
North Carolina
41
104
24
1,521
10
62
27
96
21
75
32
South Carolina
63
56
1
727
6
13
12
42
25
17
7
Virginia
42
110
10
869
8
67
16
908
698
210
61
West Virginia
6
84
31
72
3
10
10
201
143
58
4
E.S. Central
46
348
107
2,334
25
142
40
41
14
27
35
Alabama
12
89
10
594
2
20
14
3
3
---
9
Kentucky
12
90
64
289
5
52
7
1
1
---
13
Mississippi
9
33
U
549
4
4
5
---
---
---
4
Tennessee
13
136
33
902
14
66
14
37
10
27
9
W.S. Central
209
680
74
4,594
71
151
59
278
90
188
102
Arkansas
12
65
2
133
4
8
8
---
---
---
5
Louisiana
6
73
9
1,223
7
18
16
---
---
---
8
Oklahoma
7
122
27
123
10
10
8
2
2
---
2
Texas
184
420
36
3,115
50
115
27
276
88
188
87
Mountain
163
132
53
1,553
56
151
31
57
28
29
48
Arizona
68
42
U
540
24
49
8
7
3
4
10
Colorado
52
27
28
348
14
31
9
1
---
1
26
Idaho
5
11
7
32
1
8
3
16
4
12
3
Montana
6
1
1
27
1
8
---
3
3
---
5
Nevada
15
34
5
333
2
14
3
13
10
3
---
New Mexico
8
8
6
148
9
9
3
5
1
4
---
Utah
7
5
6
107
5
28
2
9
6
3
4
Wyoming
2
4
---
18
---
4
3
3
1
2
---
Pacific
347
360
84
4,498
48
216
153
178
151
27
167
Alaska
2
4
U
18
1
1
---
7
7
---
2
California
273
258
43
3,776
36
167
106
117
117
---
126
Hawaii
11
6
U
34
1
1
4
N
N
N
1
Oregon
19
44
19
203
4
18
19
38
12
26
12
Washington
42
48
22
467
6
29
24
16
15
1
26
Territories
American Samoa
---
---
---
---
---
---
---
N
N
N
---
C.N.M.I.
---
---
---
1
---
---
---
---
---
---
---
Guam
7
57
49
3
1
---
---
---
---
---
---
Puerto Rico
21
34
---
474
---
3
2
N
N
N
5
U.S. Virgin Islands
---
---
---
18
---
---
---
---
---
---
---
N: Not reportable. U: Unavailable. ---: No reported cases. C.N.M.I.: Commonwealth of Northern Mariana Islands.
†† Total number of HIV diagnoses reported to the Division of HIV/AIDS Prevention, National Center for HIV/AIDS, Viral Hepatitis, STD, and TB Prevention (NCHHSTP) through December 31, 2009.
§§ Totals reported to the Division of Influenza, National Center for Immunization and Respiratory Diseases (NCIRD), as of December 31, 2009.
TABLE 2. (Continued) Reported cases of notifiable diseases,* by geographic division and area --- United States, 2009
Area
Measles
Meningococcal disease
All serogroups
Serogroup A, C, Y, and W-135
Serogroup B
Other serogroup
Unknown serogroup
Mumps
Total
Indigenous
Imported¶¶
United States
71
51
20
980
301
174
23
482
1,991
New England
2
1
1
35
19
6
4
6
27
Connecticut
---
---
---
7
4
1
---
2
1
Maine
---
---
---
4
2
---
2
---
6
Massachusetts
2
1
1
16
9
5
---
2
15
New Hampshire
---
---
---
3
1
---
---
2
---
Rhode Island
---
---
---
4
3
---
1
---
3
Vermont
---
---
---
1
---
---
1
---
2
Mid. Atlantic
34
29
5
110
25
32
---
53
1,668
New Jersey
2
2
---
19
---
---
---
19
200
New York (Upstate)
---
---
---
27
12
9
---
6
647
New York City
18
15
3
17
---
---
---
17
806
Pennsylvania
14
12
2
47
13
23
---
11
15
E.N. Central
1
1
---
169
54
43
2
70
75
Illinois
---
---
---
47
---
---
---
47
47
Indiana
---
---
---
34
17
15
2
---
2
Michigan
---
---
---
21
11
5
---
5
11
Ohio
1
1
---
43
14
13
---
16
6
Wisconsin
---
---
---
24
12
10
---
2
9
W.N. Central
8
8
---
90
19
11
2
58
53
Iowa
1
1
---
15
9
4
2
---
15
Kansas
---
---
---
14
---
---
---
14
7
Minnesota
1
1
---
16
7
6
---
3
7
Missouri
6
6
---
27
---
---
---
27
15
Nebraska
---
---
---
11
1
1
---
9
7
North Dakota
---
---
---
2
2
---
---
---
---
South Dakota
---
---
---
5
---
---
---
5
2
S. Atlantic
14
6
8
165
76
38
5
46
45
Delaware
---
---
---
2
---
---
---
2
1
District of Columbia
2
---
2
---
---
---
---
---
2
Florida
5
---
5
52
33
12
---
7
18
Georgia
1
1
---
31
19
6
2
4
---
Maryland
4
3
1
12
6
6
---
---
8
North Carolina
---
---
---
31
7
1
2
21
4
South Carolina
---
---
---
11
4
7
---
---
2
Virginia
1
1
---
18
4
2
---
12
9
West Virginia
1
1
---
8
3
4
1
---
1
E.S. Central
1
---
1
37
9
4
1
23
13
Alabama
---
---
---
12
4
4
1
3
6
Kentucky
---
---
---
6
---
---
---
6
1
Mississippi
---
---
---
4
1
---
---
3
1
Tennessee
1
---
1
15
4
---
---
11
5
W.S. Central
1
---
1
96
41
19
2
34
48
Arkansas
---
---
---
9
6
1
---
2
4
Louisiana
---
---
---
18
---
---
---
18
1
Oklahoma
---
---
---
16
6
7
2
1
3
Texas
1
---
1
53
29
11
---
13
40
Mountain
---
---
---
68
47
8
6
7
27
Arizona
---
---
---
15
9
1
4
1
10
Colorado
---
---
---
24
19
4
1
---
6
Idaho
---
---
---
7
4
---
---
3
3
Montana
---
---
---
5
4
1
---
---
---
Nevada
---
---
---
6
5
---
---
1
3
New Mexico
---
---
---
3
3
---
---
---
1
Utah
---
---
---
3
2
1
---
---
4
Wyoming
---
---
---
5
1
1
1
2
---
Pacific
10
6
4
210
11
13
1
185
35
Alaska
---
---
---
6
---
---
---
6
6
California
9
6
3
131
---
---
---
131
16
Hawaii
---
---
---
5
1
---
1
3
5
Oregon
---
---
---
43
---
---
---
43
2
Washington
1
---
1
25
10
13
---
2
6
Territories
American Samoa
---
---
---
---
---
---
---
---
---
C.N.M.I.
---
---
---
---
---
---
---
---
---
Guam
---
---
---
---
---
---
---
---
---
Puerto Rico
---
---
---
1
---
---
---
1
6
U.S. Virgin Islands
---
---
---
---
---
---
---
---
---
N: Not reportable. U: Unavailable. ---: No reported cases. C.N.M.I.: Commonwealth of Northern Mariana Islands.
¶¶ Imported cases include only those directly related to importation from other countries.
TABLE 2. (Continued) Reported cases of notifiable diseases,* by geographic division and area --- United States, 2009
Novel influenza A virus infections***, †††
Poliomyelitis, paralytic
Q Fever
Rabies
Area
Pertussis
Plague
Psittacosis
Total
Acute
Chronic
Animal
Human
United States
43,696
16,858
8
1
9
113
93
20
5,343
4
New England
3,726
626
---
---
---
1
1
---
354
---
Connecticut
1,713
56
---
---
N
---
---
---
153
---
Maine
145
80
---
---
---
---
---
---
56
---
Massachusetts
1,370
358
---
---
---
1
1
---
---
---
New Hampshire
247
76
---
---
---
N
N
N
34
---
Rhode Island
192
45
---
---
---
---
---
---
45
---
Vermont
59
11
---
---
---
N
N
N
66
---
Mid. Atlantic
6,112
1,222
---
---
5
15
12
3
852
---
New Jersey
1,414
244
---
---
2
2
1
1
287
---
New York (Upstate)
1,424
265
---
---
---
2
---
2
436
---
New York City
1,314
98
---
---
---
1
1
---
29
---
Pennsylvania
1,960
615
---
---
3
10
10
---
100
---
E.N. Central
10,620
3,206
1
---
---
9
9
---
220
2
Illinois
3,404
648
1
---
---
---
---
---
82
---
Indiana
291
392
---
---
---
1
1
---
25
1
Michigan
515
900
---
---
---
1
1
---
66
1
Ohio
188
1,096
---
---
---
---
---
---
47
---
Wisconsin
6,222
170
---
---
---
7
7
---
N
---
W.N. Central
1,539
2,840
---
1
---
20
16
4
391
---
Iowa
167
235
---
---
---
N
N
N
35
---
Kansas
205
240
---
---
---
2
2
---
76
---
Minnesota
670
1,121
---
1
---
2
2
---
69
---
Missouri
76
1,015
---
---
---
3
3
---
65
---
Nebraska
313
141
---
---
---
4
2
2
77
---
North Dakota
63
30
---
---
---
---
---
---
16
---
South Dakota
45
58
---
---
---
9
7
2
53
---
S. Atlantic
5,626
1,632
---
---
1
7
6
1
2,103
1
Delaware
381
13
---
---
---
1
1
---
---
---
District of Columbia
45
7
---
---
---
1
1
---
---
---
Florida
2,915
497
---
---
---
1
1
---
161
---
Georgia
222
223
---
---
---
1
1
---
405
---
Maryland
766
148
---
---
---
---
---
---
384
---
North Carolina
483
220
---
---
---
1
1
---
468
---
South Carolina
244
262
---
---
1
---
---
---
---
---
Virginia
327
222
---
---
---
1
1
---
566
1
West Virginia
243
40
---
---
---
1
---
1
119
---
E.S. Central
1,155
803
---
---
---
3
1
2
138
---
Alabama
477
305
N
---
---
1
1
---
---
---
Kentucky
143
226
---
---
---
2
---
2
46
---
Mississippi
252
75
---
---
---
---
---
---
4
---
Tennessee
283
197
---
---
---
---
---
---
88
---
W.S. Central
5,703
3,993
---
---
---
17
10
7
925
1
Arkansas
131
369
---
---
---
2
2
---
47
---
Louisiana
232
149
---
---
---
---
---
---
---
---
Oklahoma
189
117
---
---
---
2
---
2
48
---
Texas
5,151
3,358
---
---
N
13
8
5
830
1
Mountain
3,176
1,019
7
---
---
18
15
3
108
---
Arizona
947
277
---
---
---
4
4
---
N
---
Colorado
171
231
---
---
---
9
7
2
---
---
Idaho
166
99
---
---
---
---
---
---
8
---
Montana
94
61
---
---
---
---
---
---
25
---
Nevada
467
24
---
---
---
1
1
---
6
---
New Mexico
232
85
6
---
---
4
3
1
26
---
Utah
988
220
1
---
---
---
---
---
13
---
Wyoming
111
22
---
---
---
---
---
---
30
---
Pacific
6,039
1,517
---
---
3
23
23
---
252
---
Alaska
272
59
---
---
---
1
1
---
15
---
California
3,161
869
---
---
3
20
20
---
226
---
Hawaii
1,424
46
---
---
---
1
1
---
---
---
Oregon
524
252
---
---
---
---
---
---
11
---
Washington
658
291
---
---
---
1
1
---
---
---
Territories
American Samoa
8
---
---
---
N
N
---
N
N
N
C.N.M.I.
---
---
---
---
---
---
---
---
---
---
Guam
1
2
---
---
---
N
---
N
---
---
Puerto Rico
20
1
---
---
N
---
---
---
41
---
U.S. Virgin Islands
49
---
---
---
---
---
---
---
---
---
N: Not reportable. U: Unavailable. ---: No reported cases. C.N.M.I.: Commonwealth of Northern Mariana Islands.
*** Totals reported to the Division of Influenza, National Center for Immunization and Respiratory Diseases (NCIRD). After recognition of the first cases of infection with 2009 pandemic influenza A (H1N1) virus in April 2009, the Centers for Disease Control and Prevention (CDC) and state health departments initiated enhanced surveillance to identify additional cases. From April 15 to July 24, 2009, state and territorial health departments were requested to submit a daily line list of individual confirmed cases of 2009 pandemic influenza A (H1N1) virus infections directly to the Influenza Division at CDC. As of July 24, 2009, a total of 43,771 cases were reported from all 50 states, Washington DC, and four territories. This table reflects cases reported by this method.
††† In addition, three cases of human infection with novel influenza A viruses, different from the 2009 pandemic influenza A (H1N1) strain, were identified by state health departments and reported to CDC during 2009. These three cases, identified in Iowa [2] and Kansas, were isolated cases of human infections and one virus was identified as a swine influenza A (H1N1) virus, and the remaining two cases were swine-lineage influenza A (H3N2) viruses." This total case count includes both confirmed and probable case reports.
TABLE 2. (Continued) Reported cases of notifiable diseases,* by geographic division and area --- United States, 2009
Area
Rocky Mountain spotted fever§§§
Rubella
Rubella, congenital syndrome
Salmonellosis
Shiga toxin-producing E. Coli (STEC)¶¶¶
Shigellosis
Total
Confirmed
Probable
United States
1,815
151
1,662
3
2
49,192
4,643
15,931
New England
14
2
12
1
---
2,174
292
346
Connecticut
---
---
---
---
---
430
67
43
Maine
5
---
5
---
---
121
19
5
Massachusetts
7
1
6
1
---
1,155
106
245
New Hampshire
1
---
1
---
---
261
37
21
Rhode Island
---
---
---
---
---
144
38
27
Vermont
1
1
---
---
---
63
25
5
Mid. Atlantic
110
13
97
---
1
5,514
435
2,800
New Jersey
63
2
61
---
1
1,132
106
587
New York (Upstate)
16
1
15
---
---
1,370
158
241
New York City
8
1
7
---
---
1,253
57
447
Pennsylvania
23
9
14
---
---
1,759
114
1,525
E.N. Central
90
9
81
---
---
5,169
717
2,514
Illinois
49
1
48
---
---
1,484
166
620
Indiana
13
3
10
---
---
629
96
80
Michigan
5
4
1
---
---
960
140
219
Ohio
18
---
18
---
---
1,407
133
1,096
Wisconsin
5
1
4
---
---
689
182
499
W.N. Central
276
20
256
1
---
2,679
751
1,439
Iowa
5
1
4
---
---
408
163
53
Kansas
1
1
---
---
---
398
54
214
Minnesota
5
3
2
1
---
575
219
79
Missouri
253
7
246
---
---
656
143
1,046
Nebraska
12
8
4
---
---
341
86
34
North Dakota
---
---
---
---
---
103
15
9
South Dakota
---
---
---
---
---
198
71
4
S. Atlantic
451
68
383
---
---
14,478
691
2,365
Delaware
19
---
19
---
---
142
13
151
District of Columbia
1
---
1
---
---
100
3
28
Florida
10
2
8
---
---
6,741
177
461
Georgia
52
52
---
---
---
2,362
71
661
Maryland
40
3
37
---
---
803
91
370
North Carolina
255
7
248
---
---
1,810
112
359
South Carolina
19
3
16
---
---
1,195
33
126
Virginia
53
1
52
---
---
1,095
156
198
West Virginia
2
---
2
---
---
230
35
11
E.S. Central
268
9
257
---
---
3,077
215
813
Alabama
68
3
65
---
---
932
47
156
Kentucky
1
1
---
---
---
453
73
226
Mississippi
9
---
9
---
---
899
6
52
Tennessee
190
5
183
---
---
793
89
379
W.S. Central
564
12
552
---
---
6,411
378
3,188
Arkansas
184
1
183
---
---
615
44
318
Louisiana
2
---
2
---
---
1,180
23
177
Oklahoma
342
9
333
---
---
652
64
398
Texas
36
2
34
---
---
3,964
247
2,295
Mountain
41
17
24
---
---
3,028
561
1,138
Arizona
23
11
12
---
---
1,086
68
806
Colorado
1
1
---
---
---
619
168
102
Idaho
1
---
1
---
---
174
92
8
Montana
10
4
6
---
---
110
35
11
Nevada
1
---
1
---
---
252
35
79
New Mexico
1
---
1
---
---
369
38
104
Utah
1
---
1
---
---
321
110
24
Wyoming
3
1
2
---
---
97
15
4
Pacific
1
1
---
1
1
6,662
603
1,328
Alaska
N
---
---
---
N
68
1
4
California
1
1
---
1
1
5,003
301
1,066
Hawaii
N
---
---
---
---
338
11
49
Oregon
---
---
---
---
---
433
84
56
Washington
---
---
---
---
---
820
206
153
Territories
American Samoa
N
---
---
---
---
---
---
3
C.N.M.I.
---
---
---
---
---
---
---
---
Guam
N
---
---
---
---
11
---
13
Puerto Rico
N
---
---
1
N
596
---
15
U.S. Virgin Islands
---
---
---
---
---
---
---
---
N: Not reportable. U: Unavailable. ---: No reported cases. C.N.M.I.: Commonwealth of Northern Mariana Islands.
§§§ Total case count includes 2 unknown case status reports.
¶¶¶ Includes E. coli O157; Shiga toxin-positive, non-O157 STEC; and Shiga toxin positive, not serogrouped.
TABLE 2. (Continued) Reported cases of notifiable diseases,* by geographic division and area --- United States, 2009
Area
Streptococcal disease, invasive, group A
Streptococcal toxic-shock syndrome
Streptococcus pneumoniae, invasive disease
Syphilis¶
All stages****
Congenital (age <1 yr)
Primary and secondary
Drug-resistant
Nondrug-resistant
All ages
Age <5 yrs
Age <5 yrs
United States
5,279
161
3,370
583
1,988
44,828
427
13,997
New England
316
29
158
22
96
769
3
341
Connecticut
89
22
100
18
20
179
2
65
Maine
21
N
23
2
7
15
---
4
Massachusetts
135
2
4
2
50
473
---
238
New Hampshire
38
2
---
---
11
37
---
14
Rhode Island
14
1
18
---
4
64
1
20
Vermont
19
2
13
---
4
1
---
---
Mid. Atlantic
1,026
32
207
42
306
6,540
26
1,735
New Jersey
163
3
---
---
70
890
7
212
New York (Upstate)
337
24
97
18
139
702
5
128
New York City
193
---
16
9
97
3,921
10
1,054
Pennsylvania
333
5
94
15
N
1,027
4
341
E.N. Central
942
57
690
101
324
3,834
28
1,542
Illinois
282
23
N
N
74
1,915
16
750
Indiana
167
23
251
33
49
324
1
158
Michigan
158
---
27
4
79
635
4
230
Ohio
209
11
412
64
78
794
7
360
Wisconsin
126
---
---
---
44
166
---
44
W.N. Central
414
9
366
79
115
1,010
11
308
Iowa
---
---
---
---
---
65
---
23
Kansas
39
---
52
18
N
151
3
32
Minnesota
189
7
227
53
45
217
1
71
Missouri
93
2
74
6
39
514
6
173
Nebraska
46
---
2
---
17
45
---
5
North Dakota
18
---
7
---
5
8
1
4
South Dakota
29
N
4
2
9
10
---
---
S. Atlantic
1,132
18
1,419
245
371
10,909
79
3,507
Delaware
11
---
18
3
---
87
1
27
District of Columbia
14
---
27
3
4
431
---
163
Florida
279
N
779
143
66
3,863
21
1,041
Georgia
238
---
460
87
98
2,717
14
953
Maryland
188
1
4
---
87
993
31
314
North Carolina
107
4
N
N
N
1,524
10
579
South Carolina
81
---
---
---
53
507
---
123
Virginia
173
1
N
N
47
755
2
299
West Virginia
41
12
131
9
16
32
---
8
E.S. Central
204
1
278
40
113
3,439
36
1,149
Alabama
N
N
N
N
N
1,138
13
417
Kentucky
40
1
78
8
N
239
2
92
Mississippi
N
N
55
12
16
745
8
237
Tennessee
164
---
145
20
97
1,317
13
403
W.S. Central
530
---
131
27
354
9,785
149
2,757
Arkansas
22
---
60
13
29
552
10
275
Louisiana
27
---
71
14
19
1,964
11
741
Oklahoma
155
N
N
N
61
296
2
97
Texas
326
N
N
N
245
6,973
126
1,644
Mountain
512
15
118
25
281
1,965
32
529
Arizona
161
---
---
---
128
1,084
28
231
Colorado
127
---
---
---
53
269
---
105
Idaho
10
---
N
N
9
31
1
3
Montana
N
N
---
---
N
5
---
4
Nevada
6
2
43
7
---
306
3
91
New Mexico
122
1
---
---
38
208
---
61
Utah
85
12
63
16
52
55
---
31
Wyoming
1
---
12
2
1
7
---
3
Pacific
203
---
3
2
28
6,577
63
2,129
Alaska
38
---
---
---
20
4
---
---
California
N
N
N
N
N
6,031
61
1,900
Hawaii
165
---
3
2
8
88
1
33
Oregon
N
N
N
N
N
132
---
57
Washington
N
N
N
N
N
322
1
139
Territories
American Samoa
---
N
---
---
---
---
---
---
C.N.M.I.
---
---
---
---
---
---
---
---
Guam
---
---
---
---
---
12
---
2
Puerto Rico
N
N
---
---
N
724
5
227
U.S. Virgin Islands
---
---
---
---
---
2
---
---
N: Not reportable. U: Unavailable. ---: No reported cases. C.N.M.I.: Commonwealth of Northern Mariana Islands.
**** Includes the following categories: primary, secondary, latent (including early latent, late latent, and latent syphilis of unknown duration), neurosyphilis, late (including late syphilis with clinical manifestations other than neurosyphilis), and congenital syphilis.
TABLE 2. (Continued) Reported cases of notifiable diseases,* by geographic division and area --- United States, 2009
Area
Tetanus
Toxic-shock syndrome
Trichinellosis
Tuberculosis††††
Tularemia
Typhoid fever
United States
18
74
13
11,545
93
397
New England
---
1
---
394
6
17
Connecticut
---
N
---
95
1
5
Maine
---
N
---
9
---
---
Massachusetts
---
---
---
243
4
10
New Hampshire
---
---
---
16
---
1
Rhode Island
---
1
---
24
---
1
Vermont
---
---
---
7
1
---
Mid. Atlantic
2
12
1
1,647
4
110
New Jersey
---
3
---
405
2
35
New York (Upstate)
---
2
---
246
---
10
New York City
---
3
1
760
1
53
Pennsylvania
2
4
---
236
1
12
E.N. Central
4
11
1
928
5
47
Illinois
---
1
---
418
3
15
Indiana
2
1
---
119
1
1
Michigan
---
6
1
144
---
11
Ohio
2
2
---
180
1
12
Wisconsin
---
1
---
67
---
8
W.N. Central
3
11
---
402
29
14
Iowa
---
2
---
42
1
---
Kansas
---
1
---
64
4
---
Minnesota
---
1
---
161
1
5
Missouri
2
4
---
80
13
7
Nebraska
1
3
---
32
5
---
North Dakota
---
---
---
5
---
---
South Dakota
---
---
---
18
5
2
S. Atlantic
---
6
---
2,221
3
67
Delaware
---
---
---
19
---
2
District of Columbia
---
---
---
41
---
2
Florida
---
N
---
821
1
19
Georgia
---
6
N
415
---
11
Maryland
---
N
---
218
1
16
North Carolina
---
---
---
251
1
5
South Carolina
---
---
---
164
---
---
Virginia
---
---
---
273
---
12
West Virginia
---
---
---
19
---
---
E.S. Central
1
6
---
569
5
4
Alabama
1
---
---
168
---
---
Kentucky
---
1
N
77
1
---
Mississippi
---
N
---
122
---
1
Tennessee
---
5
---
202
4
3
W.S. Central
1
3
---
1,879
24
25
Arkansas
---
3
N
82
17
---
Louisiana
---
---
---
194
---
---
Oklahoma
---
N
---
102
7
2
Texas
1
N
---
1,501
---
23
Mountain
2
3
2
536
8
12
Arizona
---
1
---
232
---
2
Colorado
---
1
2
85
3
6
Idaho
---
---
---
18
---
1
Montana
---
N
---
8
2
---
Nevada
1
1
---
106
---
3
New Mexico
---
---
---
48
1
---
Utah
1
---
---
37
---
---
Wyoming
---
---
---
2
2
---
Pacific
5
21
9
2,969
9
101
Alaska
---
N
1
37
2
1
California
5
21
8
2,470
1
90
Hawaii
---
N
---
117
---
5
Oregon
---
N
---
89
1
1
Washington
---
N
---
256
5
4
Territories
American Samoa
---
N
N
4
---
1
C.N.M.I.
---
---
---
32
---
---
Guam
---
---
---
102
---
---
Puerto Rico
2
N
N
63
---
---
U.S. Virgin Islands
---
---
---
---
---
---
N: Not reportable. U: Unavailable. ---: No reported cases. C.N.M.I.: Commonwealth of Northern Mariana Islands.
†††† Totals reported to the Division of Tuberculosis Elimination, NCHHSTP, as of May 14, 2010.
TABLE 2. (Continued) Reported cases of notifiable diseases,* by geographic division and area --- United States, 2009
Area
Vancomycin-intermediate Staphylococcus aureus
Vancomycin-resistant Staphylococcus aureus
Varicella
Vibriosis
Morbidity
Mortality§§§§
United States
78
1
20,480
2
789
New England
8
---
1,096
---
41
Connecticut
2
---
486
---
27
Maine
---
---
235
---
4
Massachusetts
6
---
4
---
---
New Hampshire
N
---
202
---
6
Rhode Island
---
---
57
---
2
Vermont
---
---
112
---
2
Mid. Atlantic
30
---
2,052
---
52
New Jersey
1
---
470
---
32
New York (Upstate)
11
---
N
N
N
New York City
16
---
---
---
20
Pennsylvania
2
---
1,582
---
N
E.N. Central
12
1
6,415
1
30
Illinois
---
---
1,582
---
13
Indiana
N
---
457
1
3
Michigan
4
1
1,888
---
2
Ohio
5
---
1,911
N
6
Wisconsin
3
---
577
---
6
W.N. Central
11
---
1,272
---
9
Iowa
---
---
N
N
N
Kansas
N
N
554
---
N
Minnesota
3
---
---
---
9
Missouri
8
---
573
---
---
Nebraska
---
---
N
N
N
North Dakota
---
---
92
---
N
South Dakota
---
---
53
---
N
S. Atlantic
9
---
2,567
1
238
Delaware
---
---
12
---
5
District of Columbia
N
N
30
---
1
Florida
6
---
1,125
1
112
Georgia
1
---
N
N
26
Maryland
---
---
N
---
34
North Carolina
2
---
N
N
15
South Carolina
---
---
134
---
16
Virginia
---
---
773
---
29
West Virginia
---
---
493
---
N
E.S. Central
---
---
554
---
39
Alabama
N
N
549
---
18
Kentucky
N
N
N
N
1
Mississippi
---
---
5
N
12
Tennessee
---
---
N
---
8
W.S. Central
6
---
5,086
---
111
Arkansas
---
---
501
---
N
Louisiana
2
---
140
---
41
Oklahoma
---
---
N
N
2
Texas
4
---
4,445
---
68
Mountain
1
---
1,342
---
33
Arizona
---
---
---
---
19
Colorado
N
---
515
---
12
Idaho
N
N
N
N
N
Montana
N
N
164
---
N
Nevada
1
---
N
N
N
New Mexico
N
N
119
---
1
Utah
---
---
544
---
1
Wyoming
---
---
---
---
---
Pacific
1
---
96
---
236
Alaska
N
N
57
---
---
California
N
N
---
---
139
Hawaii
1
---
39
---
30
Oregon
N
N
N
N
19
Washington
N
N
N
N
48
Territories
American Samoa
---
---
N
N
N
C.N.M.I.
---
---
---
---
---
Guam
---
---
32
---
2
Puerto Rico
---
---
530
---
N
U.S. Virgin Islands
---
---
---
---
---
N: Not reportable. U: Unavailable. ---: No reported cases. C.N.M.I.: Commonwealth of Northern Mariana Islands.
§§§§ Totals reported to the Division of Viral Diseases, National Center for Immunization and Respiratory Diseases (NCIRD), as of June 30, 2010.
TABLE 3. Reported cases and incidence* of notifiable diseases,† by age group --- United States, 2009
Disease
<1 yr
1--4 yrs
5--14 yrs
15--24 yrs
25--39 yrs
40--64 yrs
>65 yrs
Age not stated
Total
No.
Rate
No.
Rate
No.
Rate
No.
Rate
No.
Rate
No.
Rate
No.
Rate
Anthrax
---
(0)
---
(0)
---
(0)
1
(0)
---
(0)
---
(0)
---
(0)
---
1
Arboviral diseases§
California serogroup virus
neuroinvasive
---
(0)
10
(0.06)
29
(0.07)
2
(0)
1
(0)
3
(0)
1
(0)
---
46
nonneuroinvasive
---
(0)
---
(0)
6
(0.01)
---
(0)
1
(0)
1
(0)
1
(0)
---
9
Eastern equine encephalitis virus
neuroinvasive
---
(0)
---
(0)
1
(0)
1
(0)
---
(0)
---
(0)
1
(0)
---
3
nonneuroinvasive
---
(0)
1
(0.01)
---
(0)
---
(0)
---
(0)
---
(0)
---
(0)
---
1
Powassan virus, neuroinvasive
---
(0)
---
(0)
1
(0)
---
(0)
---
(0)
2
(0)
3
(0.01)
---
6
St. Louis encephalitis virus
neuroinvasive
---
(0)
1
(0.01)
1
(0)
---
(0)
1
(0)
2
(0)
6
(0.02)
---
11
nonneuroinvasive
---
(0)
---
(0)
---
(0)
---
(0)
---
(0)
---
(0)
1
(0)
---
1
West Nile virus
neuroinvasive
---
(0)
1
(0.01)
7
(0.02)
16
(0.04)
42
(0.07)
159
(0.16)
161
(0.41)
---
386
nonneuroinvasive
1
(0.02)
2
(0.01)
8
(0.02)
34
(0.08)
46
(0.07)
178
(0.18)
65
(0.17)
---
334
Botulism, total
75
(1.74)
6
(0.04)
2
(0)
1
(0)
4
(0.01)
22
(0.02)
5
(0.01)
3
118
foodborne
---
(0)
---
(0)
2
(0)
---
(0)
1
(0)
2
(0)
5
(0.01)
---
10
infant
75
(1.74)
6
(0.04)
---
(0)
---
(0)
---
(0)
---
(0)
---
(0)
2
83
other (wound and unspecified)
---
(0)
---
(0)
---
(0)
1
(0)
3
(0)
20
(0.02)
---
(0)
1
25
Brucellosis
---
(0)
5
(0.03)
14
(0.03)
12
(0.03)
28
(0.05)
33
(0.03)
22
(0.06)
1
115
Chancroid¶
---
(0)
---
(0)
---
(0)
12
(0.03)
9
(0.01)
5
(0.01)
---
(0)
2
28
Chlamydia trachomatis genitalinfection¶
---
(0)
---
(0)
---
(0)
883,933
(2,076.26)
304,373
(491.52)
36,661
(36.82)
946
(2.43)
3,159
1,244,180
Cholera
---
(0)
4
(0.02)
1
(0)
---
(0)
1
(0)
3
(0)
1
(0)
---
10
Coccidioidomycosis**
13
(0.91)
42
(0.77)
477
(3.63)
1,365
(9.73)
2,869
(14.26)
5,524
(17.54)
2,581
(21.68)
55
12,926
Cryptosporidiosis, total
138
(3.20)
933
(5.59)
1,017
(2.53)
1,008
(2.37)
1,480
(2.39)
1,902
(1.91)
1,056
(2.72)
120
7,654
confirmed
132
(3.06)
895
(5.36)
955
(2.38)
967
(2.27)
1,418
(2.29)
1,862
(1.87)
1,053
(2.71)
111
7,393
probable
6
(0.14)
38
(0.23)
62
(0.15)
41
(0.10)
62
(0.10)
40
(0.04)
3
(0.01)
9
261
Cyclosporiasis
---
(0)
2
(0.01)
8
(0.02)
15
(0.04)
24
(0.04)
67
(0.08)
23
(0.07)
2
141
Ehrlichiosis/Anaplasmosis
Ehrlichia chaffeensis
2
(0.05)
18
(0.12)
55
(0.15)
85
(0.22)
122
(0.22)
419
(0.46)
235
(0.66)
8
944
Ehrlichia ewingii
---
(0)
---
(0)
---
(0)
---
(0)
1
(0)
4
(0)
2
(0.01)
---
7
Anaplasma phagocytophilum
---
(0)
4
(0.03)
40
(0.11)
54
(0.14)
106
(0.19)
550
(0.60)
363
(1.02)
44
1,161
Undetermined
---
(0)
5
(0.03)
9
(0.03)
14
(0.04)
22
(0.04)
58
(0.07)
47
(0.14)
---
155
Giardiasis
246
(6.72)
3,071
(21.69)
3,163
(9.22)
2,020
(5.49)
3,528
(6.63)
5,239
(6.03)
1,548
(4.51)
584
19,399
Gonorrhea¶
---
(0)
---
(0)
---
(0)
187,641
(440.75)
88,433
(142.81)
20,481
(20.57)
554
(1.43)
766
301,174
Haemophilus influenzae, invasive disease, all ages, serotypes
270
(6.26)
179
(1.07)
109
(0.27)
81
(0.19)
187
(0.30)
772
(0.78)
1,369
(3.52)
55
3,022
age <5 yrs
serotype b
24
(0.56)
14
(0.08)
---
(0)
---
(0)
---
(0)
---
(0)
---
(0)
---
38
nonserotype b
158
(3.66)
87
(0.52)
---
(0)
---
(0)
---
(0)
---
(0)
---
(0)
---
245
unknown serotype
88
(2.04)
78
(0.47)
---
(0)
---
(0)
---
(0)
---
(0)
---
(0)
---
166
Hansen disease (Leprosy)
---
(0)
---
(0)
---
(0)
9
(0.02)
26
(0.05)
27
(0.03)
16
(0.05)
25
103
Hantavirus pulmonary syndrome
---
(0)
---
(0)
6
(0.02)
2
(0)
6
(0.01)
4
(0)
2
(0.01)
---
20
Hemolytic uremic syndrome, post-diarrheal
6
(0.15)
110
(0.70)
80
(0.21)
21
(0.05)
8
(0.01)
8
(0.01)
9
(0.02)
---
242
Hepatitis, viral, acute
A
16
(0.37)
45
(0.27)
159
(0.40)
371
(0.87)
499
(0.81)
571
(0.57)
300
(0.77)
26
1,987
B
1
(0.02)
4
(0.02)
5
(0.01)
209
(0.49)
1,268
(2.05)
1,670
(1.68)
227
(0.59)
21
3,405
C
1
(0.02)
4
(0.03)
---
(0)
169
(0.42)
319
(0.54)
274
(0.29)
12
(0.03)
3
782
HIV diagnoses††
58
(1.34)
25
(0.15)
80
(0.20)
6,875
(16.15)
14,453
(23.34)
14,765
(14.83)
614
(1.58)
---
36,870
Influenza-associated pediatric mortality§§
51
(1.20)
59
(0.36)
195
(0.49)
53
(0.41)
---
(0)
---
(0)
---
(0)
---
358
Legionellosis
2
(0.05)
4
(0.02)
4
(0.01)
34
(0.08)
242
(0.39)
1,825
(1.83)
1,386
(3.57)
25
3,522
Listeriosis
83
(1.92)
10
(0.06)
7
(0.02)
36
(0.08)
63
(0.10)
192
(0.19)
442
(1.14)
18
851
Lyme disease, total
30
(0.70)
1,159
(6.97)
5,420
(13.56)
3,476
(8.20)
4,869
(7.90)
13,237
(13.35)
4,775
(12.34)
5,502
38,468
confirmed
27
(0.63)
1,034
(6.19)
4,442
(11.07)
2,599
(6.10)
3,667
(5.92)
10,326
(10.37)
3,583
(9.22)
4,281
29,959
probable
3
(0.07)
125
(0.75)
978
(2.44)
877
(2.06)
1,202
(1.94)
2,911
(2.92)
1,192
(3.07)
1,221
8,509
Malaria
5
(0.12)
56
(0.34)
131
(0.33)
251
(0.59)
399
(0.64)
509
(0.51)
71
(0.18)
29
1,451
Measles, total
7
(0.16)
22
(0.13)
15
(0.04)
9
(0.02)
11
(0.02)
5
(0.01)
---
(0)
2
71
indigenous
5
(0.12)
18
(0.11)
12
(0.03)
7
(0.02)
5
(0.01)
3
(0)
---
(0)
1
51
imported
2
(0.05)
4
(0.02)
3
(0.01)
2
(0)
6
(0.01)
2
(0)
---
(0)
1
20
Meningococcal disease, all serogroups
116
(2.69)
90
(0.54)
75
(0.19)
194
(0.46)
107
(0.17)
220
(0.22)
172
(0.44)
6
980
serogroup A,C,Y, and W-135
19
(0.44)
13
(0.08)
19
(0.05)
65
(0.15)
27
(0.04)
79
(0.08)
78
(0.20)
1
301
serogroup B
32
(0.74)
28
(0.17)
13
(0.03)
49
(0.12)
18
(0.03)
24
(0.02)
8
(0.02)
2
174
other serogroup
2
(0.05)
3
(0.02)
3
(0.01)
5
(0.01)
1
(0)
3
(0)
6
(0.02)
---
23
serogroup unknown
63
(1.46)
46
(0.28)
40
(0.10)
75
(0.18)
61
(0.10)
114
(0.11)
80
(0.21)
3
482
Mumps
24
(0.56)
117
(0.70)
666
(1.66)
719
(1.69)
280
(0.45)
147
(0.15)
32
(0.08)
6
1,991
TABLE 3. (Continued) Reported cases and incidence* of notifiable diseases,† by age group --- United States, 2009
† No cases of diphtheria; poliovirus infection, nonparalytic; Powassan virus disease, non-neuroinvasive; severe acute respiratory syndrome-associated coronavirus disease (SARS-CoV); smallpox; western equine encephalitis virus disease, neuroinvasive and non-neuroinvasive; and yellow fever were reported in 2009. Data on chronic hepatitis B and hepatitis C virus infection (past or present) are not included because they are undergoing data quality review. Data on human immunodeficiency virus (HIV) infections are not included because HIV infection reporting has been implemented on different dates and using different methods than for AIDS case reporting.
§ Totals reported to the Division of Vector-Borne Infectious Diseases, National Center for Emerging and Zoonotic Infectious Diseases (ArboNET Surveillance), as of May 28, 2010.
¶ Cases among persons aged <15 years are not shown because some might not be caused by sexual transmission; these cases are included in the totals. Totals reported to the Division of STD Prevention, National Center for HIV/AIDS, Viral Hepatitis, STD, and TB Prevention (NCHHSTP), as of May 7, 2010.
†† Total number of HIV cases reported to the Division of HIV/AIDS Prevention, NCHHSTP through December 31, 2009.
** Notifiable in <40 states.
§§ Totals reported to the Influenza Division, National Center for Immunization and Respiratory Diseases, as of December 31, 2009.
¶¶ Totals reported to the Division of TB Elimination, NCHHSTP, as of May 14, 2010.
TABLE 4. Reported cases and incidence* of notifiable diseases,† by sex --- United States, 2009
Disease
Male
Female
Sex not stated
Total
No.
Rate
No.
Rate
Anthrax
---
(0)
1
(0)
---
1
Arboviral diseases§
California serogroup virus
neuroinvasive
33
(0.02)
13
(0.01)
---
46
nonneuroinvasive
4
(0)
5
(0)
---
9
Eastern equine encephalitis virus
neuroinvasive
3
(0)
---
(0)
---
3
nonneuroinvasive
(0)
1
(0)
---
1
Powassan virus, neuroinvasive
6
(0)
---
(0)
---
6
St. Louis encephalitis virus
neuroinvasive
6
(0)
5
(0)
---
11
nonneuroinvasive
1
(0)
---
(0)
---
1
West Nile virus
neuroinvasive
226
(0.15)
160
(0.10)
---
386
nonneuroinvasive
178
(0.12)
155
(0.10)
1
334
Botulism, total
68
(0.05)
50
(0.03)
---
118
foodborne
4
(0)
6
(0)
---
10
infant
46
(2.08)
37
(1.76)
---
83
other (wound and unspecified)
14
(0.01)
7
(0)
4
25
Brucellosis
69
(0.05)
45
(0.03)
1
115
Chancroid¶
10
(0.01)
17
(0.01)
1
28
Chlamydia trachomatis genitalinfection¶
328,783
(219.30)
912,718
(592.15)
2,679
1,244,180
Cholera
5
(0)
5
(0)
---
10
Coccidioidomycosis**
6,438
(13.32)
6,365
(12.92)
123
12,926
Cryptosporidiosis, total
3,464
(2.31)
3,996
(2.59)
194
7,654
confirmed
3,359
(2.24)
3,854
(2.50)
180
7,393
probable
105
(0.07)
142
(0.09)
14
261
Cyclosporiasis
63
(0.05)
76
(0.06)
2
141
Ehrlichiosis/Anaplasmosis
Ehrlichia chaffeensis
470
(0.34)
370
(0.26)
104
944
Ehrlichia ewingii
3
(0)
2
(0)
2
7
Anaplasma phagocytophilum
691
(0.50)
447
(0.32)
23
1,161
Undetermined
83
(0.06)
66
(0.05)
6
155
Giardiasis
10,635
(8.20)
8,272
(6.19)
492
19,399
Gonorrhea¶
137,819
(91.93)
162,568
(105.47)
787
301,174
Haemophilus influenzae, invasive disease, all ages, serotypes
1,351
(0.90)
1,608
(1.04)
63
3,022
age <5 yrs
serotype b
17
(0.16)
21
(0.20)
---
38
nonserotype b
138
(1.28)
107
(1.04)
---
245
unknown serotype
80
(0.74)
77
(0.75)
9
166
Hansen disease (Leprosy)
53
(0.04)
26
(0.02)
24
103
Hantavirus pulmonary syndrome
14
(0.01)
6
(0)
---
20
Hemolytic uremic syndrome, post-diarrheal
101
(0.07)
138
(0.10)
3
242
Hepatitis, viral, acute
A
1,039
(0.69)
923
(0.60)
25
1,987
B
2,048
(1.37)
1,304
(0.85)
53
3,405
C
395
(0.28)
386
(0.26)
1
782
HIV diagnoses††
28,307
(18.88)
8,563
(5.56)
---
36,870
Influenza-associated pediatric mortality§§
183
(0.48)
175
(0.48)
---
358
Legionellosis
2,169
(1.45)
1,295
(0.84)
58
3,522
Listeriosis
365
(0.24)
475
(0.31)
11
851
Lyme disease, total
20,628
(13.82)
16,580
(10.80)
1,260
38,468
confirmed
16,154
(10.77)
12,670
(8.22)
1,135
29,959
probable
4,474
(2.98)
3,910
(2.54)
125
8,509
Malaria
918
(0.61)
505
(0.33)
28
1,451
Measles, total
46
(0.03)
25
(0.02)
---
71
indigenous
34
(0.02)
17
(0.01)
---
51
imported
12
(0.01)
8
(0.01)
---
20
Meningococcal disease, all serogroups
469
(0.31)
485
(0.31)
26
980
serogroup A,C,Y, and W-135
133
(0.09)
167
(0.11)
1
301
serogroup B
95
(0.06)
79
(0.05)
---
174
other serogroup
11
(0.01)
12
(0.01)
---
23
serogroup unknown
230
(0.15)
227
(0.15)
25
482
TABLE 4. (Continued) Reported cases and incidence* of notifiable diseases,† by sex --- United States, 2009
† No cases of diphtheria; poliovirus infection, nonparalytic; Powassan virus disease, non-neuroinvasive; severe acute respiratory syndrome-associated coronavirus disease (SARS-CoV); smallpox; western equine encephalitis virus disease, neuroinvasive and non-neuroinvasive; and yellow fever were reported in 2009. Data on chronic hepatitis B and hepatitis C virus infection (past or present) are not included because they are undergoing data quality review. Data on human immunodeficiency virus (HIV) infections are not included because HIV infection reporting has been implemented on different dates and using different methods than for AIDS case reporting.
§ Totals reported to the Division of Vector-Borne Infectious Diseases, National Center for Emerging and Zoonotic Infectious Diseases (ArboNET Surveillance), as of May 28, 2010.
¶ Totals reported to the Division of STD Prevention, National Center for HIV/AIDS, Viral Hepatitis, STD, and TB Prevention (NCHHSTP), as of May 7, 2010.
** Notifiable in <40 states.
†† Total number of HIV cases reported to the Division of HIV/AIDS Prevention, NCHHSTP through December 31, 2009.
§§ Totals reported to the Influenza Division, National Center for Immunization and Respiratory Diseases, as of December 31, 2009.
¶¶ Totals reported to the Division of TB Elimination, NCHHSTP, as of May 14, 2010.
TABLE 5. Reported cases and incidence* of notifiable diseases,† by race --- United States, 2009
Disease
American Indian or Alaska Native
Asian or Pacific Islander
Black
White
Other
Race not stated
Total
No.
Rate
No.
Rate
No.
Rate
No.
Rate
Arboviral diseases§
California serogroup virus, neuroinvasive
3
(0.09)
0
(0)
0
(0)
40
(0.02)
0
3
46
West Nile virus
neuroinvasive
7
(0.20)
1
(0.01)
20
(0.05)
298
(0.12)
4
56
386
nonneuroinvasive
2
(0.06)
1
(0.01)
9
(0.02)
228
(0.09)
2
92
334
Botulism, total
2
(0.06)
5
(0.03)
8
(0.02)
55
(0.02)
3
45
118
infant
1
(1.44)
5
(2.22)
5
(0.70)
38
(1.15)
3
31
83
other (wound and unspecified)
0
(0)
0
(0)
2
(0)
9
(0)
0
14
25
Brucellosis
0
(0)
3
(0.02)
7
(0.02)
52
(0.02)
6
47
115
Chancroid¶
1
(0.03)
0
(0)
9
(0.02)
9
(0)
3
6
28
Chlamydia trachomatis genitalinfection¶
14,906
(435.61)
16,826
(111.94)
439,489
(1088.80)
356,924
(145.54)
42,656
373,379
1,244,180
Coccidioidomycosis**
136
(9.44)
142
(2.12)
415
(3.82)
2,431
(3.09)
197
9,605
12,926
Cryptosporidiosis, total
32
(0.94)
60
(0.40)
544
(1.35)
4,890
(1.99)
197
1,931
7,654
confirmed
29
(0.85)
56
(0.37)
532
(1.32)
4,713
(1.92)
182
1,881
7,393
probable
3
(0.09)
4
(0.03)
12
(0.03)
177
(0.07)
15
50
261
Cyclosporiasis
0
(0)
4
(0.03)
8
(0.02)
84
(0.04)
2
43
141
Ehrlichiosis/Anaplasmosis
Ehrlichia chaffeensis
27
(0.99)
4
(0.03)
31
(0.08)
511
(0.23)
52
319
944
Anaplasma phagocytophilum
11
(0.41)
5
(0.04)
8
(0.02)
676
(0.30)
6
455
1,161
Undetermined
0
(0)
1
(0.01)
1
(0)
117
(0.05)
8
28
155
Giardiasis
88
(2.86)
1,041
(7.52)
1,407
(4.15)
7,924
(3.73)
810
8,129
19,399
Gonorrhea¶
2,361
(69.00)
2,118
(14.09)
168,462
(417.33)
56,250
(22.94)
7,361
64,622
301,174
Haemophilus influenzae, invasive disease, all ages, serotypes
34
(0.99)
51
(0.34)
365
(0.90)
1,829
(0.75)
49
694
3,022
age <5 yrs
serotype b
1
(0.31)
1
(0.09)
5
(0.15)
22
(0.14)
1
8
38
nonserotype b
6
(1.84)
7
(0.63)
45
(1.32)
96
(0.59)
8
83
245
unknown serotype
9
(2.76)
5
(0.45)
29
(0.85)
64
(0.40)
3
56
166
Hansen disease (Leprosy)
0
(0)
12
(0.09)
5
(0.01)
40
(0.02)
2
44
103
Hemolytic uremic syndrome, post-diarrheal
4
(0.12)
2
(0.01)
6
(0.02)
174
(0.08)
3
53
242
Hepatitis, viral, acute
A
9
(0.26)
150
(1.00)
158
(0.39)
990
(0.40)
94
586
1,987
B
26
(0.76)
98
(0.65)
634
(1.57)
1,700
(0.70)
107
840
3,405
C
12
(0.41)
5
(0.04)
44
(0.11)
535
(0.23)
12
174
782
HIV diagnoses††
164
(4.79)
538
(3.58)
17,871
(44.27)
10,944
(4.46)
7,353
---
36,870
Influenza-associated pediatric mortality§§
11
(1.04)
18
(0.50)
64
(0.53)
224
(0.39)
0
41
358
Legionellosis
13
(0.38)
42
(0.28)
649
(1.61)
2,129
(0.87)
71
618
3,522
Listeriosis
3
(0.09)
36
(0.24)
81
(0.20)
490
(0.20)
30
211
851
Lyme disease, total
116
(3.40)
304
(2.14)
384
(0.95)
18,007
(7.36)
5,128
14,529
38,468
confirmed
86
(2.51)
226
(1.50)
260
(0.64)
14,170
(5.78)
3,755
11,462
29,959
probable
30
(0.88)
78
(0.52)
124
(0.31)
3,837
(1.56)
1,373
3,067
8,509
Malaria
2
(0.06)
120
(0.80)
737
(1.83)
212
(0.09)
47
333
1,451
Measles, total
0
(0)
8
(0.05)
0
(0)
46
(0.02)
3
14
71
indigenous
0
(0)
3
(0.02)
0
(0)
35
(0.01)
0
13
51
Meningococcal disease, all serogroups
10
(0.29)
20
(0.13)
145
(0.36)
582
(0.24)
14
209
980
serogroup A,C,Y, and W-135
3
(0.09)
4
(0.03)
64
(0.16)
187
(0.08)
2
41
301
serogroup B
1
(0.03)
3
(0.02)
12
(0.03)
126
(0.05)
4
28
174
serogroup unknown
5
(0.15)
11
(0.07)
66
(0.16)
256
(0.10)
8
136
482
Mumps
4
(0.12)
36
(0.24)
30
(0.07)
1,756
(0.72)
14
151
1,991
Pertussis
117
(3.42)
204
(1.36)
746
(1.85)
11,378
(4.64)
726
3,687
16,858
Q Fever, total
2
(0.06)
3
(0.02)
2
(0)
64
(0.03)
6
36
113
acute
1
(0.03)
3
(0.02)
2
(0)
51
(0.02)
5
31
93
Rabies, animal
1
(0.03)
0
(0)
0
(0)
29
(0.01)
32
5,281
5,343
Rocky Mountain spotted fever, total
121
(3.67)
9
(0.06)
49
(0.12)
1,086
(0.44)
77
473
1,815
confirmed
13
(0.38)
1
(0.01)
3
(0.01)
88
(0.04)
8
38
151
probable
108
(3.16)
8
(0.05)
46
(0.11)
998
(0.41)
69
433
1,662
Salmonellosis
334
(9.76)
1,118
(7.44)
4,197
(10.40)
26,614
(10.85)
1,400
15,529
49,192
Shiga toxin-producing E. coli (STEC)
28
(0.82)
87
(0.58)
153
(0.38)
2,925
(1.19)
123
1,327
4,643
Shigellosis
216
(6.31)
199
(1.32)
3,115
(7.72)
6,301
(2.57)
1,000
5,100
15,931
Streptococcal disease, invasive, group A
106
(4.07)
131
(1.41)
716
(2.05)
2,981
(1.48)
155
1,190
5,279
Streptococcal, toxic-shock syndrome
1
(0.05)
5
(0.06)
19
(0.07)
110
(0.07)
3
23
161
Streptococcus pneumoniae, invasive disease
drug resistant
all ages
13
(0.68)
30
(0.42)
646
(2.37)
2,071
(1.32)
52
558
3,370
age <5 yrs
2
(1.04)
12
(2.18)
123
(5.28)
302
(3.10)
15
129
583
non-drug resistant, age <5 yrs
53
(22.42)
44
(6.52)
384
(14.05)
938
(8.00)
60
509
1,988
TABLE 5. (Continued) Reported cases and incidence* of notifiable diseases,† by race --- United States, 2009
* Per 100,000 population. Diseases for which <25 cases were reported are not included in this table.
† No cases of diphtheria; poliovirus infection, nonparalytic; Powassan virus disease, non-neuroinvasive; severe acute respiratory syndrome-associated coronavirus disease (SARS-CoV); smallpox, western equine encephalitis virus disease, neuroinvasive and non-neuroinvasive; and yellow fever were reported in 2009. Data on chronic hepatitis B and hepatitis C virus infection (past or present) are not included because they are undergoing data quality review. Data on human immunodeficiency virus (HIV) infections are not included because HIV infection reporting has been implemented on different dates and using different methods than for AIDS case reporting.
§ Totals reported to the Division of Vector-Borne Infectious Diseases, National Center for Emerging and Zoonotic Infectious Diseases (ArboNET Surveillance), as of May 28, 2010.
¶ Cases with unknown race have not been redistributed. For this reason, the total number of cases reported here might differ slightly from totals reported in other surveillance summaries. Totals reported to the Division of STD Prevention, National Center for HIV/AIDS, Viral Hepatitis, STD, and TB Prevention (NCHHSTP), as of May 7, 2010.
** Notifiable in <40 states.
†† Total number of HIV cases reported to the Division of HIV/AIDS Prevention, NCHHSTP through December 31, 2009.
§§ Totals reported to the Influenza Division, National Center for Immunization and Respiratory Disease, as of December 31, 2009.
¶¶ Totals reported to the Division of TB Elimination, NCHHSTP, as of May 14, 2010.
TABLE 6. Reported cases and incidence* of notifiable diseases,† by ethnicity --- United States, 2009
Disease
Hispanic
Non-Hispanic
Ethnicity not stated
Total
No.
Rate
No.
Rate
Arboviral diseases§
California serogroup virus, neuroinvasive
1
(0)
39
(0.02)
6
46
West Nile virus
neuroinvasive
62
(0.13)
237
(0.09)
87
386
nonneuroinvasive
20
(0.04)
193
(0.08)
121
334
Botulism, total
12
(0.03)
66
(0.03)
40
118
infant
8
(0.72)
47
(1.47)
28
83
other (wound and unspecified)
4
(0.01)
10
(0)
11
25
Brucellosis
56
(0.12)
35
(0.01)
24
115
Chancroid¶
5
(0.01)
14
(0.01)
9
28
Chlamydia trachomatis genitalinfection¶
171,337
(364.98)
586,838
(228.24)
486,005
1,244,180
Coccidioidomycosis**
1,176
(6.11)
2,270
(2.90)
9,480
12,926
Cryptosporidiosis, total
512
(1.09)
4,298
(1.67)
2,844
7,654
confirmed
475
(1.01)
4,163
(1.62)
2,755
7,393
probable
37
(0.08)
135
(0.05)
89
261
Cyclosporiasis
13
(0.03)
87
(0.04)
41
141
Ehrlichiosis/Anaplasmosis
Ehrlichia chaffeensis
14
(0.03)
491
(0.21)
439
944
Anaplasma phagocytophilum
13
(0.03)
512
(0.22)
636
1,161
Undetermined
1
(0)
79
(0.03)
75
155
Giardiasis
1,867
(5.02)
8,042
(3.56)
9,490
19,399
Gonorrhea¶
21,599
(46.01)
172,928
(67.26)
106,647
301,174
Haemophilus influenzae, invasive disease, all ages, serotypes
175
(0.37)
1,638
(0.64)
1,209
3,022
age <5 yrs
serotype b
5
(0.10)
21
(0.13)
12
38
nonserotype b
41
(0.78)
116
(0.73)
88
245
unknown serotype
21
(0.40)
77
(0.49)
68
166
Hansen disease (Leprosy)
29
(0.07)
36
(0.02)
38
103
Hemolytic uremic syndrome, post-diarrheal
19
(0.04)
160
(0.07)
63
242
Hepatitis, viral, acute
A
393
(0.84)
980
(0.38)
614
1,987
B
316
(0.67)
1,979
(0.77)
1,110
3,405
C
58
(0.13)
460
(0.19)
264
782
HIV diagnoses††
6,931
(14.76)
29,939
(11.64)
---
36,870
Influenza-associated pediatric mortality§§
97
(0.60)
215
(0.37)
46
358
Legionellosis
191
(0.41)
2,059
(0.80)
1,272
3,522
Listeriosis
120
(0.26)
479
(0.19)
252
851
Lyme disease, total
692
(1.48)
13,590
(5.31)
24,186
38,468
confirmed
513
(1.09)
10,681
(4.15)
18,765
29,959
probable
179
(0.38)
2,909
(1.13)
5,421
8,509
Malaria
42
(0.09)
925
(0.36)
484
1,451
Measles, total
6
(0.01)
46
(0.02)
19
71
indigenous
5
(0.01)
28
(0.01)
18
51
Meningococcal disease, all serogroups
113
(0.24)
610
(0.24)
257
980
serogroup A,C,Y, and W-135
32
(0.07)
201
(0.08)
68
301
serogroup B
12
(0.03)
111
(0.04)
51
174
serogroup unknown
66
(0.14)
285
(0.11)
131
482
Mumps
73
(0.16)
1,770
(0.69)
148
1,991
Pertussis
2,212
(4.71)
9,976
(3.88)
4,670
16,858
Q Fever, total
18
(0.04)
55
(0.02)
40
113
acute
15
(0.03)
45
(0.02)
33
93
Rabies, animal
0
(0)
38
(0.02)
5,305
5,343
Rocky Mountain spotted fever, total
60
(0.13)
1,111
(0.44)
644
1,815
confirmed
8
(0.02)
82
(0.03)
61
151
probable
52
(0.11)
1,027
(0.40)
583
1,662
Salmonellosis
6,558
(13.97)
25,336
(9.85)
17,298
49,192
Shiga toxin-producing E. coli (STEC)
460
(0.98)
2,657
(1.03)
1,526
4,643
Shigellosis
3,389
(7.22)
6,670
(2.59)
5,872
15,931
Streptococcal disease, invasive, group A
428
(1.33)
2,593
(1.20)
2,258
5,279
Streptococcal, toxic-shock syndrome
11
(0.06)
88
(0.05)
62
161
TABLE 6. (Continued) Reported cases and incidence* of notifiable diseases,† by ethnicity --- United States, 2009
* Per 100,000 population. Diseases for which <25 cases were reported are not included in this table.
† No cases of diphtheria; poliovirus infection, nonparalytic; Powassan virus disease, non-neuroinvasive; severe acute respiratory syndrome-associated coronavirus disease (SARS-CoV); smallpox; western equine encephalitis virus disease, neuroinvasive and non-neuroinvasive; and yellow fever were reported in 2009. Data on chronic hepatitis B and hepatitis C virus infection (past or present) are not included because they are undergoing data quality review. Data on human immunodeficiency virus (HIV) infections are not included because HIV infection reporting has been implemented on different dates and using different methods than for AIDS case reporting.
§ Totals reported to the Division of Vector-Borne Infectious Diseases, National Center for Emerging and Zoonotic Infectious Diseases (ArboNET Surveillance), as of May 28, 2010.
¶ Cases with unknown race have not been redistributed. For this reason, the total number of cases reported here might differ slightly from totals reported in other surveillance summaries. Totals reported to the Division of STD Prevention, National Center for HIV/AIDS, Viral Hepatitis, STD, and TB Prevention (NCHHSTP), as of May 7, 2010.
** Notifiable in <40 states.
†† Total number of HIV cases reported to the Division of HIV/AIDS Prevention, NCHHSTP through December 31, 2009.
§§ Totals reported to the Influenza Division, National Center for Immunization and Respiratory Diseases, as of December 31, 2009.
¶¶ Totals reported to the Division of TB Elimination, NCHHSTP, as of May 14, 2010.
PART 2
Graphs and Maps for Selected Notifiable Diseases in the United States, 2009
Abbreviations and Symbols Used in Graphs and Maps
U Data not available.
N Not reportable (i.e., report of disease not required in that jurisdiction).
DC District of Columbia
AS American Samoa
CNMI Commonwealth of Northern Mariana Islands
GU Guam
PR Puerto Rico
VI U.S. Virgin Islands
Anthrax. Number of reported cases, by year --- United States, 1954--2009
* One epizootic-associated cutaneous case was reported in 2001 from Texas.
The confirmed case of gastrointestinal anthrax that was reported in the United States in 2009, and previous unrelated cases reported in 2006, 2007, and 2008 in both the United States and the United Kingdom, reflect the potential risk for anthrax among persons who make or use drums made of untreated animal hides contaminated with Bacillus anthracis from countries where anthrax is common in animals and among persons who are exposed to environments that are cross-contaminated by these activities.
Alternate Text: This figure is a line graph that presents the number of anthrax cases by year in the United States from 1954 to 2009.
ARBOVIRAL DISEASES. Number* of reported cases of neuroinvasive disease, by year --- United States, 2000--2009
* Data from the Division of Vector-Borne Diseases, National Center for Emerging and Zoonotic Infectious Diseases (ArboNET Surveillance). Only reported cases of neuroinvasive disease are shown.
The most common arthropod-borne viruses (arboviruses) affecting humans in the United States are West Nile virus (WNV), La Crosse virus (LACV), St. Louis encephalitis virus (SLEV), and Eastern equine encephalitis virus (EEEV). LACV is the most common California (CAL) serogroup virus in the United States. LACV causes neuroinvasive disease primarily among children. In 2009, 46 cases of CAL serogroup virus neuroinvasive disease, including 44 cases caused by LACV, were reported from 10 states (Alabama, Georgia, Indiana, Missouri, Montana, North Carolina, Ohio, Tennessee, West Virginia, and Wisconsin). During 2000--2009, a median of 93 (range: 46--167) cases per year were reported in the United States. The number of reported CAL serogroup disease cases peaked in 2002 and has declined since then. Before the introduction of WNV, SLEV was the leading cause of arboviral encephalitis in the United States, with periodic large outbreaks comprising hundreds to thousands of cases. In 2009, 11 cases of SLEV neuroinvasive disease were reported from five states (Arkansas, Indiana, Mississippi, Texas, and Washington). During 2000--2009, a median of 10 (range: 2--79) cases per year were reported in the United States. Whether the recent decline in the number of reported SLEV disease cases is related to normal periodicity in viral activity, surveillance artifact, or possible competitive displacement of SLEV by WNV is unknown. EEEV disease in humans is associated with high mortality rates (>20%) and severe neurologic sequelae. In 2009, three cases of EEEV neuroinvasive disease cases were reported, including one case each in Louisiana, New York, and North Carolina. During 2000--2009, a median of seven (range: 3--21) cases per year were reported in the United States.
Alternate Text: - This figure is a line graph that presents the number of cases of neuroinvasive disease, broken down by California serogroup viruses, Eastern equine encephalitis virus, and St. Louis encephalitis virus, from 2000 to 2009.
ARBOVIRAL DISEASES, WEST NILE VIRUS. Incidence* of reported cases of neuroinvasive disease, by state --- United States, 2009
* Per 100,000 population. Data from the Division of Vector-Borne Diseases, National Center for Emerging and Zoonotic Infectious Diseases (ArboNET Surveillance).
In 2009, the states with the greatest reported incidence of West Nile virus (WNV) neuroinvasive disease were Mississippi (1.05 per 100,000), South Dakota (0.74), Wyoming (0.73), Colorado (0.72), and Nebraska (0.61). The five states with the greatest number of reported cases were Texas (93), California (67), Colorado (36), Mississippi (31), and Washington (26). Texas reported 24% of all WNV neuroinvasive disease cases in 2009.
Alternate Text: This figure is a map of the United States that presents incidence range per 100,000 population of West Nile virus cases in each state in 2009.
ARBOVIRAL DISEASES, WEST NILE VIRUS. Incidence* of reported cases of neuroinvasive disease, by year --- United States, 2000--2009
* Per 100,000 population. Data from the Division of Vector-Borne Diseases, National Center for Emerging and Zoonotic Infectious Diseases (ArboNET Surveillance).
West Nile virus (WNV) was first detected in the United States in 1999. Despite substantial geographic spread of the virus from 1999 through 2001, WNV neuroinvasive disease incidence remained low until 2002, when large outbreaks occurred in the Midwest and Great Plains. The national incidence of WNV neuroinvasive disease peaked in 2002 and 2003 and was relatively stable from 2004 through 2007. WNV had appeared to reach a stable incidence but incidence decreased in 2008 and continued to decline in 2009. The reported incidence of WNV neuroinvasive disease in the United States for 2009 was 0.13 per 100,000 population, the lowest recorded since 2001.
Alternate Text: This figure is a bar chart that presents the incidence per 100,000 population of West Nile virus cases in the United States each year from 2000 to 2009.
ARBOVIRAL DISEASES, WEST NILE VIRUS. Incidence* of reported cases of neuroinvasive disease, by age group --- United States, 2009
* Per 100,000 population. Data from the Division of Vector-Borne Diseases, National Center for Emerging and Zoonotic Infectious Diseases (ArboNET Surveillance).
In 2009, the median age of patients with West Nile virus neuroinvasive disease was 60 years (range: 2--91 years), with increasing incidence among older age groups.
Alternate Text: This figure is a bar chart that presents the incidence per 100,000 population of West Nile virus cases in the United States by age group during 2009.
Botulism, FOODBORNE. Number of reported cases, by year --- United States, 1989--2009
Rates of foodborne botulism have remained stable during the past 2 decades. In 2009, all cases were caused by consumption of home-canned foods.
Alternate Text: The figures is a line graph that presents the number of foodborne-related botulism cases in the United States from 1989 to 2009.
Botulism, infant. Number of reported cases, by year --- United States, 1989--2009
Infant botulism remains the most common cause of botulism in the United States and accounted for 69% of U.S. botulism cases in 2009.
Alternate Text: This figure is a line graph that presents the number of botulism cases in U.S. infants from 1989 to 2009.
Botulism, OTHER. (Includes wound and unspecified). Number of reported cases, by year --- United States, 1999--2009
Annual numbers of wound and unspecified forms of botulism have remained stable during the past decade. In 2009, the majority (80%) of cases occurred among injection-drug users in California and Washington.
Alternate Text: This figure is a line graph that presents the number of wound-related and unspecified botulism cases in the United States from 1999 to 2009.
Brucellosis. Number of reported cases, by year --- United States, 1979--2009
The incidence of brucellosis in the United States increased in 2009, following a decrease of reported cases from the previous year. The reason for the decline in 2008 is unknown, though the 2009 incidence remains consistent with reports from 2004 through 2007.
Alternate Text: This figure is a line graph that presents the number of brucellosis cases in the United States from 1979 to 2009.
Brucellosis. Number of reported cases --- United States and U.S. territories, 2009
California reported the greatest number of cases, followed by Texas, Georgia, Michigan, and Florida. Although brucellosis in cattle is in the final stages of eradication, the disease persists in feral swine, elk, and bison, increasing the risk of transmission to hunters while cleaning and dressing these animals. Outside of the United States, brucellosis remains endemic in several areas, including the Mediterranean basin, South and Central America, Eastern Europe, Asia, Africa, and the Middle East. Consumption of unpasteurized milk products, including soft cheeses from regions where brucellosis is common in cattle, sheep, and goats, presents a substantial risk.
Alternate Text: This figure is a map of the United States and U.S. territories that presents the number of brucellosis cases in each state and territory in 2009.
Chlamydia. Incidence* among women --- United States and U.S. territories, 2009
* Per 100,000 population.
In 2009, the chlamydia rate among women in the United States and territories (Guam, Puerto Rico, and Virgin Islands) was 588.5 cases per 100,000 population.
Alternate Text: This figure is a map of the United States and U.S. territories that presents the incidence per 100,000 population of chlamydia among women in 2009.
Cholera. Number of reported cases --- United States and U.S. territories, 2009
In 2009, the majority (80%) of cholera infections in the United States were acquired during travel abroad; of the remaining cases, one case occurred in a person who reported consuming domestic seafood, and the other resulted from an unknown domestic exposure. Foreign travel and consumption of contaminated domestic seafood remain the major sources of cholera infections in the United States. The above figure presents the number of reported cases of cholera in the United States and U.S. territories in 2009.
Alternate Text: This figure is a map of the United States and U.S. territories that presents the number of cholera cases in each state and territory in 2009.
Coccidioidomycosis. Number of reported cases --- United States and U.S. territories, 2009
During 2009, coccidioidomycosis cases reported from Arizona increased. In June 2009, one of the major commercial laboratories in Arizona changed reporting practices to conform with the accepted laboratory case definition from the Council of State and Territorial Epidemiologists; this change might have resulted in an artifactual increase.
Alternate Text: This figure is a map of the United States and U.S. territories that presents the number of coccidiodomycosis cases in each state and territory in 2009.
Cryptosporidiosis. Incidence,* by year --- United States, 1998--2009
* Per 100,000 population.
Cryptosporidiosis incidence decreased for the second consecutive year, from 3.02 in 2008 to 2.52 in 2009. The decreases in incidence in 2008 and 2009 follow a >3-fold increase during 2004--2007. Whether the changes in cryptosporidiosis reporting reflect a real change in cryptosporidiosis incidence or reflect changing diagnosis, testing, and reporting patterns is unclear.
Alternate Text: This figure is a bar chart that presents the incidence per 100,000 population of cryptosporidiosis cases in the United States from 1998 to 2009.
Cryptosporidiosis. Incidence* --- United States and U.S. territories, 2009
* Per 100,000 population.
Cryptosporidiosis is widespread geographically in the United States. Differences in reported incidence among states might reflect differences in risk factors, increased cases associated with outbreaks, or difference in the capacity to detect and report cases. Cryptosporidiosis incidence increases during summer, coinciding with increased use of recreational water.
Alternate Text: This figure is a map of the United States and U.S. territories that presents the incidence range per 100,000 population of cryptosporidiosis cases in each state and territory in 2009.
Diphtheria. Number of reported cases, by year --- United States, 1979--2009
Since 2004, no case of respiratory diphtheria has been reported in the United States and the national health objective of zero cases for 2010 has been maintained.
Alternate Text: This figure is a line graph that presents the number of diphtheria cases in the United States from 1979 to 2009.
EHRLICHIOSIS, ANAPLASMA PHAGOCYTOPHILUM. Number of reported cases, by county --- United States, 2009.
Anaplasmosis is caused by infection with Anaplasma phagocytophilum. Cases are reported primarily from the upper Midwest and coastal New England, reflecting both the range of the primary tick vector species (Ixodes scapularis) and the range of preferred animal hosts for tick feeding.
Alternate Text: This figure is a map of the United States that presents the number of ehrlichiosis (anaplasma phagocytophilum) cases by county in 2009.
EHRLICHIOSIS, EHRLICHIA CHAFFEENSIS. Number of reported cases, by county --- United States, 2009.
The most common type of ehrlichiosis results from infection with Ehrlichia chaffeensis. Cases are reported primarily in the lower Midwest, Southeast, and East Coast, reflecting the range of the primary tick vector species (Amblyomma americanum).
Alternate Text: This figure is a map of the United States that presents the number of Ehrlichiosis (Ehrlichia chaffeensis) cases by county in 2009.
EHRLICHIOSIS, EHRLICHIA EWINGII. Number of reported cases, by county --- United States, 2009.
Cases of ehrlichiosis caused by Erhlichia ewingii remain rare and are reported primarily from the central United States.
Alternate Text: This figure is a map of the United States that presents the number of Ehrlichiosis (Ehrlichia ewingii) cases in by county in 2009.
EHRLICHIOSIS, undetermined. Number of reported cases, by county --- United States, 2009.
Cases of ehrlichiosis and anaplasmosis caused by undetermined species, or more commonly, cases for which the geographically expected species is not clearly differentiated by serologic testing, are reflected in this reporting category. Because Ehrlichia and Anaplasma infections might elicit cross-reactive antibody responses, some states also might use this category to report cases for which single, inappropriate diagnostic tests were run (e.g., physicians ordering only ehrlichiosis tests in a region where anaplasmosis is expected to predominate).
Alternate Text: This figure is a map of the United States that presents the number of Ehrlichiosis (undetermined) cases by county in 2009.
Giardiasis. Incidence* --- United States and U.S. territories, 2009
* Per 100,000 population.
Giardiasis is widespread geographically in the United States, with increased reporting in certain states and regions. Whether this difference is of true biologic significance or reflects differences in giardiasis case detection and reporting among states is unclear. Giardiasis was not a reportable disease in Indiana before 2009.
Alternate Text: This figure is a map of the United States and U.S. territories that presents the incidence range per 100,000 population of giardiasis cases in each state and territory in 2009.
Gonorrhea. Incidence* --- United States and U.S. territories, 2009
* Per 100,000 population.
In 2009, the gonorrhea rate in the United States and territories (Guam, Puerto Rico, and Virgin Islands) was 97.8 cases per 100,000 population, a decrease from the rate in 2008.
Alternate Text: This figure is a map of the United States and U.S. territories that presents the incidence range per 100,000 population of gonorrhea cases in each state and territory in 2009.
Gonorrhea. Incidence,* by sex --- United States, 1994--2009
* Per 100,000 population.
After a 74% decline in the rate of reported gonorrhea from 1975 through 1997, overall gonorrhea rates plateaued. For the ninth year in a row, the gonorrhea rate among women in 2009 was slightly higher than the rate among men.
Alternate Text: This figure is a line graph that presents the incidence per 100,000 population of gonorrhea cases in the United States, with separate lines for men and women, from 1994 to 2009.
Gonorrhea. Incidence,* by race/ethnicity --- United States, 1994--2009
* Per 100,000 population.
† Y-axis is log scale.
Gonorrhea incidence among blacks decreased considerably during the 1990s but continues to be the highest among all races/ethnicities. In 2009, incidence among non-Hispanic blacks was approximately 20 times greater than that for non-Hispanic whites.
Alternate Text: This figure is a line graph that presents the incidence per 100,000 population of gonorrhea cases in the United States by race/ethnicity, with separate lines for black non-Hispanic, white non-Hispanic, American Indian/Alaska Native non-Hispanic, Asian/Pacific Islander non-Hispanic, and Hispanic, from 1994 to 2009.
Haemophilus influenzae, Invasive Disease. Incidence,* by age group --- United States, 1996--2009
* Per 100,000 population.
Substantial reductions in the incidence of Haemophilus influenzae serotype b (Hib) disease have been achieved through universal Hib vaccination. Before the introduction of conjugate vaccines in 1987, the incidence of invasive Hib disease among children aged <5 years was estimated to be 100 cases per 100,000 population. To monitor the epidemiology of Hib invasive disease and to detect the emergence of invasive non-Hib, serotyping of all Haemophilus influenzae isolates in children aged <5 years and thorough and timely investigation of all cases of Hib disease are essential.
Alternate Text: This figure is a line graph that presents the incidence per 100,000 population of invasive Haemophilus influenzae in the United States, with separate lines for persons aged <5 years and aged >5 years, from 1996 to 2009.
Hansen Disease (Leprosy). Number of reported cases, by year --- United States, 1989--2009
The number of cases of Hansen disease reported to CDC gradually declined during 1989--2006 and since has fluctuated from 73 to 109 cases per year.
Alternate Text: This figure is a line graph that presents the number of Hansen disease cases, also known as leprosy, in the United States from 1989 to 2009.
Hemolytic Uremic Syndrome, Postdiarrheal. Number of reported cases --- United States and U.S. territories, 2009
During 2009, most reported cases occurred among children aged 1--4 years. From 2008 to 2009, the number of reported cases decreased substantially, from 330 to 242. The majority of postdiarrheal hemolytic uremic syndrome (HUS) cases are caused by Shiga toxin-producing E. coli infections (STEC). The decrease in HUS cases is most likely caused by observed decreases in reported STEC infections.
Alternate Text: This figure is a map of the United States and U.S. territories that presents the number of hemolytic uremic, postdiarrheal cases in each state and territory in 2009.
Hepatitis, Viral. Incidence,* by year --- United States, 1979--2009
* Per 100,000 population.
† Hepatitis A vaccine was first licensed in 1995.
§ Hepatitis B vaccine was first licensed in June 1982.
¶ An anti-hepatitis C virus (HCV) antibody test first became available in May 1990.
Hepatitis A incidence continues to decline and in 2009 was the lowest ever recorded. This reduction in incidence is attributable, at least in part, to routine vaccination of children. Hepatitis A incidence has declined >90% since 1995. Routine hepatitis B vaccination of infants has reduced rates of hepatitis B infection by >95% in children. Rates also have declined among adults, but cases continue to occur among adults with high-risk behaviors. Outbreaks in health-care settings such as long-term--care facilities and nursing homes caused by failure to adhere to infection-control practices account for a substantial number of new cases among the elderly population. Incidence of acute hepatitis C has declined approximately 90% since 1992; however, a substantial burden of disease remains as a result of the estimated 3.2 million U.S. residents with chronic hepatitis C virus infection.
Alternate Text: This figure is a line graph that presents the incidence per 100,000 population of viral hepatitis, with separate lines for hepatitis A, B, and C, in the United States from 1979 to 2009.
Hepatitis A. Incidence,* by county --- United States, 2009
* Per 100,000 population.
In 1999, routine hepatitis A vaccination was recommended for children living in 11 states with consistently elevated rates of disease. Since then, rates of infection with hepatitis A virus (HAV) have declined in all regions, with the greatest decline occurring in western states. HAV infection rates are now the lowest ever reported and similar in all regions. As of 2006, hepatitis A vaccine is now recommended for children in all states.
Alternate Text: This figure is a map of the United States that presents the incidence range per 100,000 population of hepatitis A by county in 2009.
Human Immunodeficiency Virus Diagnoses. Percentage of diagnosed cases, by race/ethnicity---United States, 2009
Of persons diagnosed with HIV in 2009, the greatest percentage was among non-Hispanic blacks, followed by non-Hispanic whites, Hispanics, Asians/Pacific Islanders, and American Indians/Alaska Natives.
Alternate Text: This figure is a pie chart that presents the percentage of diagnosed cases of HIV by race ethnicity in the United States in 2009. The race/ethnicities included are black non-Hispanic, white, non-Hispanic, Asian/Pacific Islanders non-Hispanics, American Indian/Alaska Native non-Hispanic, and Hispanic.
Human Immunodeficiency Virus Diagnoses. Diagnosis rates*---United States and U.S. territories, 2009
* Per 100,000 population.
High rates (i.e. ≥15 cases per 100,000 population) of HIV diagnosis were observed in certain states in the Southeast and Northeast. Rates ≥15 cases per 100,000 population also were observed in Washington DC, and the U.S. Virgin Islands.
Alternate Text: This figure is a map of the United States and U.S. territories that presents the rates per 100,000 population of diagnosed HIV cases in each state and territory in 2009.
Influenza-Associated Pediatric Mortality. Incidence* --- United States and U.S. territories, 2009
* Per 100,000 population.
During 2009, 45 states and New York City reported a total of 358 influenza-associated pediatric deaths to CDC for an overall incidence rate in the United States of 0.48 deaths per 100,000 children aged <18 years. The increase in rates, when compared with last year, and the state-to-state variation in rates were likely related to the incidence of 2009 A (H1N1) and small population size rather than true differences in disease burden.
Alternate Text: This figure is a map of the United States and U.S. territories that presents the incidence range per 100,000 population of influenza-associated pediatric deaths in each state and territory in 2009.
Legionellosis. Incidence,* by year --- United States, 1994--2009
* Per 100,000 population.
The incidence of legionellosis increased again in 2009, continuing a general increase that began in 2003. Factors contributing to this increase might include a true increase in disease transmission, greater use of diagnostic testing, and increased reporting.
Alternate Text: - This figure is a line graph that presents the incidence per 100,000 population of legionellosis cases in the United States from 1994 to 2009.
Listeriosis. Incidence* --- United States and U.S. territories, 2009
* Per 100,000 population.
Listeriosis is primarily foodborne and occurs most frequently among older adults or persons who are pregnant or immunocompromised. Although the infection is relatively uncommon, listeriosis is a leading cause of death attributable to foodborne illness in the United States. Recent outbreaks have been linked to Mexican-style cheese.
Alternate Text: - This figure is a map of the United States and U.S. territories that presents the incidence range per 100,000 population of listeriosis cases in each state and territory in 2009.
Lyme Disease. Incidence* of reported confirmed cases, by county --- United States, 2009
* Per 100,000 population.
Approximately 90% of confirmed Lyme disease cases are reported from states in the northeastern and upper midwestern United States. A rash that can be confused with early Lyme disease sometimes occurs following bites of the lone star tick (Amblyomma americanum). These ticks, which do not transmit the Lyme disease bacterium, are common human-biting ticks in southern and southeastern United States.
Alternate Text: This figure is a map of the United States that presents the incidence per 100,000 population of lyme disease cases in each county in 2009.
Malaria. Incidence,* by year --- United States, 1995--2009
* Per 100,000 population.
Malaria incidence has remained relatively stable.
Alternate Text: This figure is a line graph that presents the incidence per 100,000 population of malaria cases in the United States from 1995 to 2009.
Measles. Incidence,* by year --- United States, 1974--2009
* Per 100,000 population.
Measles vaccine was licensed in 1963. Evidence suggests that measles is no longer endemic in the United States.
Alternate Text: This figure is a line graph that presents the incidence per 100,000 population of measles cases in the United States from 1974 to 2009.
Meningococcal disease. Incidence,* by year --- United States, 1979--2009
* Per 100,000 population.
Meningococcal disease incidence remained low in 2009, but it continues to cause substantial morbidity and mortality in the United States. The highest incidence of meningococcal disease occurs among infants, with a second peak occurring in late adolescence. In 2005, a quadrivalent (A, C, Y, W-135) meningococcal conjugate vaccine was licensed and recommended for adolescents and others at increased risk for disease. In 2009, coverage with meningococcal conjugate vaccine was 53.6% among adolescents aged 13--17 years in the United States.
Alternate Text: This figure is a line graph that presents the incidence per 100,000 population of meningococcal disease cases in the United States from 1979 to 2009.
Mumps. Incidence,* by year --- United states, 1984--2009
* Per 100,000 population.
The widespread use of a second dose of mumps vaccine in 1990 was followed by historically low morbidity until 2006, when the United States experienced the largest mumps outbreak in two decades. The 2006 outbreak of more than 6,000 cases in the Midwest affected primarily college students aged 18--24 years. A second large outbreak began in 2009 and affected Orthodox Jewish communities in the Northeast.
Alternate Text: This figure is a line graph that presents the incidence per 100,000 population of mumps cases in the United States from 1984 to 2009.
PERTUSSIS. Incidence,* by year --- United States, 1979--2009
* Per 100,000 population.
Although the incidence of reported pertussis has decreased since the peak in 2004, incidence increased during 2008--2009 and continues to remain higher than in the 1990s.
Alternate Text: This figure is a line graph that presents the incidence per 100,000 population of pertussis cases in the United States from 1979 to 2009.
PERTUSSIS. Number of reported cases,* by age group --- United States, 2009
* Of 16,858 cases, age was reported unknown for 187 persons.
Infants, especially those who are too young to be fully vaccinated, are at increased risk for severe disease and death from pertussis. A large proportion of reported cases is also observed among school-aged children and adolescents, and the contribution of cases in children aged 7--10 years appears to be increasing compared with previous years.
Alternate Text: This figure is a bar chart that presents the number of pertussis cases, broken down by age group from <1 year to ≥60 years, in the United States in 2009.
Q Fever, acUTE AND CHRONIC. Number of reported cases* --- United States and U.S. territories, 2009
* Number of Q fever acute cases/Q fever chronic cases. Numbers displayed with no forward slash are Q fever acute cases.
Q fever, caused by Coxiella burnetii, is reported throughout the United States. Human cases occur as a result of human interaction with livestock, especially sheep, goats, and cattle. Although relatively few human cases are reported annually, the disease is believed to be substantially underreported because of its nonspecific presentation and the subsequent failure to suspect infection and request appropriate diagnostic tests.
Alternate Text: This figure is a map of the United States and U.S. territories that presents the number of acute and chronic Q fever cases in each state and territory in 2009.
Rabies, Animal. Number of reported cases among wild and domestic animals,* by year --- United States and Puerto Rico, 1979--2009
* Data from the Division of Vector-Borne Infectious Diseases, National Center for Emerging and Zoonotic Infectious Diseases (NCZVED).
† In thousands.
The proportion of rabid animals among those tested has demonstrated a downward trend from 6.1% in 2006 to 5.6% in 2009. Despite an overall decrease in the number of rabid animals submitted for testing during 2009, bats remained the second most submitted animals for rabies testing and behind only raccoons in total reported rabid animals. The raccoon rabies virus variant remains responsible for the majority of reported rabid animals, but increases in rabid animals attributable to skunk rabies virus variants were reported during 2009.
Alternate Text: This figure is a line graph that presents the number of rabies cases among wild and domestic animals in the United States and Puerto Rico from 1979 to 2009.
Rocky Mountain Spotted Fever. Number of reported cases, by county --- United States, 2009
Rocky Mountain spotted fever, caused by Rickettsia rickettsii, is reported throughout much of the United States, reflecting the widespread ranges of the primary tick vectors responsible for transmission (primarily Dermacentor variabilis in the East and Dermacentor andersonii in the West, but also Rhipicephalus sanguineus in some newly recognized focal areas).
Alternate Text: This figure is a map of the United States that presents the number of Rocky Mountain spotted fever cases in each county in 2009.
Rubella. Incidence,* by year --- United States, 1979--2009
* Per 100,000 population.
Rubella vaccine was licensed in 1969. Evidence suggests that rubella is no longer endemic in the United States.
Alternate Text: This figure is a line graph that presents the incidence per 100,000 population of rubella cases in the United States from 1979 to 2009.
Salmonellosis and Shigellosis. Number* of reported cases, by year --- United States, 1979--2009
* In thousands.
The reported number of cases of salmonellosis and shigellosis has remained relatively stable during the past 2 decades. During 2009, multistate outbreaks of Salmonella were linked to aquatic frogs and the consumption of alfalfa sprouts, pistachios, and peanut butter.
Alternate Text: This figure is a line graph that presents the number of salmonellosis and shigellosis cases in the United States from 1979 to 2009.
Shiga toxin-producing Escherichia coli (STEC). Number of reported cases --- United States and U.S. territories, 2009
Escherichia coli O157:H7 is the serotype of Shiga toxin-producing E. coli (STEC) isolated most commonly identified in outbreaks and is the most common cause of hemolytic uremic syndrome (HUS), a condition associated with kidney failure. Other STEC serotypes also cause diarrhea and HUS. From 2008 to 2009 the number of reported STEC cases decreased from 5,309 to 4,643.
Alternate Text: This figure is a map of the United States and U.S. territories that presents the number of Shiga-toxin producing Escherichia coli cases in each state and territory in 2009.
Syphilis, Congenital. Incidence* among infants aged <1 year --- United States, 1979--2009
* Per 100,000 live births.
Following a decline in the incidence of congenital syphilis since 1991, overall congenital syphilis rates decreased slightly from 2008 to 2009, from 10.4 to 10.0 cases per 100,000 live births.
Alternate Text: This figure is a line graph that presents the incidence per 100,000 population of congenital syphilis cases among infants aged <1 year in the United States in 2009.
Syphilis, Primary and Secondary. Incidence* --- United States and U.S. territories, 2009
* Per 100,000 population.
In 2009, the primary and secondary syphilis rate in the United States and territories (Guam, Puerto Rico, and Virgin Islands) was 4.6 cases per 100,000 population.
Alternate Text: This figure is a map of the United States and U.S. territories that presents the incidence per 100,000 population of primary and secondary syphilis cases in each state and territory in 2009.
Syphilis, Primary and Secondary. Incidence*, by sex --- United States, 1994--2009
* Per 100,000 population.
During 2008--2009, the incidence of primary and secondary syphilis in the United States increased from 4.4 to 4.6 cases (women: decreased from 1.5 to 1.4; men: increased from 7.5 to 7.8) per 100,000 population.
Alternate Text: This figure is a line graph that presents the incidence per 100,000 population of primary and secondary syphilis cases among men and women in the United States from 1994 to 2009.
Syphilis, Primary and Secondary. Incidence,* by race/ethnicity --- United States, 1994--2009
* Per 100,000 population.
† Y-axis is log scale.
During 2008--2009, incidence of primary and secondary syphilis increased among all races/ethnicities except non-Hispanic whites and Hispanics. Incidence per 100,000 population increased from 17.2 to 19.2 among non-Hispanic blacks; from 1.5 to 1.6 among Asians/Pacific Islanders; from 2.3 to 2.4 among American Indians/Alaska Natives; and decreased from 2.2 to 2.1 among non-Hispanic whites and 4.6 to 4.5 among Hispanics.
Alternate Text: - This figure is a line graph that presents the incidence per 100,000 population of primary and secondary syphilis cases by race/ethnicity in the United States from 1994 to 2009. The race/ethnicities include black non-Hispanic, white non-Hispanic, American Indian/Alaska Native non-Hispanic, Asian/Pacific Islander non-Hispanic, and Hispanic.
Trichinellosis. Number of reported cases, by year --- United States, 1979--2009
Five of the cases reported in 2009 were associated with a shared meal containing raw bear meat. The outbreak occurred among persons of the same ethnic background as the raw bear meat-associated outbreak in 2008 that sickened approximately 30 persons. This highlights the continued need for public health prevention messages aimed at consumers of wild game meat, particularly bear, and for prevention messages targeted to cultural groups whose food choices might put them at a higher risk for Trichinella infection.
Alternate Text: This figure is a line graph that presents the number of trichinellosis cases in the United States from 1979 to 2009.
Tuberculosis. Incidence* --- United States and U.S. territories, 2009
* Per 100,000 population.
Thirteen states and the District of Columbia had an incidence rate above the national average at 3.8 cases per 100,000.
Alternate Text: This figure is a map of the United States and U.S. territories that presents the incidence range per 100,000 population of tuberculosis cases in each state and territory in 2009.
Tuberculosis. Number of reported cases among U.S.-born and foreign-born persons,* by year --- United States, 1999--2009
* For 120 cases, origin of patients was unknown.
† In thousands
Fifty-nine percent (N=6,854) of all TB cases in 2009 occurred in persons who were foreign-born. The number of cases in foreign-born persons has remained stable since 1999. The number of U.S.-born cases continues to decline.
Alternate Text: This figure is a line graph that presents the number of cases of tuberculosis cases, separated by U.S.-born and foreign-born persons, in the United States from 1999 to 2009.
Tuberculosis. Incidence,* by race/ethnicity --- United States, 1999--2009
* Per 100,000 population.
Although 2009 TB cases reached all-time lows in the United States, disproportionately high rates of TB continue among racial/ethnic minorities, especially among U.S.-born blacks. To achieve TB elimination, programs are needed to address the persistent disparities that exist between whites and minorities in the United States.
Alternate Text: This figure is a line graph that presents the incidence per 100,000 population of tuberculosis cases by race/ethnicity in the United States from 1999 to 2009. The race/ethnicities include black non-Hispanic, white non-Hispanic, American Indian/Alaska Natives non-Hispanic, Asian/Pacific Islanders non-Hispanic, and non-Hispanic.
Tularemia. Number of reported cases --- United States and U.S. territories, 2009
To better define the geographic distribution of Francisella tularensis subspecies, CDC requests that isolates be forwarded to the CDC laboratory in Fort Collins, Colorado.
Alternate Text: This figure is a map of the United States and U.S. territories that presents the number of tularemia cases in each state and territory in 2009.
Typhoid fever. Number of reported cases, by year --- United States, 1979--2009
Typhoid fever in the United States is primarily a disease of travelers, for whom vaccination against typhoid fever is recommended. Emerging resistance to fluoroquinolone antimicrobial agents has complicated the clinical management of cases of typhoid and paratyphoid fever.
Alternate Text: This figure is a line graph that presents the number of cases of typhoid fever in the United States from 1979 to 2009.
Varicella (ChickenPox). Number of reported cases --- Illinois, Michigan, Texas, and West Virginia*, 1993--2009
* Source: CDC. National Center for Immunization and Respiratory Diseases.
† In thousands.
In four states (Michigan, Illinois, Texas, and West Virginia), the number of cases reported in 2009 was 36% lower than 2008 and 88% less than the number reported during the prevaccine years 1993--1995.
Alternate Text: This figure is a line graph that presents the number of cases of varicella, also know as chickenpox, in Illinois, Michigan, Texas, and West Virginia from 1993 to 2009.
Vibriosis. Number of reported cases --- United States and U.S. territories, 2009
Infections caused by noncholera Vibrio organisms became nationally notifiable in January 2007. Infections are acquired through consumption of contaminated seafood, particularly oysters, or by contact of broken skin with salt water containing Vibrio organisms.
Alternate Text: This figure is a map of the United States and U.S. territories that presents the number of cases of virbriosis in each state and territory in 2009.
PART 3
Historical Summaries of Notifiable Diseases in the United States, 1978--2009
Abbreviations and Symbols Used in Tables
NA Data not available.
--- No reported cases.
Notes: Rates <0.01 after rounding are listed as 0.
Data in the MMWR Summary of Notifiable Diseases --- United States, 2009 might not match data in other CDC surveillance reports because of differences in the timing of reports, the source of the data, and the use of different case definitions.
TABLE 7. Reported incidence* of notifiable diseases --- United States, 1999--2009
Disease
1999
2000
2001
2002
2003
2004
2005
2006
2007
2008
2009
AIDS
16.66
14.95
14.88
15.29
15.36
15.28
14.00
12.87
12.53
13.00
†
Anthrax
---
0
0.01
0
---
---
---
0
0
0
0
Arboviral diseases
California serogroup virus disease
neuroinvasive
---
---
---
---
---
---
0.02
0.02
0.02
0.02
0.02
nonneuroinvasive
§
§
§
§
§
§
0
0
0
0
0
Eastern equine encephalitis virus disease
neuroinvasive
---
---
---
---
---
---
0
0
0
0
0
nonneuroinvasive
§
§
§
§
§
§
0
0
0
0
0
Powassan virus disease
neuroinvasive
---
---
---
---
---
---
0
0
0
0
0
nonneuroinvasive
§
§
§
§
§
§
0
0
0
0
---
St. Louis encephalitis virus disease
neuroinvasive
---
---
---
---
---
---
0
0
0
0
0
nonneuroinvasive
§
§
§
§
§
§
0
0
0
0
0
West Nile virus disease
neuroinvasive
---
---
---
---
---
---
0.45
0.50
0.41
0.23
0.13
nonneuroinvasive
§
§
§
§
§
§
0.58
0.94
0.80
0.22
0.11
Western equine encephalitis virus disease
neuroinvasive
---
---
---
---
---
---
---
---
---
---
---
nonneuroinvasive
§
§
§
§
§
§
---
---
---
---
---
Botulism, total (includes wound and unspecified)
0.06
0.05
0.06
0.03
0.01
0.02
0.01
0.02
0.05
0.05
0.04
foodborne
0.01
0.01
0.01
0
0.01
0.01
0.01
0.01
0.01
0.01
0
infant
2.43
2.44
2.55
1.79
1.87
2.12
2.09
2.35
2.05
2.56
1.92
Brucellosis
0.03
0.03
0.05
0.04
0.04
0.04
0.04
0.04
0.04
0.03
0.04
Chancroid
0.06
0.03
0.01
0.02
0.02
0
0.01
0.01
0.01
0.01
0.01
Chlamydia trachomatis genital infection
254.10
257.76
278.32
296.55
304.71
319.61
332.51
347.80
370.20
401.34
409.19
Cholera
0
0
0
0
0
0
0
0
0
0
0
Coccidioidomycosis
3.58
4.69
6.71
3.03
2.57
4.14
6.24
6.79
14.39
7.76
13.24
Cryptosporidiosis¶
0.92
1.17
1.34
1.07
1.22
1.23
1.93
2.05
3.73
3.02
2.52
confirmed
¶
¶
¶
¶
¶
¶
¶
¶
¶
¶
2.43
probable
¶
¶
¶
¶
¶
¶
¶
¶
¶
¶
0.09
Cyclosporiasis
0.07
0.03
0.07
0.06
0.03
0.14
0.24
0.06
0.04
0.05
0.05
Diphtheria
0
0
0
0
0
---
---
---
---
---
---
Ehrlichiosis
human granulocytic (HGE)
0.14
0.15
0.10
0.18
0.13
0.20
0.28
0.23
0.31
**
**
human monocytic (HME)
0.06
0.09
0.05
0.08
0.11
0.12
0.18
0.20
0.30
**
**
human (other and unspecified) ††
---
---
---
---
---
---
0.04
0.08
0.12
**
**
Ehrlichiosis/Anaplasmosis
Ehrlichia chaffeensis
§
§
§
§
§
§
§
§
§
0.35
0.34
Ehrlichia ewingii
§
§
§
§
§
§
§
§
§
0
0
Anaplasma phagocytophilum
§
§
§
§
§
§
§
§
§
0.43
0.42
Undetermined
§
§
§
§
§
§
§
§
§
0.06
0.06
Encephalitis/meningitis, arboviral§§
California serogroup virus
0.03
0.04
0.05
0.06
0.06
0
§§
§§
§§
§§
§§
Eastern equine virus
0
0
0
0
0
0
§§
§§
§§
§§
§§
Powassan virus
§
§
§
0
0
0
§§
§§
§§
§§
§§
St. Louis virus
0
0
0.03
0.01
0.01
0
§§
§§
§§
§§
§§
West Nile virus
§
§
§
1.01
1.00
0.43
§§
§§
§§
§§
§§
Western equine virus
0
0
0
0
0
---
§§
§§
§§
§§
§§
Enterohemorrhagic Escherichia coli
O157:H7
1.77
1.74
1.22
1.36
0.93
0.87
0.89
§
§
§
§
non-O157
§
§
0.19
0.08
0.09
0.13
0.19
§
§
§
§
not serogrouped
§
§
0.06
0.02
0.05
0.13
0.16
§
§
§
§
Giardiasis
§
§
§
8.06
6.84
8.35
7.82
7.28
7.66
7.41
7.37
Gonorrhea
133.20
131.65
128.53
125.03
116.37
113.52
115.64
120.90
118.90
111.64
99.05
Haemophilus influenzae, invasive disease
all ages, serotypes
0.48
0.51
0.57
0.62
0.70
0.72
0.78
0.82
0.85
0.96
0.99
age<5 yrs
serotype b
§
§
§
0.18
0.16
0.03
0.04
0.14
0.11
0.14
0.18
nonserotype b
§
§
§
0.75
0.59
0.04
0.67
0.86
0.97
1.18
1.17
unknown serotype
§
§
§
0.80
1.15
0.97
1.08
0.88
0.88
0.79
0.79
Hansen disease (Leprosy)
0.04
0.04
0.03
0.04
0.03
0.04
0.03
0.03
0.04
0.03
0.04
Hantavirus pulmonary syndrome
§
0.02
0
0.01
0.01
0.01
0.01
0.01
0.01
0.01
0.01
Hemolytic uremic syndrome
postdiarrheal
§
0.10
0.08
0.08
0.06
0.07
0.08
0.11
0.10
0.12
0.09
TABLE 7. (Continued) Reported incidence* of notifiable diseases --- United States, 1999--2009
Disease
1999
2000
2001
2002
2003
2004
2005
2006
2007
2008
2009
Hepatitis, viral, acute
A
6.25
4.91
3.77
3.13
2.66
1.95
1.53
1.21
1.00
0.86
0.65
B
2.82
2.95
2.79
2.84
2.61
2.14
1.78
1.62
1.51
1.34
1.12
C
1.14
1.17
1.41
0.65
0.38
0.31
0.23
0.26
0.28
0.29
0.27
HIV diagnoses†
---
---
---
---
---
---
---
---
---
---
12.13
Influenza-associated pediatric mortality
§
§
§
§
§
§
0.02
0.07
0.10
0.12
0.48
Legionellosis
0.41
0.42
0.42
0.47
0.78
0.71
0.78
0.96
0.91
1.05
1.16
Listeriosis
0.31
0.29
0.22
0.24
0.24
0.32
0.31
0.30
0.27
0.25
0.28
Lyme disease¶¶
5.99
6.53
6.05
8.44
7.39
6.84
7.94
6.75
9.21
11.67
12.71
confirmed
¶¶
¶¶
¶¶
¶¶
¶¶
¶¶
¶¶
¶¶
¶¶
9.59
9.85
probable
¶¶
¶¶
¶¶
¶¶
¶¶
¶¶
¶¶
¶¶
¶¶
2.08
2.80
Malaria
0.61
0.57
0.55
0.51
0.49
0.51
0.51
0.50
0.47
0.42
0.48
Measles
0.04
0.03
0.04
0.02
0.02
0.01
0.02
0.02
0.01
0.05
0.02
Meningococcal disease, invasive
all serogroups
0.92
0.83
0.83
0.64
0.61
0.47
0.42
0.40
0.36
0.39
0.32
serogroup A,C,Y, and W-135
***
***
***
***
***
***
0.10
0.11
0.11
0.11
0.10
serogroup B
***
***
***
***
***
***
0.05
0.07
0.06
0.06
0.06
other serogroup
***
***
***
***
***
***
0.01
0.01
0.01
0.01
0.01
serogroup unknown
***
***
***
***
***
***
0.26
0.22
0.18
0.20
0.16
Mumps
0.14
0.13
0.10
0.10
0.08
0.09
0.11
2.22
0.27
0.15
0.65
Novel influenza A virus infections
§
§
§
§
§
§
§
§
0
0
14.37
Pertussis
2.67
2.88
2.69
3.47
4.04
8.88
8.72
5.27
3.49
4.40
5.54
Plague
0
0
0
0
0
0
0
0.01
0
0
0
Poliomyelitis, paralytic
0
0
0
0
0
0
0
0
---
---
0
Poliovirus infection, nonparalytic
§
§
§
§
§
§
§
§
---
---
---
Psittacosis
0.01
0.01
0.01
0.01
0
0
0.01
0.01
0
0
0
Q Fever†††
0
0.01
0.01
0.02
0.02
0.03
0.05
0.06
0.06
0.04
0.04
acute
†††
†††
†††
†††
†††
†††
†††
†††
†††
0.04
0.03
chronic
†††
†††
†††
†††
†††
†††
†††
†††
†††
0
0.01
Rabies, human
0
0
0
0
0
0
0
0
0
0
0
Rocky Mountain spotted fever§§§
0.21
0.18
0.25
0.39
0.38
0.60
0.66
0.80
0.77
0.85
0.60
confirmed
§§§
§§§
§§§
§§§
§§§
§§§
§§§
§§§
§§§
0.06
0.05
probable
§§§
§§§
§§§
§§§
§§§
§§§
§§§
§§§
§§§
0.78
0.55
Rubella
0.21
0.06
0.01
0.01
0
0
0
0
0
0.01
0
Rubella, congenital syndrome
0
0
0
0
0
0
0
0
---
---
0
Salmonellosis
14.89
14.51
14.39
15.73
15.16
14.47
15.43
15.45
16.03
16.92
16.18
(SARS-CoV)¶¶¶
§
§
§
§
0
---
---
---
---
---
---
Shigellosis
6.43
8.41
7.19
8.37
8.19
4.99
5.51
5.23
6.60
7.50
5.24
Shiga toxin-producing E. coli (STEC)
§
§
§
§
§
§
§
1.71
1.62
1.76
1.53
Smallpox
§
§
§
§
§
---
---
---
---
---
---
Streptococcal disease, invasive, group A
0.87
1.45
1.60
1.69
2.04
1.82
2.00
2.24
1.89
2.30
2.13
Streptococcal, toxic shock syndrome
0.02
0.04
0.04
0.05
0.06
0.06
0.07
0.06
0.06
0.07
0.08
Streptococcus pneumoniae, Invasive disease
drug resistant, all ages
2.39
2.77
2.11
1.14
0.99
1.49
1.42
2.19
1.49
1.60
1.75
age <5 yrs
---
---
---
---
---
---
---
---
3.73
3.51
4.54
non-drug resistant, age <5 yrs
§
§
1.03
3.62
8.86
8.22
8.21
11.93
13.59
13.36
12.93
Syphilis, congenital (age <1 yr)
14.62
14.29
12.52
11.44
10.56
9.12
8.24
9.07
10.46
10.12
9.90
Syphilis, primary and secondary
2.50
2.19
2.17
2.44
2.49
2.71
2.97
3.29
3.83
4.48
4.60
Syphilis, total, all stages
13.07
11.58
11.45
11.68
11.90
11.94
11.33
12.46
13.67
15.34
14.74
Tetanus
0.01
0.01
0.01
0.01
0.01
0.01
0.01
0.01
0.01
0.01
0.01
Toxic-shock syndrome
0.05
0.06
0.05
0.05
0.05
0.04
0.04
0.05
0.04
0.03
0.03
Trichinellosis
0
0.01
0.01
0.01
0
0
0.01
0.01
0
0.01
0
Tuberculosis
6.43
6.01
5.68
5.36
5.17
5.09
4.80
4.65
4.44
4.28
3.80
Tularemia
§
0.06
0.05
0.03
0.04
0.05
0.05
0.03
0.05
0.04
0.03
Tyhoid fever
0.13
0.14
0.13
0.11
0.12
0.11
0.11
0.12
0.14
0.15
0.13
Vancomycin-intermediate Staphylococcus aureus
§
§
§
§
§
---
0
0
0.02
0.03
0.03
Vancomycin-resistant Staphylococcus aureus
§
§
§
§
§
0
0
0
0
0
0
Varicella (Chickenpox)****
44.56
26.18
19.51
10.27
7.27
18.41
19.64
28.65
18.68
13.56
8.71
Vibriosis
§
§
§
§
§
§
§
§
0.25
0.24
0.30
Yellow fever
0
---
0
0
---
---
---
---
---
---
---
* Per 100,000 population.
† In 2008 CDC published a revised HIV case definition. This combined separate surveillance case definitions for HIV infection and AIDS into a single case definition for HIV infection that includes AIDS (and incorporates the HIV infection classification system). The revised HIV case definition provides a more complete presentation of the HIV epidemic on a population level. Please see the Centers for Disease Control and Prevention revised surveillance case definitions for HIV infection among adults, adolescents, and children aged <18 months and for HIV infection and AIDS among children aged 18 months to <13 years---United States, 2008. MMWR 2008;57(No.RR-10):1--12. These case counts can be found under "HIV Diagnoses" in this table. The total number of HIV Diagnoses includes all cases reported to the Division of HIV/AIDS Prevention, National Center for HIV/AIDS, Viral Hepatitis, STD, and TB Prevention (NCHHSTP), through December 31, 2009. AIDS: Acquired Immunodeficiency Syndrome. HIV: Human Immunodeficiency Virus.
§ Not nationally notifiable.
¶ Revision of National Surveillance Case Definition distinguishing between confirmed and probable cases.
** In January 2008, human granulocytic ehrlichiosis (HGE) was replaced by Anaplasma phagocytophilum infection, human monocytic ehrlichiosis was replaced by Ehrlicia chaffeensis infection, and human ehrlichiosis (other and unspecified) was replaced by Ehrlicia ewingii infection. Refer to Ehrlichiosis/Anaplasmosis.
†† Data for ehrlichiosis attributable to other or unspecified agents were being withheld from publication pending the outcome of discussions concerning the reclassification of certain Ehrlichia species, which will probably affect how data in this category were reported.
§§ See also "Arboviral Diseases" incidence rates. In 2005, the arboviral disease surveillance case definitions and categories were revised. The nationally notifiable arboviral encephalitis and meningitis conditions continued to be nationally notifiable in 2005 and 2006, but under the category of arboviral neuroinvasive disease. In addition, in 2005, nonneuroinvasive domestic arboviral disesases for the six domestic arboviruses listed above were added to the list of nationally notifiable diseases.
¶¶ National surveillance case definition revised in 2008; probable cases not previously reported.
*** To help public health specialists monitor the impact of the new meningococcal conjugate vaccine (Menactra(r), licensed in the United States in January 2005), the data display for meningococcal disease was modified to differentiate the fraction of the disease that is vaccine preventable (serogroups A,C,Y, W-135) from the non-preventable fraction of disease (serogroup B and others).
††† In 2008, Q fever acute and chronic reporting categories were recognized as a result of revision to the Q fever case definition. Before that time, case counts were not differentiated relative to acute and chronic Q fever cases.
§§§ Revision of National Surveillance Case Definition distinguishing between confirmed and probable cases; total case count includes two case reports with unknown case status.
¶¶¶ Severe acute respiratory syndrome-associated coronavirus disease.
**** Varicella became a nationally notifiable disease in 2003.
TABLE 8. Reported cases of notifiable diseases --- United States, 2002--2009
TABLE 8. (Continued) Reported cases of notifiable diseases --- United States, 2002--2009
Disease
2002
2003
2004
2005
2006
2007
2008
2009
Giardiasis
21,206
19,709
20,636
19,733
18,953
19,417
18,908
19,399
Gonorrhea**
351,852
335,104
330,132
339,593
358,366
355,991
336,742
301,174
Haemophilus influenzae, invasive disease
all ages, serotypes
1,743
2,013
2,085
2,304
2,496
2,541
2,886
3,022
age <5 yrs
serotype b
34
32
19
9
29
22
30
38
nonserotype b
144
117
135
135
175
199
244
245
unknown serotype
153
227
177
217
179
180
163
166
Hansen disease (Leprosy)
96
95
105
87
66
101
80
103
Hantavirus pulmonary syndrome
19
26
24
26
40
32
18
20
Hemolytic uremic syndrome, postdiarrheal
216
178
200
221
288
292
330
242
Hepatitis, viral, acute†††
A
8,795
7,653
5,683
4,488
3,579
2,979
2,585
1,987
B
7,996
7,526
6,212
5,119
4,713
4,519
4,033
3,405
C
1,835
1,102
720
652
766
845
877
782
HIV diagnoses†
---
---
---
---
---
---
---
36,870
Influenza-associated pediatric mortality§§§
¶
¶
¶
45
43
77
90
358
Legionellosis
1,321
2,232
2,093
2,301
2,834
2,716
3,181
3,522
Listeriosis
665
696
753
896
884
808
759
851
Lyme disease, total¶¶¶
23,763
21,273
19,804
23,305
19,931
27,444
35,198
38,468
confirmed
¶¶¶
¶¶¶
¶¶¶
¶¶¶
¶¶¶
¶¶¶
28,921
29,959
probable
¶¶¶
¶¶¶
¶¶¶
¶¶¶
¶¶¶
¶¶¶
6,277
8,509
Malaria
1,430
1,402
1,458
1,494
1,474
1,408
1,255
1,451
Measles
44
56
37
66
55
43
140
71
Meningococcal disease, invasive****
all serogroups
1,814
1,756
1,361
1,245
1,194
1,077
1,172
980
serogroup A, C, Y, and W-135
---
---
---
297
318
325
330
301
serogroup B
---
---
---
156
193
167
188
174
other serogroup
---
---
---
27
32
35
38
23
serogroup unknown
---
---
---
765
651
550
616
482
Mumps
270
231
258
314
6,584
800
454
1,991
Novel influenza A virus infection
¶
¶
¶
¶
¶
4
2
43,696
Pertussis
9,771
11,647
25,827
25,616
15,632
10,454
13,278
16,858
Plague
2
1
3
8
17
7
3
8
Poliomyelitis, paralytic ††††
---
---
---
1
---
---
---
1
Poliovirus infection, nonparalytic
---
---
---
---
---
---
---
---
Psittacosis
18
12
12
16
21
12
8
9
Q Fever §§§§
61
71
70
136
169
171
120
113
acute
§§§§
§§§§
§§§§
§§§§
§§§§
§§§§
106
93
chronic
§§§§
§§§§
§§§§
§§§§
§§§§
§§§§
14
20
Rabies
animal
7,609
6,846
6,345
5,915
5,534
5,862
4,196
5,343
human
3
2
7
2
3
1
2
4
Rocky Mountain spotted fever, total¶¶¶¶
1,104
1,091
1,713
1,936
2,288
2,221
2,563
1,815
confirmed
¶¶¶¶
¶¶¶¶
¶¶¶¶
¶¶¶¶
¶¶¶¶
¶¶¶¶
190
151
probable
¶¶¶¶
¶¶¶¶
¶¶¶¶
¶¶¶¶
¶¶¶¶
¶¶¶¶
2,367
1,662
Rubella
18
7
10
11
11
12
16
3
Rubella, congenital syndrome
1
1
---
1
1
---
---
2
Salmonellosis
44,264
43,657
42,197
45,322
45,808
47,995
51,040
49,192
SARS-CoV*****
¶
8
---
---
---
---
---
---
Shiga toxin--producing Escherichia coli (STEC)
¶
¶
¶
4,432
4,847
5,309
4,643
Shigellosis
23,541
23,581
14,627
16,168
15,503
19,758
22,625
15,931
Streptococcal disease, invasive, group A
4,720
5,872
4,395
4,715
5,407
5,294
5,674
5,279
Streptococcal toxic-shock syndrome
118
161
132
129
125
132
157
161
TABLE 8. (Continued) Reported cases of notifiable diseases --- United States, 2002--2009
Disease
2002
2003
2004
2005
2006
2007
2008
2009
Streptococcus pneumoniae invasive disease,
drug resistant, all ages
2,546
2,356
2,590
2,996
3,308
3,329
3,448
3,370
age < 5 yrs
---
---
---
---
---
563
532
583
nondrug resistant age <5 yrs
513
845
1,162
1,495
1,861
2,032
1,998
1988
Syphilis, all stages**
32,871
34,270
33,401
33,278
36,935
40,920
46,277
44,828
congenital (age <1 yr)
460
432
375
339
382
430
431
427
primary and secondary
6,862
7,177
7,980
8,724
9,756
11,466
13,500
13,997
Tetanus
25
20
34
27
41
28
19
18
Toxic-shock syndrome
109
133
95
90
101
92
71
74
Trichinellosis
14
6
5
16
15
5
39
13
Tuberculosis†††††
15,075
14,874
14,517
14,097
13,779
13,299
12,904
11,545
Tularemia
90
129
134
154
95
137
123
93
Typhoid fever
321
356
322
324
353
434
449
397
Vancomycin-intermediate Staphylococcus aureus
¶
¶
---
3
6
37
63
78
Vancomycin-resistant Staphylococcus aureus
¶
¶
1
2
1
2
---
1
Varicella (Chickenpox) §§§§§
22,841
20,948
32,931
32,242
48,445
40,146
30,386
20,480
Varicella (deaths) ¶¶¶¶¶
9
2
9
3
---
6
2
2
Vibriosis (noncholera Vibrio species infections)
¶
¶
¶
¶
¶
549
588
789
Yellow fever******
1
---
---
---
---
---
---
---
* Acquired Immunodeficiency syndrome (AIDS). The total number of AIDS cases includes all cases reported to the Division of HIV/AIDS Prevention, National Center for HIV/AIDS, Viral Hepatitis, STD, and TB Prevention (NCHHSTP).
† In 2008 CDC published a revised HIV case definition. This combined separate surveillance case definitions for HIV infection and AIDS into a single case definition for HIV infection that includes AIDS (and incorporates the HIV infection classification system). The revised HIV case definition provides a more complete presentation of the HIV epidemic on a population level. Please see the Centers for Disease Control and Prevention revised surveillance case definitions for HIV infection among adults, adolescents, and children aged <18 months and for HIV infection and AIDS among children aged 18 months to <13 years---United States, 2008. MMWR 2008;57(No.RR--10):1-12. These case counts can be found under "HIV Diagnoses" in this table. The total number of HIV Diagnoses includes all cases reported to the Division of HIV/AIDS Prevention, National Center for HIV/AIDS, Viral Hepatitis, STD, and TB Prevention (NCHHSTP), through December 31, 2009. HIV: Human Immunodeficiency Virus.
§ Totals reported to the Division of Vector-Borne Infectious Diseases, National Center for Emerging and Zoonotic Infectious Diseases (NCZVED) (ArboNET Surveillance), as of May 28, 2010.
¶ Not nationally notifiable
** Totals reported to the Division of STD Prevention, NCHHSTP, as of May 7, 2010.
†† Revision of national nurveillance case definition distinguishing between confirmed and probable cases.
§§ As of January 1, 2008, these categories were replaced with codes for Anaplasma phagocytophilum. Refer to Ehrlichiosis/Anaplasmosis.
¶¶ Data for ehrlichiosis attributable to other or unspecified agents were being withheld from publication pending the outcome of discussions concerning the reclassification of certain Ehrlichia species, which will probably affect how data in this category were reported.
*** See also "Arboviral Diseases" incidence rates. In 2005, the arboviral disease surveillance case definitions and categories were revised. The nationally notifiable arboviral encephalitis and meningitis conditions continued to be nationally notifiable in 2005 and 2006, but under the category of arboviral neuroinvasive disease. In addition, in 2005, nonneuroinvasive domestic arboviral disesases for the six domestic arboviruses listed above were added to the list of nationally notifiable diseases.
††† The anti--hepatitis C virus antibody test became available May 1990. Data on hepatitis B chronic, hepatitis B, perinatal infection, and hepatitis C, virus infection (past or present) are not included because they are undergoing data quality review.
§§§ Totals reported to the Division of Influenza, National Center for Immunization and Respiratory Diseases (NCIRD), as of December 31, 2009.
¶¶¶ National surveillance case definition revised in 2008; probable cases not previously reported.
**** To help public health specialists monitor the impact of the new meningococcal conjugate vaccine (Menactra(r), licensed in the United States in January 2005), the data display for meningococcal disease was modified to differentiate the fraction of the disease that is potentially vaccine preventable (serogroups A, C, Y, W-135) from the non-vaccine preventable fraction of disease (serogroup B and others).
†††† Cases of vaccine-associated paralytic poliomyelitis caused by polio vaccine virus. Numbers might not reflect changes based on retrospective case evaluations or late reports (CDC. Poliomyelitis United States, 1975--1984. MMWR 1986;35:180--2).
§§§§ In 2008, Q fever acute and chronic reporting categories were recognized as a result of revision to the Q fever case definition. Before that time, case counts were not differentiated relative to acute and chronic Q fever cases.
¶¶¶¶ Revision of national surveillance case definition distinguishing between confirmed and probable cases; total case count includes two case reports with unknown case status.
***** Severe acute respiratory syndrome (SARS)-associated coronavirus disease. The total number of SARS-CoV cases includes all cases reported to the Division of Viral Diseases, Coordinating Center for Infectious Diseases.
††††† Totals reported to the Division of Tuberculosis Elimination, NCHHSTP, as of May 14, 2010.
§§§§§ Varicella was removed from the nationally notifiable disease list in 1981. Varicella became nationally notifiable again in 2003.
¶¶¶¶¶ Totals reported to the Division of Viral Diseases, NCIRD, as of June 30, 2010.
****** The last indigenous case of yellow fever was reported in 1911; all other case reports since 1911 have been imported.
TABLE 9. Reported cases of notifiable diseases --- United States, 1994--2001
Haemophilus influenzae, invasive disease all ages, serotypes
1,174
1,180
1,170
1,162
1,194
1,309
1,398
1,597
Hansen disease (Leprosy)
136
144
112
122
108
108
91
79
Hantavirus pulmonary syndrome
†
---
NA
NA
NA
33
41
8
Hemolytic uremic syndrome, postdiarrheal
†
72
97
91
119
181
249
202
Hepatitis, viral, acute
A
26,796
31,582
31,032
30,021
23,229
17,047
13,397
10,609
B
12,517
10,805
10,637
10,416
10,258
7,694
8,036
7,843
C/non-A, non-B**
4,470
4,576
3,716
3,816
3,518
3,111
3,197
3,976
unspecified
444
†
†
†
†
†
†
†
Legionellosis
1,615
1,241
1,198
1,163
1,355
1,108
1,127
1,168
Leptospirosis
38
†
†
†
†
†
†
†
Listeriosis
†
†
†
†
†
†
755
613
Lyme disease
13,043
11,700
16,455
12,801
16,801
16,273
17,730
17,029
Lymphogranuloma venereum
235
†
†
†
†
†
†
†
TABLE 9. (Continued) Reported cases of notifiable diseases --- United States, 1994--2001
Disease
1994
1995
1996
1997
1998
1999
2000
2001
Malaria
1,229
1,419
1,800
2,001
1,611
1,666
1,560
1,544
Measles
963
309
508
138
100
100
86
116
Meningococcal disease, invasive
2,886
3,243
3,437
3,308
2,725
2,501
2,256
2,333
Mumps
1,537
906
751
683
666
387
338
266
Pertussis
4,617
5,137
7,796
6,564
7,405
7,288
7,867
7,580
Plague
17
9
5
4
9
9
6
2
Poliomyelitis, paralytic
8
7
7
6
3
2
---
---
Psittacosis
38
64
42
33
47
16
17
25
Q Fever
†
†
†
†
†
†
21
26
Rabies
animal
8,147
7,811
6,982
8,105
7,259
6,730
6,934
7,150
human
6
5
3
2
1
---
4
1
Rheumatic fever, acute
112
†
†
†
†
†
†
†
Rocky Mountain spotted fever
465
590
831
409
365
579
495
695
Rubella
227
128
238
181
364
267
176
23
Rubella, congenital syndrome
7
6
4
5
7
9
9
3
Salmonellosis, excluding typhoid fever
43,323
45,970
45,471
41,901
43,694
40,596
39,574
40,495
Shigellosis
29,769
32,080
25,978
23,117
23,626
17,521
22,922
20,221
Streptococcal disease, invasive, Group A
†
613
1,445
1,973
2,260
2,667
3,144
3,750
Streptococcal toxic-shock syndrome
†
10
19
33
58
65
83
77
Streptococcus pneumoniae, invasive disease
drug-resistant, all ages
†
309
1,514
1,799
2,823
4,625
4,533
2,896
nondrug resistant, age <5 yrs
†
†
†
†
†
†
†
498
Syphilis
total, all stages§
81,696
68,953
52,976
46,540
37,977
35,628
31,575
32,221
congenital (age <1 yr)§
2,452
1,863
1,282
1,081
843
579
580
504
primary and secondary§
20,627
16,500
11,387
8,550
6,993
6,657
5,979
6,103
Tetanus
51
41
36
50
41
40
35
37
Toxic-shock syndrome
192
191
145
157
138
113
135
127
Trichinellosis
32
29
11
13
19
12
16
22
Tuberculosis††
24,361
22,860
21,337
19,851
18,361
17,531
16,377
15,989
Tularemia
96
†
†
†
†
†
142
129
Typhoid fever
441
369
396
365
375
346
377
368
Varicella§§
151,219
120,624
83,511
98,727
82,455
46,016
27,382
22,536
Yellow Fever¶¶
---
---
1
---
---
---
---
---
* Acquired immunodeficiency syndrome.
† Not nationally notifiable.
§ Cases were reported to the Division of STD Prevention, National Center for HIV/AIDS, Viral Hepatitis, STD, and TB Prevention (NCHHSTP).
¶ Data for ehrlichiosis attributable to other or unspecified agents were being withheld from publication pending the outcome of discussions concerning the reclassification of certain Ehrlichia species, which will probably affect how data in this category were reported
** The anti-hepatitis C virus antibody test became available in May 1990.
†† Cases were updated through the Division of TB Elimination, NCHHSTP.
§§ Varicella was removed from the nationally notifiable disease list in 1981. Certain states continued to report these cases to CDC.
¶¶ The last indigenous case of yellow fever was reported in 1911; all other case reports since 1911 have been imported.
TABLE 10. Reported cases of notifiable diseases* --- United States, 1986--1993
Disease
1986
1987
1988
1989
1990
1991
1992
1993
AIDS†
12,932
21,070
31,001
33,722
41,595
43,672
45,472
103,691
Amebiasis
3,532
3,123
2,860
3,217
3,328
2,989
2,942
2,970
Anthrax
---
1
2
---
---
---
1
---
Aseptic meningitis
11,374
11,487
7,234
10,274
11,852
14,526
12,223
12,848
Botulism, total (including wound and unspecified)
109
82
84
89
92
114
91
97
foodborne
23
17
28
23
23
27
21
27
infant
79
59
50
60
65
81
66
65
Brucellosis
106
129
96
95
82
104
105
120
Chancroid
3,756
4,998
5,001
4,692
4,212
3,476
1,886
1,399
Cholera
23
6
8
---
6
26
103
18
Diphtheria§
---
3
2
3
4
5
4
---
Encephalitis, primary
1,302
1,418
882
981
1,341
1,021
774
919
Postinfectious¶
124
121
121
88
105
82
129
170
Gonorrhea
900,868
780,905
719,536
733,151
690,169
620,478
501,409
439,673
Granuloma inguinale
61
22
11
7
97
29
6
19
Haemophilus influenzae, invasive disease all ages, serotypes
**
**
**
**
**
**
1,412
1,419
Hansen disease (Leprosy)
270
238
184
163
198
154
172
187
Hepatitis, viral, acute
A
23,430
25,280
28,507
35,821
31,441
24,378
23,112
24,238
B
26,107
25,916
23,177
23,419
21,102
18,003
16,126
13,361
C/ non-A, non-B††
3,634
2,999
2,619
2,529
2,553
3,582
6,010
4,786
unspecified
3,940
3,102
2,470
2,306
1,671
1,260
884
627
Legionellosis
980
1,038
1,085
1,190
1,370
1,317
1,339
1,280
Leptospirosis
41
43
54
93
77
58
54
51
Lyme disease
**
**
**
**
**
**
9,895
8,257
Lymphogranuloma venereum
396
303
185
189
277
471
302
285
Malaria
1,123
944
1,099
1,277
1,292
1,278
1,087
1,411
Measles
6,282
3,655
3,396
18,193
27,786
9,643
2,237
312
Meningococcal disease, invasive
2,594
2,930
2,964
2,727
2,451
2,130
2,134
2,637
Mumps
7,790
12,848
4,866
5,712
5,292
4,264
2,572
1,692
Murine typhus fever
67
49
54
41
50
43
28
25
Pertussis
4,195
2,823
3,450
4,157
4,570
2,719
4,083
6,586
Plague
10
12
15
4
2
11
13
10
Poliomyelitis, total
10
§§
§§
§§
§§
§§
§§
§§
paralytic§§
10
9
9
11
6
10
6
4
Psittacosis
224
98
114
116
113
94
92
60
Rabies
animal
5,504
4,658
4,651
4,724
4,826
6,910
8,589
9,337
human
---
1
---
1
1
3
1
3
Rheumatic fever, acute
147
141
158
144
108
127
75
112
Rocky Mountain spotted fever
760
604
609
623
651
628
502
456
Rubella
551
306
225
396
1,125
1,401
160
192
Rubella, congenital syndrome
14
5
6
3
11
47
11
5
Salmonellosis
49,984
50,916
48,948
47,812
48,603
48,154
40,912
41,641
Shigellosis
17,138
23,860
30,617
25,010
27,077
23,548
23,931
32,198
Syphilis, primary and secondary
27,883
35,147
40,117
44,540
50,223
42,935
33,973
26,498
congenital (age <1 yr)
410
480
741
1,837
3,865
4,424
4,067
3,420
total, all stages
68,215
86,545
103,437
110,797
134,255
128,569
112,581
101,259
Tetanus
64
48
53
53
64
57
45
48
Toxic-shock syndrome
412
372
390
400
322
280
244
212
Trichinosis
39
40
45
30
129
62
41
16
Tuberculosis
22,768
22,517
22,436
23,495
25,701
26,283
26,673
25,313
Tularemia
170
214
201
152
152
193
159
132
Typhoid fever
362
400
436
460
552
501
414
440
Varicella
183,243
213,196
192,857
185,441
173,099
147,076
158,364
134,722
* No cases of yellow fever were reported during 1986--1993.
† Acquired immunodeficiency syndrome.
§ Cutaneous diphtheria ceased being notifiable nationally after 1979.
¶ Beginning in 1984, data were recorded by date of report to state health departments. Before 1984, data were recorded by onset date.
†† The anti-hepatitis C virus antibody test became available in May 1990.
** Not nationally notifiable.
§§ No cases of paralytic poliomyelitis caused by wild virus have been reported in the United States since 1993.
TABLE 11. Reported cases of notifiable diseases* --- United States, 1978--1985
Disease
1978
1979
1980
1981
1982
1983
1984
1985
AIDS†
§
§
§
§
§
§
4,445
8,249
Amebiasis
3,937
4,107
5,271
6,632
7,304
6,658
5,252
4,433
Anthrax
6
---
1
---
---
---
1
---
Aseptic meningitis
6,573
8,754
8,028
9,547
9,680
12,696
8,326
10,619
Botulism, total (including wound and unspecified)
105
45
89
103
97
133
123
122
foodborne
§
§
§
§
§
§
§
49
infant
§
§
§
§
§
§
§
70
Brucellosis
179
215
183
185
173
200
131
153
Chancroid
521
840
788
850
1,392
847
666
2,067
Cholera
12
1
9
19
---
1
1
4
Diphtheria
76
59
3
5
2
5
1
3
Encephalitis
primary
1,351
1,504
1,362
1,492
1,464
1,761
1,257
1,376
postinfectious
78
84
40
43
36
34
108
161
Gonorrhea
1,013,436
1,004,058
1,004,029
990,864
960,633
900,435
878,556
911,419
Granuloma inguinale
72
76
51
66
17
24
30
44
Hansen disease (Leprosy)
168
185
223
256
250
259
290
361
Hepatitis
A (infectious)
29,500
30,407
29,087
25,802
23,403
21,532
22,040
23,210
B (serum)
15,016
15,452
19,015
21,152
22,177
24,318
26,115
26,611
C/ non--A, non--B¶
§
§
§
§
§
§
3,871
4,184
unspecified
8,776
10,534
11,894
10,975
8,564
7,149
5,531
5,517
Legionellosis
761
593
475
408
654
852
750
830
Leptospirosis
110
94
85
82
100
61
40
57
Lymphogranuloma venereum
284
250
199
263
235
335
170
226
Malaria
731
894
2,062
1,388
1,056
813
1,007
1,049
Measles
26,871
13,597
13,506
3,124
1,714
1,497
2,587
2,822
Meningococcal disease, invasive
2,505
2,724
2,840
3,525
3,056
2,736
2,746
2,479
Mumps
16,817
14,225
8,576
4,941
5,270
3,355
3,021
2,982
Murine typhus fever
46
69
81
61
58
62
53
37
Pertussis
2,063
1,623
1,730
1,248
1,895
2,463
2,276
3,589
Plague
12
13
18
13
19
40
31
17
Poliomyelitis, total
8
22
9
10
12
13
9
8
paralytic
8
22
9
10
12
13
9
8
Psittacosis
140
137
124
136
152
142
172
119
Rabies
animal
3,254
5,119
6,421
7,118
6,212
5,878
5,567
5,565
human
4
4
---
2
---
2
3
1
Rheumatic fever, acute
851
629
432
264
137
88
117
90
Rocky Mountain spotted fever
1,063
1,070
1,163
1,192
976
1,126
838
714
Rubella
18,269
11,795
3,904
2,077
2,325
970
752
630
Rubella, congenital syndrome
30
62
50
19
7
22
5
---
Salmonellosis
29,410
33,138
33,715
39,990
40,936
44,250
40,861
65,347
Shigellosis
19,511
20,135
19,041
9,859
18,129
19,719
17,371
17,057
Syphilis, total, all stages
64,875
67,049
68,832
72,799
75,579
74,637
69,888
67,563
primary and secondary
21,656
24,874
27,204
31,266
33,613
32,698
28,607
27,131
congenital (age <1 yr)
434
332
277
287
259
239
305
329
Tetanus
86
81
95
72
88
91
74
83
Toxic--shock syndrome
§
§
§
§
§
§
482
384
Trichinosis
67
157
131
206
115
45
68
61
Tuberculosis
28,521
27,669
27,749
27,373
25,520
23,846
22,255
22,201
Tularemia
141
196
234
288
275
310
291
177
Typhoid fever
505
528
510
584
425
507
390
402
Varicella
154,089
199,081
190,894
200,766
167,423
177,462
221,983
178,162
* No cases of yellow fever were reported during 1978--1985.
† Acquired immunodeficiency syndrome.
§ Not nationally notifiable.
¶ The anti--hepatitis C virus antibody test became available in May 1990.
TABLE 12. Number of deaths from selected nationally notifiable infectious diseases --- United States, 2002--2007
Cause of death
ICD-10* cause of death code
No. of deaths
2002
2003
2004
2005
2006
2007
AIDS†
B20-B24
14,095
13,658
13,063
12,543
12,133
11,295
Anthrax
A22
0
0
0
0
0
0
Encephalitis, arboviral
California serogroup virus
A83.5
0
0
0
1
1
1
Eastern equine encephalitis virus
A83.2
1
1
2
2
2
0
Powassan virus
A84.8
0
0
0
0
0
0
St. Louis encephalitis virus
A83.3
3
2
2
1
2
1
Western equine encephalitis virus
A83.1
0
0
0
0
0
0
Botulism, foodborne
A05.1
2
6
0
5
3
6
Brucellosis
A23
1
0
0
2
2
1
Chancroid
A57
0
0
0
0
0
0
Chlamydia trachomatis genitalinfection
A56
0
0
0
0
0
0
Cholera
A00
0
0
0
0
0
1
Coccidioidomycosis
B38
84
73
100
76
110
99
Cryptosporidiosis
A07.2
1
0
1
2
2
2
Cyclosporiasis
A07.8
0
0
0
0
0
0
Diphtheria
A36
0
1
0
0
0
0
Ehrlichiosis
A79.8
0
1
0
0
0
0
Giardiasis
A07.1
1
0
1
0
1
0
Gonoccocal infections
A54
7
6
2
3
3
6
Haemophilus influenzae
A49.2
7
5
11
4
4
10
Hansen disease (Leprosy)
A30
2
2
5
1
1
2
Hantavirus pulmonary syndrome
A98.5
0
0
0
0
8
6
Hemolytic uremic syndrome, postdiarrheal
D59.3
35
29
27
30
29
20
Hepatitis A, viral, acute
B15
76
54
58
43
34
34
Influenza-associated pediatric mortality
J10,J11
25
146
51
61
62
71
Legionellosis
A48.1
62
98
72
78
91
67
Listeriosis
A32
32
33
37
31
30
34
Lyme disease
A69.2,L90.4
6
4
6
7
5
8
Malaria
B50-B54
12
4
8
6
9
5
Measles
B05
0
1
0
1
0
0
Meningococcal disease
A39
161
161
138
123
105
87
Mumps
B26
1
0
0
0
1
0
Pertussis
A37
18
11
16
31
9
9
Plague
A20
0
0
1
1
3
2
Poliomyelitis
A80
0
0
0
0
0
0
Psittacosis
A70
0
0
0
0
0
0
Q fever
A78
0
1
1
2
2
4
Rabies, human
A82
3
2
3
1
2
1
Rocky Mountain spotted fever
A77.0
8
9
5
6
4
4
Rubella
B06
0
0
1
0
0
1
Rubella, congenital syndrome
P35.0
6
4
5
8
2
4
Salmonellosis
A02
21
43
30
30
34
30
Shiga toxin-producing Escherichia coli (STEC)
A04.0-A04.4
4
2
4
5
3
3
Shigellosis
A03
4
2
0
9
3
4
Smallpox
B03
0
0
0
0
0
0
Streptococcal disease, invasive, group A
A40.0,A49.1
109
115
121
118
117
144
Streptococcus pneumoniae, invasive disease (restricted to <5 years of age)
A40.3,B95.3,J13
13
15
13
12
22
12
Syphilis, total, all stages
A50-A53
41
34
43
47
38
42
Tetanus
A35
5
4
4
1
4
5
Toxic-shock syndrome (other than streptococcal)
A48.3
78
71
71
55
57
18
Trichinellosis
B75
0
0
0
0
1
0
Tuberculosis
A16-A19
784
711
657
648
652
554
Tularemia
A21
2
2
1
0
0
2
Typhoid fever
A01.0
0
0
0
0
0
0
Varicella
B01
32
16
19
13
18
14
Yellow fever §
A95
1
0
0
0
0
0
Source: CDC. CDC WONDER Compressed Mortality files (http://wonder.cdc.gov/mortSQL.html) provided by the National Center for Health Statistics. National Vital Statistics System, 1999-2007. Underlying causes of death are classified according to ICD 10. Data for 2008-2010 are not available. Data are limited by the accuracy of the information regarding the underlying cause of death indicated on death certificates and reported to the National Vital Statistics System.
* World Health Organization. International Statistical Classification of Diseases and Related Health Problems. Tenth Revision, 1992.
† Acquired immunodeficiency syndrome.
§ For one fatality, the cause of death was erroneously reported as yellow fever in the National Center for Health Statistics dataset for 2003. Subsequent investigation has determined that this death did not result from infection with wild-type yellow fever virus, and it is therefore not included in this table.
CDC. Manual of procedures for the reporting of nationally notifiable diseases to CDC. Atlanta, GA: US Department of Health and Human Services, Public Health Service, CDC; 1995.
CDC. Manual for the surveillance of vaccine-preventable diseases. 3rd ed. Atlanta, GA: US Department of Health and Human Services, Public Health Service, CDC; 2002. Available at http://www.cdc.gov/nip/ publications/surv-manual.
CDC. National Electronic Disease Surveillance System (NEDSS): a standards-based approach to connect public health and clinical medicine. J Public Health Manag Practice 2001;7:43--50.
CDC. Public Health Information Network (PHIN): overview. Atlanta, GA: US Department of Health and Human Services, CDC; 2006. Available at http://www.cdc.gov/phin/overview.html.
CDC. Sexually transmitted disease surveillance, 2009. Atlanta, GA: US Department of Health and Human Services, CDC; 2009. Available at http://www.cdc.gov/std/stats.
Adekoya N. Nationally notifable disease surveillance (NNDSS) and the Healthy People 2010 objectives. The eJournal of the South Carolina Medical Association 2005;101:e68--72. Available at http://www.scmanet.org/Downloads/e-Journal/SCMA_eJournal_March05.pdf.
Armstrong KE, McNabb S, Ferland LD, et al. Capacity of public health suveillance to comply with revised international health regulations, USA. Emerg Infect Dis 2010;5:804--8.
Baker MG, Fidler DP. Global public health surveillance under new international health regulations. Emerg Infect Dis 2006;12:1058--65.
Bayer R, Fairchild AL. Public health: surveillance and privacy. Science 2000;290:1898--9.
Chang M-H, Glynn MK, Groseclose SL. Endemic, notifiable bioterrorism-related diseases, United States, 1992--1999. Emerg Infect Dis 2003;9:556--64.
Chin JE, ed. Control of communicable diseases manual. 17th ed. Washington, DC: American Public Health Association; 2000.
Doyle TJ, Glynn MK, Groseclose SL. Completeness of notifiable infectious disease reporting in the United States: an analytical literature review. Am J Epidemiol 2002;155:866--74.
Effler P, Ching-Lee M, Bogard A, Ieong M-C, Nekomoto T, Jernigan D. Statewide system of electronic notifiable disease reporting from clinical laboratories: comparing automated reporting with conventional methods. JAMA 1999;282:1845--50.
Freimuth V, Linnan HW, Potter P. Communicating the threat of emerging infections to the public. Emerg Infect Dis 2000;6:337--47.
German R. Sensitivity and predictive value positive measurements for public health surveillance systems. Epidemiology 2000;11:720--7.
Government Accountability Office. Emerging infectious diseases: review of state and federal disease surveillance efforts. Washington, DC:
Hopkins RS. Design and operation of state and local infectious disease surveillance systems. J Public Health Manag Practice 2005;11:184--90.
Jajosky RA, Groseclose SL. Evaluation of reporting timeliness of public health surveillance systems for infectious diseases. BMC Public Health 2004;4:29.
Koo D, Wetterhall S. History and current status of the National Notifiable Diseases Surveillance System. J Public Health Manag Pract 1996;2:4--10.
Krause G, Brodhun B, Altmann D, Claus H, Benzler J. Reliability of case definitions for public health surveillance assessed by round-robin test methodology. BMC Public Health 2006;6:129.
Lazarus R, Klompas M, Campion F, et al. Electronic support for public health: validated case finding and reporting for notifiable diseases using electronic medical data. J Am Med Inform Assoc 2009;16(1):18--24.
Lin SS, Kelsey JL. Use of race and ethnicity in epidemiologic research: concepts, methodological issues, and suggestions for research. Epidemiol Rev 2000;22:187--202.
Martin SM, Bean NH. Data management issues for emerging diseases and new tools for managing surveillance and laboratory data. Emerg Infect Dis 1995;1:124--8.
McNabb S, Chungong S, Ryan M, et al. Conceptual framework of public health surveillance and action and its application in health sector reform. BMC Public Health 2002;2:2.
McNabb S, Surdo A, Redmond A, et al. Applying a new conceptual framework to evaluate tuberculosis surveillance and action performance and measure the costs, Hillsborough County, Florida, 2002. Ann Epidemiol 2004;14:640--5.
Niskar AS, Koo D. Differences in notifiable infectious disease morbidity among adult women---United States, 1992--1994. J Womens Health 1998;7:451--8.
Overhage JM, Grannis S, MdDonald CJ. A comparison of the completeness and timeliness of automated electronic laboratory reporting and spontaneous reporting of notifiable conditions. Am JPublic Health. 2008;98:344--50.
Panackal AA, M’ikanatha NM, Tsui FC, et al. Automatic electronic laboratory- based reporting of notifiable infectious diseases at a large health system. Emerg Infect Dis 2002;8:685--91.
Pinner RW, Koo D, Berkelman RL. Surveillance of infectious diseases. In: Lederberg J, Alexander M, Bloom RB, eds. Encyclopedia of microbiology. 2nd ed. San Diego, CA: Academic Press; 2000.
Pinner RW, Jernigan DB, Sutliff SM. Electronic laboratory-based reporting for public health. Mil Med 2000;165(Suppl 2):20--4.
Roush S, Birkhead G, Koo D, Cobb A, Fleming D. Mandatory reporting of diseases and conditions by health care professionals and laboratories. JAMA 1999;282:164--70.
Roush S, Murphy T. Historical comparisons of morbidity and mortality for vaccine-preventable diseases in the United States. JAMA 2007;298:2155--63.
Silk, BJ, Berkelman RL. A review of strategies for enhancing the completeness of notifiable disease reporting. J Public Health Manag Practice 2005;11:191--200.
Teutsch SM, Churchill RE, eds. Principles and practice of public health surveillance. 2nd ed. New York, NY: Oxford University Press; 2000.
Thacker SB, Choi K, Brachman PS. The surveillance of infectious diseases. JAMA 1983;249:1181--5.
Blackburn JK, McNyset KM, Curtis A, Hugh-Jones ME. Modeling the geographic distribution of Bacillus anthracis, the causative agent of anthrax disease, for the contiguous United States using predictive ecological niche modeling. Am J Trop Med Hyg 2007;77:110---10.
Stern EJ, Uhde KB, Shadomy SV, Messonnier N. Conference report on public health and clinical guidelines for anthrax. Emerg Infect Dis 2008;14. Available at http://www.cdc.gov/eid/content/14/4/el.htm.
Botulism
Barzilay, EJ. Botulism and Intestinal Botulism. In: DL Heymann, ed. Control of communicable diseases manual, Washington, DC: American Public Health Association Press; 2008.
Arnon SS, Barzilay EJ. Clostridial Infections: Botulism and infant botulism. In: Pickering LK, Baker CJ, Kimberlin DW, Long SS, eds. The Red Book: 2009 report of the Committee on Infectious Diseases. Elk Grove Village: American Academy of Pediatrics; 2009:259--62.
Sobel J. Botulism. Clin Infect Dis 2005;41:1167--73.
Sobel J, Tucker N, McLaughlin J, Maslanka S. Foodborne botulism in the United States, 1999--2000. Emerg Infect Dis 2004;10:1606--12.
Angulo FJ, St. Louis ME. Botulism. In: Evans AS, Brachman PS, eds. Bacterial infections of humans. New York, NY: Plenum; 1998:131--53.
Shapiro RL, Hatheway C, Swerdlow DL. Botulism in the United States: a clinical and epidemiologic review. Ann Intern Med 1998;129:221--8.
Shapiro RL, Hatheway C, Becher J, Swerdlow DL. Botulism surveillance and emergency response: a public health strategy for a global challenge. JAMA 1997;278:433--5.
Brucellosis
Ashford DA, di Pietra J, Lingappa J, et al. Adverse events in humans associated with accidental exposure to the livestock brucellosis vaccine RB51. Vaccine 2004;22:3435--9.
Chomel BB, DeBess EE, Mangiamele DM, et al. Changing trends in the epidemiology of human brucellosis in California from 1973 to 1992: a shift toward foodborne transmission. J Infect Dis 1994;170:1216--23.
Glynn MK, Lynn TV. Brucellosis. J Am Vet Med Assoc 2008;233:900--8.
Yagupsky P, Baron EJ. Laboratory exposures to Brucellae and implications for bioterrorism. Emerg Infect Dis 2005;11:1180--5.
Chancroid
DiCarlo RP, Armentor BS, Martin DH. Chancroid epidemiology in New Orleans men. J Infect Dis 1995;172:446--52.
Mertz KJ, Weiss JB, Webb RM, et al. An investigation of genital ulcers in Jackson, Mississippi, with use of a multiplex polymerase chain reaction assay: high prevalence of chancroid and human immunodeficiency virus infection. J Infect Dis 1998;178:1060--6.
Mertz KJ, Trees D, Levine WC, et al. Etiology of genital ulcers and prevalence of human immunodeficiency virus coinfection in 10 US cities. The Genital Ulcer Disease Surveillance Group. J Infect Dis 1998;178:1795
Datta SP, Sternberg, M, Johnson RE, et al. Gonorrhea and chlamydia in the United States among persons 14 to 39 years of age, 1999 to 2002. Ann Intern Med 2007;147:89--96.
Satterwhite CL, Joesoef MR, Datta SD, Weinstock H. Estimates of Chlamydia trachomatis infections among men: United States. Sexually Transm Dis 2007;35:S3--7.
Satterwhite CL, Tian LH, Braxton J, Weinstock H. Chlamydia prevalence among women and men entering the National Job Training Program: United States, 2003--2007. Sex Transm Dis2010; 37: 63--67.
Cholera
Steinberg EB, Greene KD, Bopp CA, Cameron DN, Wells JG, Mintz ED. Cholera in the United States, 1995--2000: trends at the end of the millennium. J Infect Dis 2001;184:799--802.
World Health Organization. Cholera, 2008. Wkly Epidemiol Rec 2009;84:309--24.
Gaffga NH, Tauxe RV, Mintz ED. Cholera: a new homeland in Africa. Am J Trop Med Hyg 2007;77:705--13.
Tobin-D’Angelo M, Smith AR, Bulens SN, et al. Severe diarrhea caused by cholera toxin--producing Vibrio cholerae serogroup O75 infections acquired in the southeastern United States. Clin Infect Dis 2008;47:1035--40.
Coccidioidomycosis
Burwell LA, Park BJ, Wannemuehler KA, et al. Outcomes among inmates treated for coccidioidomycosis at a correctional institution during a community outbreak, Kern County, California 2004. Clin Infect Dis 2009; 49:e113--9.
Ampel NM, Giblin A, Mourani JP, Galgiani JN. Factors and outcomes associated with the decision to treat primary pulmonary coccidioidomycosis. Clin Infect Dis 2009:48:172--8.
Stern NG, Galgiani JN. Coccidioidomycosis among scholarship athletes and other college students, Arizona, USA. Emerg Infect Dis 2010;16:321--3.
Cryptosporidiosis
Yoder JS, Beach MJ. Cryptosporidium surveillance and risk factors in the United States. Exp Parasitol. 2010; 124: 31--9.
Roy SL, DeLong SM, Stenzel S, et al. Risk factors for sporadic cryptosporidiosis among immunocompetent persons in the United States from 1999 to 2001. J Clin Microbiol 2004;42:2944--51.
Ortega YR, Sanchez R. Update on Cyclospora cayetanensis, a food-borne and waterborne parasite. Clin Microbiol Rev 2010;23:218--34.
Herwaldt BL. The ongoing saga of U.S. outbreaks of cyclosporiasis associated with imported fresh produce: what Cyclospora cayetanensis has taught us and what we have yet to learn. In: Institute of Medicine. Addressing foodborne threats to health: policies, practices, and global coordination. Washington, DC: The National Academies Press; 2006:85 -- 115, 133 -- 40.
Herwaldt BL. Cyclospora cayetanensis: a review, focusing on the outbreaks of cyclosporiasis in the 1990s. Clin Infect Dis 2000;31:1040 -- 57.
Diphtheria
Dewinter LM, Bernard KA, Romney MG. Human clinical isolates of Corynebacterium diphtheriae and Corynebacterium ulcerans collected in Canada from 1999 to 2003 but not fitting reporting criteria for cases of diphtheria. Clin Microbiol 2005;43:3447--9.
Demma LJ, Holman RC, McQuiston JH, Krebs JW, Swerdlow DL. Epidemiology of human ehrlichiosis and anaplasmosis in the United States, 2001---2002. Am J Trop Med Hyg 2005;73:400--9.
Stuart JM, Orr HJ, Warburton FG, et al. Risk factors for sporadic giardiasis: a case-control study in southwestern England. Emerg Infect Dis 2003;9:229--33.
CDC. Sexually transmitted diseases surveillance 2009. Atlanta, GA: US Department of Health and Human Services, CDC; Nov. 2009. Available at
http://www.cdc.gov/std/stats.
Datta SD, Sternberg M, Johnson RE, et al. Gonorrhea and chlamydia in the United States among persons 14 to 39 years of age, 1999 to 2002. Ann Int Med 2007;147:89--96.
Fry AM, Lurie P, Gidley M, Schmink S, Lingappa J, Rosenstein NE. Haemophilus influenzae type b (Hib) disease among Amish children in Pennsylvania: reasons for persistent disease. Pediatrics 2001;108:1--6.
Dworkin MS, Park L, Borchardt SM. The changing epidemiology of invasive Haemophilus influenzae Disease, especially in persons >65 Years Old. Clin Infect Dis 2007;44:810--6.
Schuchat A, Messonnier NR. From pandemic suspect to the postvaccine era: the Haemophilus influenzae story. Clin Infect Dis 2007;44:817--9.
Bender JM, Cox CM, Mottice S, et al. Invasive Haemophilus influenzae disease in Utah children: An 11-year population-based study in the era of conjugate vaccine. Clin Infect Dis 2010;50:e41--6.
Bruce S, Schroeder TL, Ellner K, Rubin H, Williams T, Wolf JE Jr. Armadillo exposure and Hansen’s disease: an epidemiologic survey in southern Texas. J Am Acad Dermatol 2000;43(2 Pt1):223--8.
Hartzell JD, Zapor M, Peng S, Straight T. Leprosy: a case series and review. South Med J 2004;97:1252--6.
Hastings R, ed. Leprosy. 2nd ed. New York, NY: Churchill Livingstone; 1994.
Joyce MP, Scollard DM. Leprosy (Hansen’s disease). In: Rakel RE, Bope ET, eds. Conn’s current therapy 2004: latest approved methods of treatment for the practicing physician. 56th ed. Philadelphia, PA: Saunders; 2004:100--5.
Ooi WW, Moschella SL. Update on leprosy in immigrants in the United States: status in the year 2000. Clin Infect Dis 2001;32:930--7.
Scollard DM, Adams LB, Gillis TP, Krahenbuhl JL, Truman RW, Williams DL. The continuing challenges of leprosy. Clinical Microbiology Reviews, 2006;19(2):338--81.
Hjelle B. Hantviruses and hantavirus cardiopulmonary syndrome in the Americas. In: Saluzzo J-F, Dodet B, eds. Factors in the emergence and control of rodent-borne viral diseases: Elsevier 1999;55--62.
Khan AS, Khabbaz RF, Armstrong LR, et al. Hantavirus pulmonary syndrome---the first 100 US cases. J Infect Dis 1996;173:1297--1303.
Levine JR, Fritz CL, Novak MG. Occupational risk of exposure to rodent-borne hantavirus at US forest service facilities in California. Am J Trop Med Hyg 2008;78:352--7.
Hemolytic Uremic Syndrome, Postdiarrheal
Banatvala N, Griffin PM, Greene KD, et al. The United States prospective hemolytic uremic syndrome study: microbiologic, serologic, clinical, and epidemiologic findings. J Infect Dis 2001;183:1063--70.
Gould L, Demma L, Jones TF, et al. Hemolytic uremic syndrome and death in persons with Escherichia coli O157:H7 infection, Foodborne Diseases Active Surveillance Network Sites, 2000--2006. Clin Infect Dis 2009;49:1480--5.
Tarr PI, Gordon CA Chandler WL. Shiga-toxin-producing Escherichia coli and haemolytic uraemic syndrome. Lancet 2005;365:1073--86.
Hepatitis B
Institute of Medicine 2010. Hepatitis and liver cancer: A national strategy for prevention and control of hepatitis B and C. Washington, DC: The National Academics Press.
Wasley A, Kruszon-Moran D, Kuhnert W, et al.. The prevalence of hepatitis B virus infection in the United States in the era of vaccination. J Infect Dis 2010;202:192--201.
Hepatitis B and C
Institute of Medicine 2010. Hepatitis and liver Cancer: A national strategy for prevention and control of hepatitis B and C. Washington, DC: The National Academics Press.
Influenza-Associated Pediatric Mortality
Bhat N, Wright JG, Broder KR, et al. Influenza-associated deaths among children in the United States, 2003--2004. N Engl J Med 2005;352:2559--67.
Council of State and Territorial Epidemiologists. Influenza-associated pediatric mortality, 2004. Atlanta, GA: Council of State and Territorial Epidemiologists; 2004. Available at http://www.cste.org/PositionStatementsResolutions2.htm.
Council of State and Territorial Epidemiologists. Position statement 04-ID-04: influenza-associated pediatric mortality 2004. Atlanta, GA: Council of State and Territorial Epidemiologists; 2004. Available at http://www.cste.org/ps/2004pdf/04-ID-04-final.pdf.
Guarner J, Paddock CD, Shieh WJ, et al. Histopathologic and immunohistochemical features of fatal influenza virus infection in children during the 2003--04 season. Clin Infect Dis 2006:43;132--4.
Finelli L, Fiore A, Dhara R, et al. Influenza-associated pediatric mortality in the United States: increase of Staphylococcus aureus coinfection Pediatrics 2008;122:805--11.
Fields BS, Benson RF, Besser RE. Legionella and Legionnaires’ disease: 25 years of investigation. Clin Microbiol Rev 2002;15:506--26.
European Working Group on Legionella Infections. European guidelines for control and prevention of travel associated Legionnaires’ disease. London, UK: United Kingdom Health Protection Agency; 2005.
Joseph CA. Legionnaires’ disease in Europe 2000--2002. Epidemiol Infect 2004;132:417--24.
Marston BJ, Lipman HB, Breiman RF. Surveillance for Legionnaires’ disease: risk factors for morbidity and mortality. Arch Intern Med 1994;154:2417--22.
Neil K, Berkelman R. Increasing incidence of legionellosis in the United States: changing epidemiological trends. Clin Infect Dis 2008;47:591--9.
CDC. Increasing incidence of legionellosis in the United States, 2000--2009. MMWR (in press).
Listeriosis
Gottlieb SL, Newbern EC, Griffin PM, et al. Multistate outbreak of listeriosis linked to turkey deli meat and subsequent changes in US regulatory policy. Clin Infect Dis 2006;42:29--36.
Mead PS, Dunne EF, Graves L, et al. Nationwide outbreak of listeriosis due to contaminated meat. Epidemiol Infect 2006;134:744--51.
Mead PS, Slutsker L, Dietz V, et al. Food-related illness and death in the United States. Emerg Infect Dis 1998;5:607--25.
Slutsker L, Schuchat A. Listeriosis in humans. In: Ryser ET Marth EH, eds. Listeria, listeriosis, and food safety. 2nd ed. New York, NY: Marcel Dekker, Inc.; Little, Brown and Company; 1999:75--95.
Voetsch AC, Angulo FJ, Jones TF, et al. Reduction in the incidence of invasive listeriosis in Foodborne Diseases Active Surveillance Network Sites, 1996--2003. Clin Infect Dis 2007;44:513--20.
Lyme disease
Stafford, KC III. Tick management handbook: an integrated guide for homeowners, pest control operators, and public health officials for the prevention of tick-associated disease. New Haven, CT: Connecticut Agricultural Experiment Station; 2004. Available at http://www.cdc.gov/ncidod/dvbid/lyme/resources/handbook.pdf.
Connally NP, Durante AJ, Yousey-Hindes KM, et al. Peridomestic Lyme disease prevention: results of a population-based case-control study. Am J. Prev Med 2009;37:201--6.
Hayes EG, Piesman J. How can we prevent Lyme disease? N Engl J Med 2003;348:2424--30.
Wormser GP, Dattwyler RJ, Shapiro ED, et al. The clinical assessment, treatment, and prevention of Lyme disease, human granulocytic, anaplasmosis, and babesiosis: clinical practice guidelines by the Infectious Disease Society of America. Clin Infect Dis 2006;43:1089--1134.
Malaria
Baird JK. Effectiveness of antimalarial drugs. N Engl J Med 2005;352:1565--77.
Chen LH, Keystone JS. New strategies for the prevention of malaria in travelers. Infect Dis Clin N Amer 2005;19:185--210.
Guinovart C, Navia MM, Tanner M, et al. Malaria: burden of disease. Curr Mol Med 2006;6:137--40.
Leder K, Black J, O’Brien D, et al. Malaria in travelers: a review of the GeoSentinel Surveillance Network. Clin Infect Dis 2004;39:1104--12.
Sugerman DE, Barskey, AE. Measles Outbreak in a highly vaccinated population, San Diego 2008: role of the intentionally unvaccinated. Pediatrics 2010; 125:747--755..
Papania M, Hinman A, Katz S, Orenstein W, McCauley M, eds. Progress toward measles elimination---absence of measles as an endemic disease in the United States. J Infect Dis 2004;189(Suppl 1):S1--257.
Rosenstein NE, Perkins BA, Stephens DS, et al. Meningococcal disease. N Engl J Med 2001;344:1378--88.
Cohn, AC, MacNeil, J, Harrison, et al. Changes in Neisseria meningitidis disease epidemiology in the United States, 1998--2007: implications for prevention of meningococcal disease. Clin Infect Dis 2010:50:184--91.
Dayan G, Quinlisk P, et al. Recent resurgence of mumps in the United States. New Engl J Med 2008; 358:1580--9.
Anderson LJ, Seward JF. Mumps epidemiology and immunity: the anatomy of a modern epidemic. Pediatr Infect Dis J. 2008;27(Suppl 10):S75--9.
Bitsko RH, Cortese MM, Dayan GH, et al. Detection of RNA of mumps virus during an outbreak in a population with high level of measles, mumps, and rubella vaccine coverage. J Clin Microbiol 2008;46:1101--3.
Marin M, Quinlisk P, Shimabukuro T, et al. Mumps vaccination coverage and vaccine effectiveness in a large outbreak among college students---Iowa, 2006. Vaccine 2008;26:3601--7.
Shinde V. Triple-reassortant swine influenza A (H1) in humans in the United States, 2005--2009. N Engl J Med 2009; 360:2616--25
Jain S. Hospitalized patients with 2009 H1N1 influenza in the United States, April--June 2009. N Engl J Med 2009;361:1935--44
Novel Swine-Origin Influenza A (H1N1) Virus Investigation Team. Emergence of a novel swine-origin influenza A (H1N1) virus in humans. N Engl J Med 2009;360:2605--15
Pertussis
Bisgard KM, Rhodes P, Connelly BL, et al. Pertussis vaccine effectiveness among children 6 to 59 months of age in the United States, 1998--2001. Pediatrics 2005;116:e285--94.
Bisgard KM, Pascual FB, Ehresmann KR, et al. Infant pertussis: who was the source? Pediatr Infect Dis J 2004;23:985--9.
Gould LH, Pape J, Ettestadt P et al. Dog-associated risk factors for human plague. Zoonoses and Public Health 2008;55:448--54.
Enscore RE, Biggerstaff BJ, Brown TL, et al. Modeling relationships between climate and the frequency of human plague cases in the southwestern United States, 1960--1997. Am J. Trop Med Hyg 2002;66:186--96.
Inglesby TV, Dennis DT, Henderson DA, et al. Plague as a biological weapon: medical and public health management. Working Group on Civilian Defense. JAMA 2000;283:2281--90.
Dennis DT, Gage KL, Gratz N. Poland JD, Tikhomirov E. Plague manual: epidemiology, distribution, surveillance, and control. Geneva, Switzerland. World Health Organization: 1999.
Mitchell SL, Wolff BJ, Thacker WL, et al. Genotyping of Chlamydophila psitttaci by real time PCR and high resolution melt analysis. J Clin Microbiol 2008;47:175--81.
Q Fever
Angelakis E, Raoult D. Q fever. Vet Micro 2010;140:2---309.
Tissot-Dupont D, Raoult D. Q fever. Infect Dis Clin North Am 2008;22:505--14.
Parker N, Barralet J, Bell A. Q fever. The Lancet 2006;367[9511]:679--88.
McQuiston JH, Holman RC, McCall CL, Childs JE, Swerdlow DL, Thompson HA. National surveillance and the epidemiology of Q fever in the United States, 1978--2004. Am J Trop Med Hyg 2006;75:36--40.
Raoult D, Tissot-Dupont H, Foucault C, et al. Q fever 1985--1998. Clinical and epidemiologic features of 1,383 infections [Review]. Medicine 2000:79:109--25.
Openshaw JJ, Swerdlow DL, Krebs JW, et al. Rocky Mountain spotted fever in the United States, 2000--2007: interpreting contemporary increases in incidence. Am J Trop Med Hyg 2010;83:174--82.
Adjemian JZ, Krebs J, Mandel E, McQuiston, J. Spatial clustering by disease severity among reported Rocky Mountain spotted fever cases in the United States, 2001--2005. Am J Trop Med Hyg 2009;80:72--7.
Walker D. Rickettsiae and rickettsial infections: the current state of knowledge. Clin Infect Dis 2007:45 (Suppl 1):539--44.
Reef S, Cochi S, eds. The evidence for the elimination of rubella and congenital rubella syndrome in the United States: a public health achievement. Clin Infect Dis 2006;43(Suppl 3):S123--68.
Braden CR. Salmonella enterica serotype Enteritidis and eggs: a national epidemic in the United States. Clin Infect Dis 2006;43:512--7.
Jones TF, Ingram LA, Cieslak PR, et al. Salmonellosis outcomes differ substantially by serotype. J Infect Dis 2008;198:109--14.
Olsen SJ, Bishop R, Brenner FW, et al. The changing epidemiology of Salmonella: trends in serotypes isolated from humans in the United States, 1987--1997. J Infect Dis 2001;183:756--61.
Voetsch AC, Van Gilder TJ, Angulo FJ, et al. FoodNet estimate of burden of illness caused by nontyphoidal Salmonella infections in the United States. Clin Infect Dis 2004;38(Suppl 3):S127--34.
Council of State and Territorial Epidemiologists. 2009 Position statement-09-ID-11: National Surveillance for Severe Acute Respiratory Syndrome. Available at http://www/cste.org/ps2009/09-ID-11.pdf.
Shiga toxin-producing Escherichia coli
Brooks JT, Sowers EG, Wells JB, et al. Non-O157 Shiga toxin-producing Escherichia coli infections in the United States, 1983--2002. J Infect Dis 2005;192:1422--9.
Crump JA, Sulka AC, Langer AJ, et al. An outbreak of Escherichia coli O157:H7 among visitors to a dairy farm. N Engl J Med 2002;347:555--60.
Griffin PM, Mead PS, Sivapalasingam S. Escherichia coli O157:H7 and other enterohemorrhagic E. coli. In: Blaser MJ, Smith PD, Ravdin JI, Greenberg HB, Guerrant RL, eds. Infections of the gastrointestinal tract. Philadelphia, PA: Lippincott Williams & Wilkins; 2002:627--42
Hedican EB, Medus C, Besser JM, Juni BA, et al. Characteristics of O157 versus non-O157 shiga toxin-producing Escherichia coli infections in Minnesota, 2000--2006. Clin Infect Dis 2009;49:358--64.
Tarr PI, Gordon CA Chandler WL. Shiga-toxin-producing Escherichia coli and haemolytic uraemic syndrome. Lancet 2005;365:1073--86.
Shigellosis
Shane A, Crump J, Tucker N, Painter J, Mintz E. Sharing Shigella: risk factors and costs of a multi-community outbreak of shigellosis. Arch Pediatr Adolesc Med 2003;157:601--3.
Gupta A, Polyak CS, Bishop RD, Sobel J, Mintz ED. Laboratory-confirmed shigellosis in the United States, 1989--2002: epidemiologic trends and patterns. Clin Infect Dis 2004;38:1372--7.
Sivapalasingam S, Nelson JM, Joyce K, Hoekstra M, Angulo FJ, Mintz ED. A high prevalence of antimicrobial resistance among Shigella isolates in the United States, 1999--2002. Antimicrob Agents Chemother 2006;50:49--54.
Arvelo W, Hinkle CJ, Nguyen TA, et al. Transmission risk factors and treatment of pediatric shigellosis during a large daycare center-associated outbreak of multidrug resistant Shigellasonnei: Implications for the management of shigellosis outbreaks among children. Pediatr Infect Dis J 2009;976--80.
Streptococcal Toxic-Shock Syndrome
CDC. Active bacterial core surveillance report. 2010. Emerging Infections Program Network. Group A Streptococcus, 2009-Provisional. Atlanta, GA: US Department of Health and Human Services, CDC; 2010. Available at http://www.cdc.gov/abcs/reports-findings/survreports/gas09.pdf.
Martin JM, Green M. Group A Streptococcus. Seminars in pediatric infectious diseases 2006;17:140--8.
CDC. Investigating clusters of group A Streptococcal disease. Atlanta, GA: US Department of Health and Human Services, CDC:2009. Available at
www.cdc.gov/strepAcaluculator.
The prevention of invasive group A streptococcal infections workshop participants. Prevention of invasive group A streptococcal disease among household contacts of case patients among postpartum and postsurgical patients: recommendations from the Centers for Disease Control and Prevention. Clin Infect Dis 2002;35:950--9.
O’Loughlin RE, Roberson A, Cieslak PR, et al. The epidemiology of invasive group A streptococcal infections and potential vaccine implications, United States, 2000---2004. Clin Infect Dis 2007;45:853--62.
Clinical and Laboratory Standards Institute. Performance Standards for Antimicrobial Susceptibility Testing; Eighteenth Informational Supplement. CLSI Document M100-S18. Wayne, PA: Clinical and Laboratory Standards Institute; 2009.
Hsu HE, Shutt KA, Moore MR, et al. Effect of pneumococcal conjugate vaccine on pneumococcal meningitis. N Engl J Med 2009;360:244-56.
Ray GT, Pelton SI, Klugman KP, Strutton DR, Moore MR. Cost-effectiveness of pneumococcal conjugate vaccine: an update after 7 years of use in the United States. Vaccine 2009;27:6483--94.
Weinstein MP, Klugman KP, Jones RN. Rationale for revised penicillin susceptibility breakpoints versus Streptococcus pneumoniae: coping with antimicrobial susceptibility in an era of resistance. Clin Infect Dis 2009;48:1596--600.
Cohen AL, Harrison LH, Farley MM, et al. Prevention of invasive pneumococcal disease among HIV-infected adults in the era of childhood pneumococcal immunization. AIDS 2010;24:2253--62.
Hanquet G, Perrocheau A, Kissling E, et al. Surveillance of invasive pneumococcal disease in 30 EU countries: Towards a European system? Vaccine 2010;28:3920--8.
Pilishvili T, Lexau C, Farley MM, et al. Sustained reductions in invasive pneumococcal disease in the era of conjugate vaccine. J Infect Dis 2010;201:32--41.
Weatherholtz R, Millar EV, Moulton LH, et al. Invasive pneumococcal disease a decade after pneumococcal conjugate vaccine use in an American Indian population at high risk for disease. Clin Infect Dis 2010;50:1238--46.
Wenger JD, Zulz T, Bruden D, et al. Invasive pneumococcal disease in Alaskan children: impact of the seven-valent pneumococcal conjugate vaccine and the role of water supply. Pediatr Infect Dis J 2010:251--6.
Syphilis, Primary and Secondary
Centers for Disease Control and Prevention. Together we can. The National Plan to Eliminate Syphilis from the United States. Atlanta, GA: US Department of Health and Human Services, May 2006.
Heffelfinger JD, Swint EB, Berman SB, Weinstock HS. Trends in primary and secondary syphilis among men who have sex with men in the United States. Am J Public Health 2007;97:1076--83.
CDC. Sexually transmitted disease surveillance, 2009. Atlanta, GA: US Department of Health and Human Services. CDC.
McQuillan GM, Kruszon-Moran D, Deforest A, Chu SY, Wharton M. Serologic immunity to diphtheria and tetanus in the United States. Ann Intern Med 2002;136:660--6.
Gamble HR, Bessonov AS, Cuperlovic K, et al. International Commission on Trichinellosis: recommendations on methods for the control of Trichinella in domestic and wild animals intended for human consumption. Vet Parasitol 2000;93:393--408.
Gottstein B, Pozio E, Nockler K. Epidemiology, diagnosis, treatment, and control of trichinellosis. Clin Microbiol Rev. Jan 2009;22:127--45.
CDC. Reported tuberculosis in the United States, 2003. Atlanta, GA: US Department of Health and Human Services, CDC; 2004. Available at http://www.cdc.gov/nchstp/tb.
Saraiya M, Cookson ST, Tribble P, et al. Tuberculosis screening among foreign-born persons applying for permanent US residence. Am J Public Health 2002;92:826--9.
Talbot EA, Moore M, McCray E, Binkin NJ. Tuberculosis among foreign-born persons in the United States, 1993--1998. JAMA 2000;284:2894--900.
Kugeler KJ, Mead PS, Janusz AM, et al. Molecular epidemiology of Francisella tularensis in the United States. Clin Infect Dis 2009;48: 863--70.
Tarnvik A. WHO Guidelines on Tularaemia. Vol. WHO/CDS/EPR/2007.7. Geneva, Switzerland: World Health Organization; 2007
Typhoid Fever
Gupta S, Medalla F, Omondi MW, et al. Laboratory-based surveillance for paratyphoid fever in the United States: travel and antimicrobial resistance. Clin Infect Dis; 2008;46:1656-63.
Kubota K, Barrett TJ, Hunter S et al. Analysis of Salmonella serotype Typhi pulsed-field gel electrophoresis patterns associated with international travel. J Clin Micro 2005;43:1205--9.
Olsen SJ, Bleasdale SC, Magnano AR, et al. Outbreaks of typhoid fever in the United States, 1960--1999. Epidemiol Infect 2003;130:13--21.
Steinberg EB, Bishop RB, Dempsey AF, et al. Typhoid fever in travelers: who should be targeted for prevention? Clin Infect Dis 2004;39:186--91.
Lynch MF, Blanton EM, Bulens S, et al. Typhoid fever in the United States, 1999--2006. JAMA 2009;302:898--9
Marin M, Meissner HC, Seward JF. Varicella prevention in the United States: a review of successes and challenges. Pediatrics 2008;122:e744-e51.
Guris D, Jumaan AO, Mascola L, et al. Changing varicella epidemiology in active surveillance sites---United States, 1995--2005. J Infect Dis 2008;197 Suppl 2:S71--5.
Vibriosis
Daniels NA, MacKinnon L, Bishop R, et al. Vibrio parahaemolyticus infections in the United States, 1973-1998. J Infect Dis 2000;181:1661--6.
Dechet A, Yu PA, Koram N, Painter J. Nonfoodborne vibrio infections: an important cause of morbidity and mortality in the United States, 1997--2006. Clin Infect Dis;46:970--6.
McLaughlin JB, DePaola A, Bopp CA, et al. Outbreak of Vibrio parahaemolyticus gastroenteritis associated with Alaskan oysters. N Engl J Med 2005;353:1463--70.
Shapiro RL, Altekruse S, Hutwagner L, et al. The role of Gulf Coast oysters in warmer months in Vibrio vulnificus infections in the United States, 1998--1996. J Infect Dis 1998;178:752--9.
Viral hemorrhagic fever
Rollin PE, Nichol ST, Zaki S, Ksiazek TG. Arenaviruses and filoviruses. In: Manual of Clinical Microbiology, 9th ed 2007; ASM Press, Washington, 1510--22.
Fichet-Calvet E, Rogers DJ. Risk maps of Lassa fever in West Africa. PLoS Neglected Tropical Diseases 2009; 3(3):e388.
Ergonul O. Crimean-Congo Haemorrhagic Fever. Lancet Infectious Diseases 2006; 6(4):203--14.
Amorosa V, MacNeil A, McConnell R, et al. Imported Lassa fever, Pennsylvania, USA, 2010. Emerg Infect Dis. 2010;16:1598--600.
Use of trade names and commercial sources is for identification only and does not imply endorsement by the U.S. Department of
Health and Human Services.
References to non-CDC sites on the Internet are
provided as a service to MMWR readers and do not constitute or imply
endorsement of these organizations or their programs by CDC or the U.S.
Department of Health and Human Services. CDC is not responsible for the content
of pages found at these sites. URL addresses listed in MMWR were current as of
the date of publication.
All MMWR HTML versions of articles are electronic conversions from typeset documents.
This conversion might result in character translation or format errors in the HTML version.
Users are referred to the electronic PDF version (http://www.cdc.gov/mmwr)
and/or the original MMWR paper copy for printable versions of official text, figures, and tables.
An original paper copy of this issue can be obtained from the Superintendent of Documents, U.S.
Government Printing Office (GPO), Washington, DC 20402-9371;
telephone: (202) 512-1800. Contact GPO for current prices.
**Questions or messages regarding errors in formatting should be addressed to
mmwrq@cdc.gov.
Centers for Disease Control and Prevention 1600 Clifton Road Atlanta, GA 30329-4027, USA
800-CDC-INFO (800-232-4636) TTY: (888) 232-6348 - Contact CDC–INFO