Persons using assistive technology might not be able to fully access information in this file. For assistance, please send e-mail to: mmwrq@cdc.gov. Type 508 Accommodation and the title of the report in the subject line of e-mail.
Summary of Notifiable Diseases --- United States, 2008
Prepared by
Patsy A. Hall-Baker, Coordinator, Summary of Notifiable Diseases1
1Division of Notifiable Disease Surveillance (Proposed), the Office of Surveillance, Epidemiology and Laboratory Services (Proposed), CDC
2McKing Consulting Corporation
Preface
The Summary of Notifiable Diseases--- United States, 2008 contains the official statistics, in tabular and graphic form, for the reported occurrence of nationally notifiable infectious diseases in the United States for 2008. Unless otherwise noted, the data are final totals for 2008 reported as of June 30, 2009. These statistics are collected and compiled from reports sent by state health departments and territories to the National Notifiable Diseases Surveillance System (NNDSS), which is operated by CDC in collaboration with the Council of State and Territorial Epidemiologists (CSTE). The Summary is available at http://www.cdc.gov/mmwr/summary.html. This site also includes publications from previous years.
The Highlights section presents noteworthy epidemiologic and prevention information for 2008 for selected diseases and additional information to aid in the interpretation of surveillance and disease-trend data. Part 1 contains tables showing incidence data for the nationally notifiable infectious diseases during 2008.* The tables provide the number of cases reported to CDC for 2008 and the distribution of cases by month, geographic location, and the patient's demographic characteristics (age, sex, race, and ethnicity). Part 2 contains graphs and maps that depict summary data for certain notifiable infectious diseases described in tabular form in Part 1. Part 3 contains tables that list the number of cases of notifiable diseases reported to CDC since 1977. This section also includes a table enumerating deaths associated with specified notifiable diseases reported to CDC's National Center for Health Statistics (NCHS) during 2002--2006. The Selected Reading section presents general and disease-specific references for notifiable infectious diseases. These references provide additional information on surveillance and epidemiologic concerns, diagnostic concerns, and disease-control activities.
Comments and suggestions from readers are welcome. To increase the usefulness of future editions, comments about the current report and descriptions of how information is or could be used are invited. Comments should be sent to Data Operations Team---NNDSS, Division of Notifiable Disease Surveillance (Proposed), Public Health Surveillance Program Office (Proposed) at soib@cdc.gov.
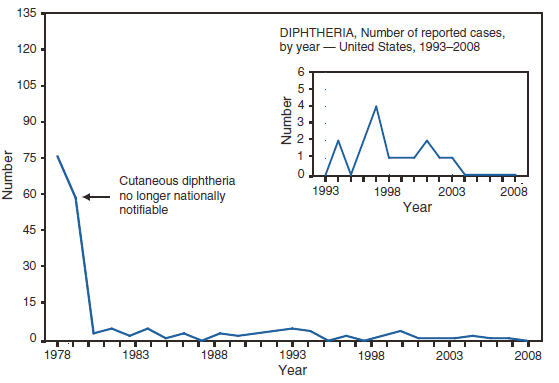
* No cases of anthrax; diphtheria; Eastern equine encephalitis virus disease, non-neuroinvasive; poliomyelitis, paralytic; poliovirus infection, nonparalytic; Powassan virus disease, nonneuroinvasive; rubella, congenital syndrome; severe acute respiratory syndrome-associated coronavirus disease (SARS-CoV); smallpox; vancomycin-resistant Staphylococcus aureus (VRSA) infection; Western equine encephalitis virus disease, neuroinvasive and nonneuroinvasive; and yellow fever were reported in 2008. Data on chronic hepatitis B and hepatitis C virus infection (past or present) are not included because they are undergoing data quality review. Data on human immunodeficiency virus (HIV) infections are not included because HIV infection reporting has been implemented on different dates and using different methods than for AIDS case reporting.
Background
The infectious diseases designated as notifiable at the national level during 2008 are listed in this section. A notifiable disease is one for which regular, frequent, and timely information regarding individual cases is considered necessary for the prevention and control of the disease. A brief history of the reporting of nationally notifiable infectious diseases in the United States is available at http://www.cdc.gov/ncphi/disss/nndss/nndsshis.htm. In 1961, CDC assumed responsibility for the collection and publication of data on nationally notifiable diseases. NNDSS is neither a single surveillance system nor a method of reporting. Certain NNDSS data are reported to CDC through separate surveillance information systems and through different reporting mechanisms; however, these data are aggregated and compiled for publication purposes.
Notifiable disease reporting at the local level protects the public's health by ensuring the proper identification and follow-up of cases. Public health workers ensure that persons who are already ill receive appropriate treatment; trace contacts who need vaccines, treatment, quarantine, or education; investigate and halt outbreaks; eliminate environmental hazards; and close premises where spread has occurred. Surveillance of notifiable conditions helps public health authorities to monitor the impact of notifiable conditions, measure disease trends, assess the effectiveness of control and prevention measures, identify populations or geographic areas at high risk, allocate resources appropriately, formulate prevention strategies, and develop public health policies. Monitoring surveillance data enables public health authorities to detect sudden changes in disease occurrence and distribution, identify changes in agents and host factors, and detect changes in health-care practices.
The list of nationally notifiable infectious diseases is revised periodically. A disease might be added to the list as a new pathogen emerges, or a disease might be deleted as its incidence declines. Public health officials at state health departments and CDC collaborate in determining which diseases should be nationally notifiable. CSTE, with input from CDC, makes recommendations annually for additions and deletions. Although disease reporting is mandated by legislation or regulation at the state and local levels, state reporting to CDC is voluntary. Reporting completeness of notifiable diseases is highly variable and related to the condition or disease being reported (1). The list of diseases considered notifiable varies by state and year. Current and historic national public health surveillance case definitions used for classifying and enumerating cases consistently across reporting jurisdictions are available at http://www.cdc.gov/ncphi/disss/nndss/nndsshis.htm.
Infectious Diseases Designated as Notifiable at the National Level during 2008*
Acquired immunodeficiency syndrome (AIDS)
Anthrax
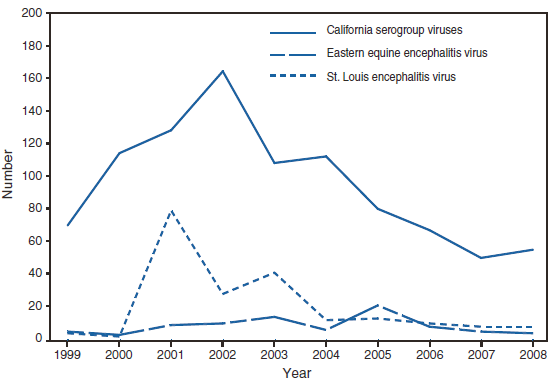
Domestic arboviral diseases, neuroinvasive and nonneuroinvasive
California serogroup virus
Eastern equine encephalitis virus
Powassan virus
St. Louis encephalitis virus
West Nile virus
Western equine encephalitis virus
Botulism
foodborne
infant
other (wound and unspecified)
Brucellosis
Chancroid
Chlamydia trachomatis infections
Cholera
Coccidioidomycosis†
Cryptosporidiosis
Cyclosporiasis
Diphtheria
Ehrlichiosis/Anaplasmosis†
Ehrlichia chaffeensis
Ehrlichia ewingii
Anaplasma phagocytophilum
Undetermined
Giardiasis
Gonorrhea
Haemophilus influenzae, invasive disease
Hansen disease (Leprosy)
Hantavirus pulmonary syndrome
Hemolytic uremic syndrome, post-diarrheal
Hepatitis, viral, acute
Hepatitis A, acute
Hepatitis B, acute
Hepatitis B virus, perinatal infection
Hepatitis C, acute
Hepatitis, viral, chronic
Chronic Hepatitis B
Hepatitis C virus infection (past or present)
Human Immunodeficiency Virus infection
Adult (age ≥13 yrs)
Pediatric (age <13 yrs)
Influenza-associated pediatric mortality
Legionellosis
Listeriosis
Lyme disease†
Malaria
Measles
Meningococcal disease
Mumps†
Novel influenza A virus infections
Pertussis
Plague
Poliomyelitis, paralytic
Poliovirus infection, nonparalytic
Psittacosis
Q fever†
acute
chronic
Rabies
animal
human
Rocky Mountain spotted fever†
Rubella
Rubella, congenital syndrome
Salmonellosis
Severe acute respiratory syndrome-associated coronavirus (SARS-CoV) disease
Shiga toxin-producing Escherichia coli (STEC)
Shigellosis
Smallpox
Streptococcal disease, invasive, Group A
Streptococcal toxic-shock syndrome
Streptococcus pneumoniae, drug resistant, all ages, invasive disease
Streptococcus pneumoniae, invasive disease non-drug resistant, in children aged <5 years
* Position Statements the Council of State and Territorial Epidemiologists approved in 2007 for national surveillance were implemented beginning in January 2008. No new conditions were added to the Notifiable disease list in 2008
† Revised national surveillance case definition.
Data Sources
Provisional data concerning the reported occurrence of nationally notifiable infectious diseases are published weekly in MMWR. After each reporting year, staff in state health departments finalize reports of cases for that year with local or county health departments and reconcile the data with reports previously sent to CDC throughout the year. These data are compiled in final form in the Summary.
Notifiable disease reports are the authoritative and archival counts of cases. They are approved by the appropriate chief epidemiologist from each submitting state or territory before being published in the Summary. Data published in MMWR Surveillance Summaries or other surveillance reports produced by CDC programs might not agree exactly with data reported in the annual Summary because of differences in the timing of reports, the source of the data, or surveillance methodology.
Data in the Summary were derived primarily from reports transmitted to CDC from health departments in the 50 states, five territories, New York City, and the District of Columbia. Data were reported for MMWR weeks 1--53, which correspond to the period for the week ending January 5, 2008, through the week ending January 3, 2009. More information regarding infectious notifiable diseases, including case definitions, is available at http://www.cdc.gov/ncphi/disss/nndss/nndsshis.htm. Policies for reporting notifiable disease cases can vary by disease or reporting jurisdiction. The case-status categories used to determine which cases reported to NNDSS are published by disease or condition and are listed in the print criteria column of the 2008 NNDSS event code list (available at http://www.cdc.gov/ncphi/disss/nndss/phs/files/NNDSS_event_code_list_January_2008.pdf).
Final data for certain diseases are derived from the surveillance records of the CDC programs listed below. Requests for further information regarding these data should be directed to the appropriate program.
Office of Surveillance, Epidemiology and Laboratory Services (Proposed)
National Center for Health Statistics (NCHS) Office of Vital and Health Statistics Systems (deaths from selected notifiable diseases).
Office of Infectious Diseases (Proposed)
National Center for HIV/AIDS, Viral Hepatitis, STD, and TB Prevention (NCHHSTP). Division of HIV/AIDS Prevention (AIDS and HIV infection)
Division of STD Prevention (chancroid; Chlamydia trachomatis, genital infection; gonorrhea; and syphilis)
Division of Tuberculosis Elimination (tuberculosis)
National Center for Immunization and Respiratory Diseases Influenza Division (influenza-associated pediatric mortality).
Division of Viral Diseases, (poliomyelitis, varicella [morbidity and deaths], and SARS-CoV).
National Center for Emerging and Zoonotic Infectious Diseases (Proposed) Division of Vector-Borne Diseases (arboviral diseases).
Division of Viral and Rickettsial Diseases (animal rabies).
Population estimates for the states are from the NCHS bridged-race estimates of the July 1, 2000--July 1, 2007 U.S. resident population from the vintage 2007 postcensal series by year, county, age, sex, race, and Hispanic origin, prepared under a collaborative arrangement with the U.S. Census Bureau. This data set was released on August 16, 2007, and is available at http://www.cdc.gov/nchs/about/major/dvs/popbridge/popbridge.htm. Populations for territories are 2007 estimates from the U.S. Census Bureau International Data Base, available at http://www.census.gov/ipc/www/idb/summaries.html. The choice of population denominators for incidence reported in MMWR is based on 1) the availability of census population data at the time of preparation for publication and 2) the desire for consistent use of the same population data to compute incidence reported by different CDC programs. Incidence in the Summary is calculated as the number of reported cases for each disease or condition divided by either the U.S. resident population for the specified demographic population or the total U.S. resident population, multiplied by 100,000. When a nationally notifiable disease is associated with a specific age restriction, the same age restriction is applied to the population in the denominator of the incidence calculation. In addition, population data from states in which the disease or condition was not notifiable or was not available were excluded from incidence calculations. Unless otherwise stated, disease totals for the United States do not include data for American Samoa, Guam, Puerto Rico, the Commonwealth of the Northern Mariana Islands, or the U.S. Virgin Islands.
Interpreting Data
Incidence data in the Summary are presented by the date of report to CDC as determined by the MMWR week and year assigned by the state or territorial health department, except for the domestic arboviral diseases, which are presented by date of diagnosis. Data are reported by the state in which the patient resided at the time of diagnosis. For certain nationally notifiable infectious diseases, surveillance data are reported independently to different CDC programs. For this reason, surveillance data reported by other CDC programs might vary from data reported in the Summary because of differences in 1) the date used to aggregate data (e.g., date of report or date of disease occurrence), 2) the timing of reports, 3) the source of the data, 4) surveillance case definitions, and 5) policies regarding case jurisdiction (i.e., which state should report the case to CDC).
The data reported in the Summary are useful for analyzing disease trends and determining relative disease burdens. However, reporting practices affect how these data should be interpreted. Disease reporting is likely incomplete, and completeness might vary depending on the disease and reporting state. The degree of completeness of data reporting might be influenced by the diagnostic facilities available; control measures in effect; public awareness of a specific disease; and the resources, and priorities of state and local officials responsible for disease control and public health surveillance. Finally, factors such as changes in methods for public health surveillance, introduction of new diagnostic tests, or discovery of new disease entities can cause changes in disease reporting that are independent of the true incidence of disease.
Public health surveillance data are published for selected racial/ethnic populations because these variables can be risk markers for certain notifiable diseases. Race and ethnicity data also can be used to highlight populations for focused prevention efforts. However, caution must be used when drawing conclusions from reported race and ethnicity data. Different racial/ethnic populations might have different patterns of access to health care, potentially resulting in data that are not representative of actual disease incidence among specific racial/ethnic populations. Surveillance data reported to NNDSS are in either individual case-specific form or summary form (i.e., aggregated data for a group of cases). Summary data often lack demographic information (e.g., race); therefore, the demographic-specific rates presented in the Summary might be underestimated.
In addition, not all race and ethnicity data are collected or reported uniformly for all diseases, the standards for race and ethnicity have changed over time, and the transition in implementation to the newest race and ethnicity standard has taken varying amounts of time for different CDC surveillance systems. For example, in 1990, the National Electronic Telecommunications System for Surveillance (NETSS) was established to facilitate data collection and submission of case-specific data to CDC's National Notifiable Diseases Surveillance System, except for selected diseases. In 1990, NETSS implemented the 1977 Office of Management and Budget (OMB) standard for race and ethnicity, in which race and ethnicity were collected in one variable. Other surveillance programs implemented two variables for collection of race and ethnicity data. The 1997 OMB race and ethnicity standard, which requires collection of multiple races per person using multiple race variables, should have been implemented by federal programs beginning January 1, 2003. In 2003, the CDC Tuberculosis and HIV/AIDS programs were able to update their surveillance systems to implement 1997 OMB standards. In 2005 the STD*MIS system was also updated to implement the 1997 OMB standards. In 2003, the CDC's Division of Tuberculosis Elimination was able to update the Tuberculosis Information Management System (TIMS) to implement the 1997 OMB race/ethnicity standards. However, in 2003, other diseases that constitute NETSS were undergoing a major change in the manner in which data were collected and reported to CDC. This change is known as the transition from NETSS to the National Electronic Disease Surveillance System (NEDSS). NEDSS implemented the newer 1997 OMB standard for race and ethnicity. However, the transition from NETSS to NEDSS was slower than originally expected relative to reporting data to CDC using NEDSS and hence some data are currently reported to CDC using NETSS and NEDSS formats, even if the data in the reporting jurisdictions are collected using NEDSS. Until the transition to NEDSS is complete, race and ethnicity data collected or reported to NETSS using different race and ethnicity standards will need to be converted to one standard. The data are now converted to the 1977 OMB standard originally implemented in NETSS.
Although the recommended standard for classifying a person's race or ethnicity is based on self-reporting, this procedure might not always be followed.
Transition in NNDSS Data Collection and Reporting
Before 1990, data were reported to CDC as cumulative counts rather than individual case reports. In 1990, states began electronically capturing and reporting individual case reports without personal identifiers to CDC by using NETSS. In 2001, CDC launched NEDSS, now a component of the Public Health Information Network, to promote the use of data and information system standards that advance the development of efficient, integrated, and interoperable surveillance information systems at the local, state, and federal levels. One of the objectives of NEDSS is to improve the accuracy, completeness, and timeliness of disease reporting at the local, state, and national level. CDC has developed the NEDSS Base System (NBS), a public health surveillance information system adopted by 16 states; 31 states have their own NEDSS-compatible based system, and three in the final stage of adoption. A major feature of all NEDSS compatible solutions, which includes NBS, is the ability to capture data already in electronic form (e.g., electronic laboratory results, which are needed for case confirmation) rather than enter these data manually as in NETSS. In 2008, 16 states used NBS to transmit nationally notifiable infectious diseases to CDC, 24 states used a NEDSS-compatible based system, and the remaining states and territorial jurisdictions continued to use the NETSS or other applications. Additional information concerning NEDSS is available at http://www.cdc.gov/phin/activities/applications-services/nedss/index.html.
Methodology for Identifying which Nationally Notifiable Infectious Diseases are Reportable
States and jurisdictions are sovereign entities. Reportable conditions are determined by laws and regulations of each state and jurisdiction. It is possible that some conditions deemed nationally notifiable might not be reportable in certain states or jurisdictions. Determining which nationally notifiable infectious diseases are reportable in National Notifiable Diseases Surveillance System (NNDSS) reporting jurisdictions was determined by analyzing results of the 2008 State Reportable Conditions Assessment (SRCA). This assessment solicited information from each NNDSS reporting jurisdiction (all 50 U.S. states, the District of Columbia, New York City, and five U.S. territories) regarding which public health conditions were reportable for more than 6 months in 2008 by clinicians, laboratories, hospitals, or "other" public health reporters, as mandated by law or regulation. In 2008, to assist in the implementation of the SRCA, the NNDSS program provided technical assistance to the Council of State and Territorial Epidemiologists (CSTE).
In 2007, SRCA became the first collaborative project of such technical magnitude ever conducted by CSTE and CDC. Previously, CDC and CSTE had gathered public health reporting requirements independently. The 2008 SRCA collected information regarding whether each reportable condition was 1) explicitly reportable (i.e., listed as a specific disease or as a category of diseases on reportable disease lists), 2) whether it was implicitly reportable (i.e., included in a general category of the reportable disease list, such as "rare diseases of public health importance"), or 3) not reportable. Only explicitly reportable conditions were considered reportable for the purpose of national public health surveillance and thus reflected in the NNDSS. Moreover, to determine whether a condition included in the SRCA was reportable across all public health reporter categories and for a specific nationally notifiable infectious disease (NNID) in a reporting jurisdiction, CDC developed and applied a condition algorithm and a results algorithm to run on the data collected in the SRCA. Analyzed results of the 2008 SRCA were used to determine whether a NNID was not reportable in a reporting jurisdiction in 2008 and thus noted with an "N" indicator (for "not reportable") in the front tables of this report.
In May 2005, the World Health Assembly adopted revised International Health regulations (IHR) (2) that went into effect in the United States on July 18, 2007. This international legal instrument governs the role of the World Health Organization (WHO) and its member countries, including the United States, in identifying, responding to, and sharing information about Public Health Emergencies of International Concern (PHEIC). A PHEIC is an extraordinary event that 1) constitutes a public health risk to other countries through international spread of disease, and 2) potentially requires a coordinated international response.
The IHR are designed to prevent and protect against the international spread of diseases while minimizing the effect on world travel and trade. Countries that have adopted these rules have a much broader responsibility to detect, respond to, and report public health emergencies that potentially require a coordinated international response in addition to taking preventive measures. The IHR will help countries work together to identify, respond to, and share information about PEHIC.
The revised IHR represent a conceptual shift from a predefined disease list to a framework of reporting and responding to events on the basis of an assessment of public health criteria, including seriousness, unexpectedness, and international travel and trade implications. PHEIC are events that fall within those criteria (further defined in a decision algorithm in Annex 2 of the revised IHR). Four conditions always constitute a PHEIC and do not require the use of the IHR decision instrument in Annex 2: Severe Acute Respiratory Syndrome (SARS), smallpox, poliomyelitis caused by wild-type poliovirus, and human influenza caused by a new subtype. Any other event requires the use of the decision algorithm in Annex 2 of the IHR to determine if it is a potential PHEIC. Examples of events that require the use of the decision instrument include, but are not limited to, cholera, pneumonic plague, yellow fever, West Nile fever, viral hemorrhagic fevers, and meningococcal disease. Other biologic, chemical, or radiologic events might fit the decision algorithm and also must be reportable to WHO. All WHO member states are required to notify WHO of a potential PHEIC. WHO makes the final determination about the existence of a PHEIC.
Health-care providers in the United States are required to report diseases, conditions, or outbreaks as determined by local, state, or territorial law and regulation, and as outlined in each state's list of reportable conditions. All health-care providers should work with their local, state, and territorial health agencies to identify and report events that might constitute a potential PHEIC occurring in their location. U.S. State and Territorial Departments of Health have agreed to report information about a potential PHEIC to the most relevant federal agency responsible for the event. In the case of human disease, the U.S. State or Territorial Departments of Health will notify CDC rapidly through existing formal and informal reporting mechanisms (3). CDC will further analyze the event based on the decision algorithm in Annex 2 of the IHR and notify the U.S. Department of Health and Human Services (DHHS) Secretary's Operations Center (SOC), as appropriate.
DHHS has the lead role in carrying out the IHR, in cooperation with multiple federal departments and agencies. The HHS SOC is the central body for the United States responsible for reporting potential events to WHO. The United States has 48 hours to assess the risk of the reported event. If authorities determine that a potential PHEIC exists, the WHO member country has 24 hours to report the event to WHO.
An IHR decision algorithm in Annex 2 has been developed to help countries determine whether an event should be reported. If any two of the following four questions can be answered in the affirmative, then a determination should be made that a potential PHEIC exists and WHO should be notified:
Is the public health impact of the event serious?
Is the event unusual or unexpected?
Is there a significant risk of international spread?
Is there a significant risk of international travel or trade restrictions?
At its annual meeting in June 2007, the Council of State and Territorial Epidemiologists (CSTE) approved a position statement to support the implementation of the IHR in the United States (3). CSTE also approved a position statement in support of the 2005 IHR adding initial detections of novel influenza A virus infections to the list of nationally notifiable diseases reportable to NNDSS, beginning in January 2007 (4).
Doyle TJ, Glynn MK, Groseclose LS. Completeness of notifiable infectious disease reporting in the United States: an analytical literature review. Am J Epidemiol 2002;155:866--74.
Council of State and Territorial Epidemiologists. Events that may constitute a public health emergency of international concern. Position statement 07-ID-06. Available at http://www.cste.org/PS/2007ps/2007psfinal/ID/07-ID-06.pdf.
Below are summary highlights for certain national notifiable diseases. Highlights are intended to assist in the interpretation of major occurrences that affect disease incidence or surveillance trends (e.g., outbreaks, vaccine licensure, or policy changes).
AIDS
Since 1981, confidential name-based AIDS surveillance has been the cornerstone of national, state, and local efforts to monitor the scope and impact of the human immunodeficiency virus (HIV) epidemic. The data have multiple uses, including the development of policy to help prevent and control AIDS. However, because of the introduction of therapies that effectively slow the progression of HIV infection, AIDS data no longer adequately represent the populations affected by the epidemic. By helping public health practitioners understand the epidemic at an earlier stage, combined HIV and AIDS data better represent the overall impact of HIV. As of April 2008, all 50 states, the District of Columbia, and five U.S. territories had implemented confidential name-based HIV surveillance into their AIDS surveillance systems; names or other personal identifying information are not reported to CDC.
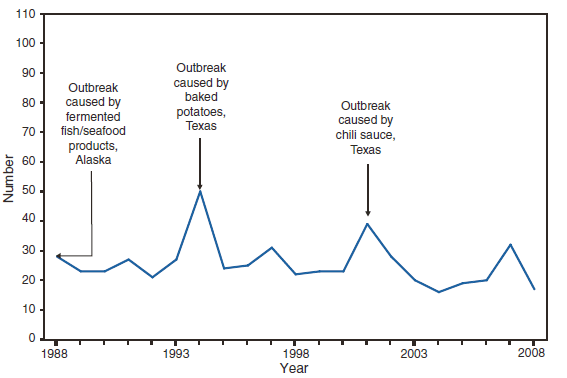
Botulism
Botulism is a severe paralytic illness caused by toxins produced by Clostridium botulinum. Exposure to toxin can occur by ingestion (foodborne botulism) or by in situ production from C. botulinum colonization of a wound (wound botulism) or the gastrointestinal tract (infant botulism and adult intestinal colonization botulism) (1). CDC maintains intensive surveillance for cases of botulism in the United States with a 24 hour/7 day a week consultation service. Health-care providers should report suspected botulism cases immediately to their state health departments; all states maintain 24-hour telephone services for reporting of botulism and other public health emergencies. Additional emergency consultation is available from the CDC botulism duty officer via the CDC Emergency Operations Center, telephone 660-488-7100. In 2008, cases were attributed to foodborne botulism, wound botulism, infant botulism, and unknown forms of botulism.
Sobel J. Botulism. Clin Infect Dis 2005;41:1167--73.
Brucellosis
The incidence of brucellosis in the United States increased from 2003 until 2007. The number of reported cases in 2008 decreased 36.0% from the previous year. Overall, the demographic characteristics of persons with brucellosis remained stable. For patients for whom ethnicity was identified, 62.3% were Hispanic. The majority of cases were reported in the Southwest.
In the U.S. animal population, brucellosis eradication efforts continue. In 2008, the U.S. Department of Agriculture declared Texas a brucellosis Class Free state. Montana was reclassified as a Class A state following the report of a second brucellosis-affected herd within 2 years (1). In total, 49 states and three territories were classified as brucellosis Class Free states at the end of 2008 (1). Brucella abortus remains enzootic in elk and bison in the greater Yellowstone National Park area, and Brucella suis is enzootic in feral swine in the Southeast.
Risk factors associated with brucellosis include the consumption of unpasteurized milk or soft cheeses. The risk for brucellosis from domestic dairy products is low. Unpasteurized dairy products from countries with endemic brucellosis remains a source of brucellosis for immigrants and travelers. Hunters are at an elevated risk for contracting brucellosis from the carcass or meat of infected animals. In addition, exposure to Brucella spp. can occur in diagnostic and research laboratories because of the potential for aerosol transmission (2). For the same reason, biosafety level 3 practices, containment, and equipment are recommended for laboratory manipulation of isolates (3). In the event of an exposure, postexposure prophylaxis can effectively prevent illness (4). CDC provides recommendations for laboratory exposures and can assist with the serologic monitoring of laboratory workers who are affected.
CDC, National Institutes of Health. Biosafety in microbiological and biomedical laboratories (BMBL). 5th ed. Washington, DC: US Department of Health and Human Services, CDC, National Institutes of Health; 2007. Available at http://www.cdc.gov/OD/OHS/biosfty/bmbl5/bmbl_5th_edition.pdf.
Cases of cholera continue to be rare in the United States. Cases reported in 2008 were fewer than the average number of cases per year reported during 2003--2007 (mean: 6.8) (1). Foreign travel continues to be the primary source of illness for cholera in the United States. Cholera remains a global threat to health, particularly in areas with poor access to improved water and sanitation, such as sub-Saharan Africa (2,3). The single patient with domestic exposure in 2008 ate crab harvested from the U.S. Gulf Coast. Other serogroups of toxin-producing Vibrio cholerae (e.g., O141 and O75) also have caused severe diarrhea in patients who have a history of consumption of seafood from the Gulf Coast (4).
Steinberg EB, Greene KD, Bopp CA, Cameron DN, Wells JG, Mintz ED. Cholera in the United States, 1995--2000: trends at the end of the twentieth century. J Infect Dis 2001;184:799--802.
Gaffga NH, Tauxe RV, Mintz ED. Cholera: a new homeland in Africa. Am J Trop Med Hyg 2007;77:705--13.
Mintz ED, Guerrant RL. A lion in our village -- the unconscionable tragedy of cholera in Africa. New Engl J Med 2009;360:1061--3.
Tobin-D'Angelo M, Smith AR, Bulens SN, et al. Severe diarrhea caused by cholera toxin--producing Vibrio cholerae serogroup O75 infections acquired in the southeastern United States. Clin Infect Dis 2008;47:1035--40.
Coccidioidomycosis
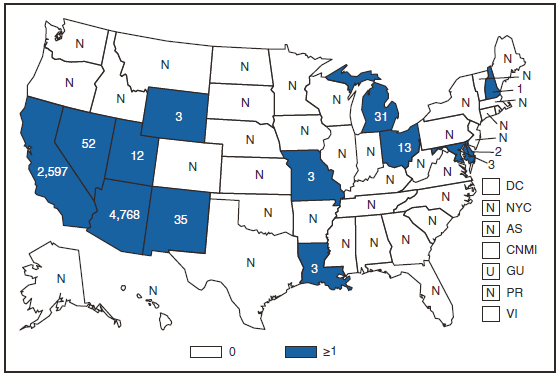
Coccidioidomycosis is a common cause of community-acquired fungal pneumonia in disease-endemic areas of the southwest United States; however, clinical suspicion and laboratory testing occur infrequently (1). Fungal conidia survive in the soil and are propagated in an airborne manner, particularly when soil is disrupted. In the southwest United States, alkaline soil and climate support coccidioidomycosis growth and propagation. In recent years, strategies to model the effects of climate on disease incidence have begun, which include linking changes in incidence to climatic change, particularly in the region where the disease is endemic (2--4).
Case counts decreased for the first time in a decade during 2007. In 2008, reported coccidioidomycosis cases in the United States decreased again, primarily because of fewer reports received from the disease-endemic states of California and, to a lesser extent, Arizona. Case counts decreased even after the case definition revision implemented by the Council of State and Territorial Epidemiologists in 2007 included less stringent diagnostic criteria.
In 2009, certain laboratories in Arizona, where approximately 60% of coccidioidomycosis cases in the United States occur, modified their reporting criteria to include all cases with a positive enzyme immunoassay without confirmation by immunodiffusion assay. As a result, case counts in Arizona might increase during 2009; however, such an increase can be attributed to a less stringent case definition.
Valdivia L, Nix D, Wright M, et al. Coccidioidomycosis as a common cause of community-acquired pneumonia. Emerg Infect Dis 2006;12:958--62.
Park B, Sigel K, Vaz V, et al. An epidemic of coccidioidomycosis in Arizona associated with climatic changes, 1998--2001. J Infect Dis 2005;191:1981--7.
Comrie AC. Climate factors influencing coccidioidomycosis seasonality and outbreaks. Environ Health Perspect 2005;113:688--92.
Kolivras KN, Comrie AC. Modeling valley fever (coccidioidomycosis) incidence on the basis of climate condition. Int J Biometeorol 2003;47:87--101.
Cryptosporidiosis
The number of cryptosporidiosis cases reported to CDC increased during 2005--2007. Despite a decrease in the number of cases reported in 2008, cryptosporidiosis incidence was approximately threefold greater compared with 2004.
As in previous years, cryptosporidiosis case reports were influenced by outbreaks, particularly those associated with treated recreational water. Although cryptosporidiosis affects persons in all age groups, the number of reported cases occurred more frequently among children aged 1--9 years. A tenfold increase in transmission of cryptosporidiosis occurred during summer through early fall, coinciding with increased use of recreational water by younger children, which is a known risk factor for cryptosporidiosis. Cryptosporidium oocysts can be detected routinely in treated recreational water (1). Contamination of, and the subsequent transmission through, recreational water is facilitated by the substantial number of Cryptosporidium oocysts that can be shed by a single person; the extended time that oocysts can be shed (2); the low infectious dose (3); the resistance of Cryptosporidium oocysts to chlorine (4); and the prevalence of improper pool maintenance (i.e., insufficient disinfection, filtration, and recirculation of water), particularly of children's wading pools (5). The application of molecular epidemiology (i.e., genotyping and subtyping Cryptosporidium specimens) to clinical and environmental samples has demonstrated potential to expand our knowledge of Cryptosporidium epidemiology (6). In 2008, CDC partnered with state and local health professionals to release Cryptosporidiosis Outbreak and Response Evaluation (CORE) guidelines (http://www.cdc.gov/crypto/resources/core_guidelines.pdf) that health departments, aquatic facilities, and child care programs can implement to reduce the risk of community-wide spread.
Shields JM, Gleim ER, Beach MJ. Prevalence of Cryptosporidium spp. and Giardia intestinalis in swimming pools, Atlanta, Georgia. Emerg Infect Dis 2008;14:948--50.
Chappell CL, Okhuysen PC, Sterling CR, DuPont HL. Cryptosporidium parvum: intensity of infection and oocyst excretion patterns in healthy volunteers. J Infect Dis 1996;173:232--6.
DuPont HL, Chappell CL, Sterling CR, Okhuysen PC, Rose JB, Jakubowski W. The infectivity of Cryptosporidium parvum in healthy volunteers. N Engl J Med 1995;332:855--9.
Shields JM, Hill VR, Arrowood MJ, Beach MJ. Inactivation of Cryptosporidiumparvum under chlorinated recreational water conditions. J Water Health. 2008;6:513--20.
Xiao L. Molecular epidemiology of cryptosporidiosis: an update. Exp Parasitol 2009 April 7 [Epub ahead of print].
Domestic Arboviral, Neuroinvasive and Nonneuroinvasive (West Nile virus disease)
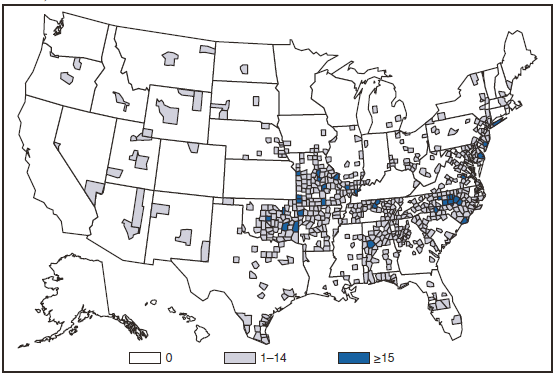
During 2008, West Nile virus (WNV) disease cases were reported from 45 states and the District of Columbia, including 27 counties that had not reported cases previously. Nationally, the reported incidence of West Nile neuroinvasive disease (WNND) was 0.2 cases per 100,000 population, which is lower than that reported in the previous 4 years during 2004--2007 (median: 0.4, range: 0.4-0.5). The highest incidence of WNND continued to occur in western and central states.
In 2008, CDC, the Food and Drug Administration (FDA), and state health departments investigated an increase in false-positive test results obtained with a commercially available WNV test kit (1). The investigation revealed that one particular kit lot was the source of the false-positive results, and that lot was recalled. Among specimens that tested positive using the implicated kit lot that were retested at CDC, 72% were determined to be false-positive results. A higher false-positive percentage was found among patients without evidence of neuroinvasive disease (77%) than patients with evidence of neuroinvasive disease (47%). Commercially available WNV test kits should be used to determine a presumptive diagnosis of WNV neuroinvasive disease. These kits should not be used to test specimens from persons without compatible illness, and any positive result should be confirmed by additional testing at a state health department or CDC. Considering the large proportion of false-positives, CDC recommended that state health departments not classify patients as having WNV disease if the only laboratory evidence was from the recalled kit lot. States have since reevaluated affected cases to arrive at the final WNV disease totals for 2008.
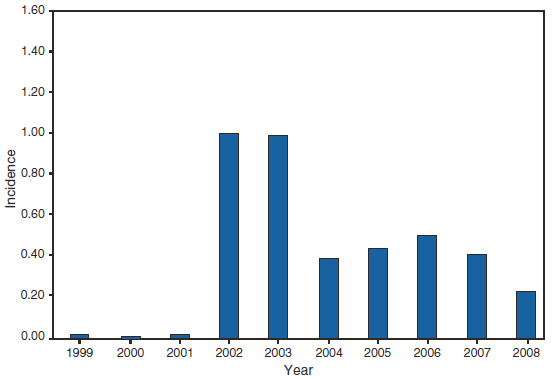
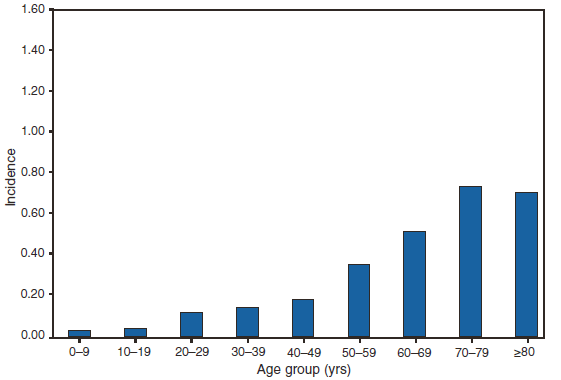
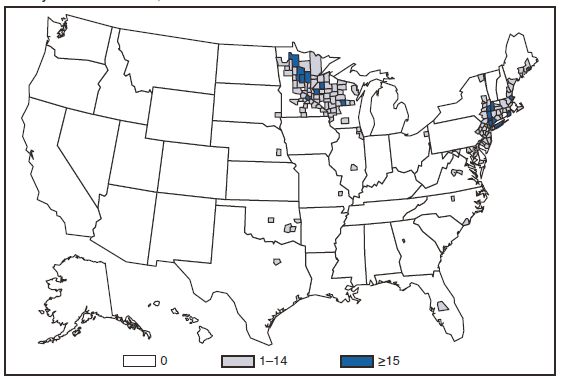
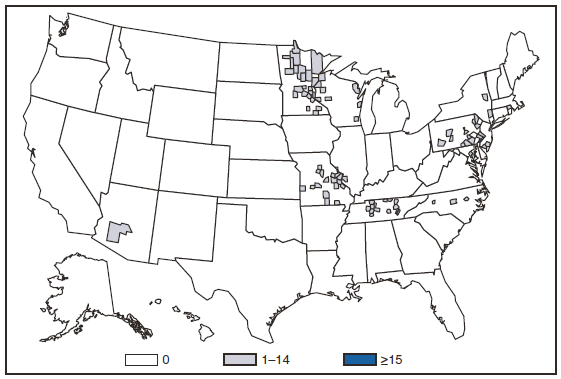
Case definitions for these diseases were modified beginning in 2008 (1) to include a separate designation for Ehrlichia ewingii for better assessment and enumeration of these cases. Four categories of ehrlichiosis and anaplasmosis were reportable during 2008: 1) Ehrlichia chaffeensis, 2) Ehrlichia ewingii, 3) Anaplasma phagocytophilum, and 4) Human ehrlichiosis/anaplasmosis - undetermined. Infection caused by E. chaffeensis was reported primarily from the lower Midwest and the Southeast, reflecting the range of the primary tick vector species (Amblyomma americanum). Infection caused by A. phagocytophilum was reported primarily from the upper Midwest and coastal New England, reflecting both the range of the primary tick vector species (Ixodes scapularis) and preferred animal hosts for tick feeding. Four central U.S. states and Delaware reported nine confirmed cases of E. ewingii infection. The category "Human ehrlichiosis/anaplasmosis - undetermined" includes cases for which a specific etiologic agent could not be identified using available serologic tests. The high number of "Human ehrlichiosis/anaplasmosis - undetermined" cases reported from some northern states (2) reflects state-specific classifications based on indistinguishable antigenic cross-reactivity or situations in which physicians, confused regarding the likely causative agent, ordered single or inappropriate tests (e.g., ordering only ehrlichiosis tests in a region where anaplasmosis would be expected to predominate).
During 2008, cases attributed to E. chaffeensis and A. phagocytophilum increased by 16% and 21%, respectively. Reported ehrlichiosis and anaplasmosis cases have increased every year since this group of diseases became notifiable in 1999. Increases in reported cases might be the result of several factors, including ecological changes influencing disease transmission, changes in diagnostic approaches that alter detection rates, or changes in surveillance and reporting. Changes in the case definition that became effective in January 2008 (1) also might have altered how cases were classified.
Council of State and Territorial Epidemiologists. Revision of the surveillance case definitions for Ehrlichiosis. Position statement 07-ID-03. Atlanta, GA: Council of State and Territorial Epidemiologists; 2007. Available at http://www.cste.org/position%20statements/searchbyyear2007final.asp.
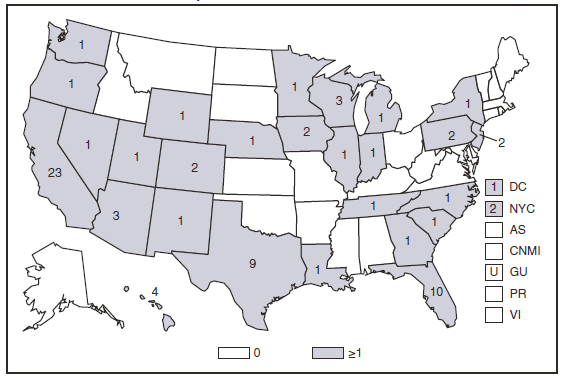
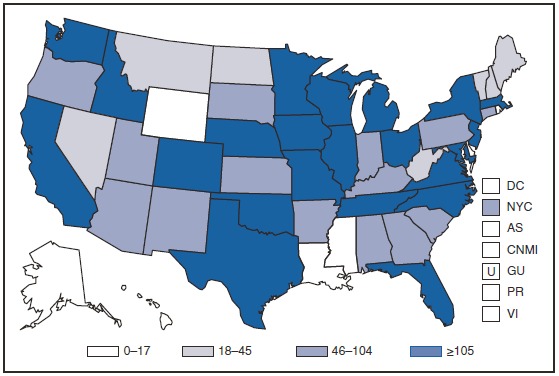
The number of cases of Hansen disease (HD) reported in the United States peaked in 1985 and decreased until 2006. The number of reported cases increased in 2007 and decreased 26.6% in 2008. Cases were reported from 19 states and one territory; 70% of cases were reported from California, Florida, Hawaii, Texas, and New York City. HD is not highly transmissible; cases appear to be related predominantly to immigration from areas in which the disease is endemic. Information on access to clinical care is available at http://www.hrsa.gov/hansens.
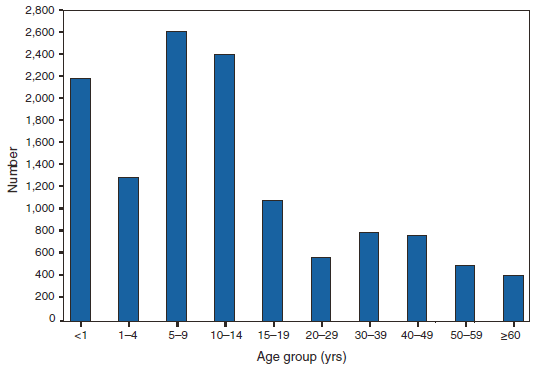
Hemolytic Uremic Syndrome, Postdiarrheal
Hemolytic uremic syndrome (HUS) is characterized by the triad of hemolytic anemia, thrombocytopenia, and renal insufficiency. The most common etiology of HUS in the United States is infection with Shiga toxin-producing Escherichia coli, principally E. coli O157:H7 (1). Approximately 6.3% of all persons infected with E. coli O157:H7, but 15.3% of children aged < 5 years, progress to HUS (2). During 2008, as usual, most reported cases occurred among children aged 1--4 years.
Banatvala N, Griffin PM, Greene KD, et al. The United States prospective hemolytic uremic syndrome study: microbiologic, serologic, clinical, and epidemiologic findings. J Infect Dis 2001;183:1063--70.
Gould L, Demma L, Jones TF, et al. Hemolytic uremic syndrome and death in persons with Escherichia coli O157:H7 infection, Foodborne Diseases Active Surveillance Network Sites, 2000--2006. Clin Infect Dis 2009;49:1480--5.
HIV Infection
As of April 2008, all 50 states, the District of Columbia, and five U.S. dependent areas have laws or regulations requiring confidential name-based reporting for human immunodeficiency virus (HIV) infection, in addition to reporting persons with AIDS. In 2008, CDC published a revised surveillance case definition for HIV infection that includes AIDS and incorporates the HIV infection classification (1). Laboratory-confirmed evidence of HIV infection is now required to meet the surveillance case definition for HIV infection, including stage 3 HIV infection, i.e., AIDS.
In 2002, CDC initiated a system to monitor HIV incidence; in 2003 this system was expanded. On the basis of extrapolations for the 22 states with HIV incidence surveillance, the estimated number of new HIV infections for the United States in 2006 was 56,300 (2).
Hall HI, Song, R, Rhodes P, et al. Estimation of HIV incidence in the United States. JAMA 2008;300:520--9.
Influenza-Associated Pediatric Mortality
In June 2004, the Council of State and Territorial Epidemiologists added influenza-associated pediatric mortality (i.e., among persons aged <18 years) to the list of conditions reportable to the National Notifiable Diseases Surveillance System. Cumulative year-to-date incidence is published each week in MMWR Table I for low-incidence nationally notifiable diseases.
A total of 90 cases of influenza-associated pediatric deaths were reported to CDC during 2008. Pediatric deaths reported during 2008 occurred during the 2006--07, 2007--08, and 2008--09 influenza seasons. In 2008, the median age at death was 5.6 years (range: 29 days--17.9 years). A total of 10 children (11%) were aged <6 months; 14 (16%) were aged 6--23 months; 19 (21%) were aged 24--59 months; and 47 (52%) were aged >5 years. Among all pediatric deaths reported in 2008, 56 (62%) children died after being admitted to the hospital, whereas 34 (38%) died in the emergency room or outside the hospital. Information on underlying or chronic medical conditions was reported for 82 children: 47 (57%) children had one or more underlying or chronic medical conditions, placing them at increased risk for influenza-associated complications. Fifty-one of the 90 children had specimens collected for bacterial culture from normally sterile sites and 15 (29%) were positive. Staphylococcus aureus was the most frequently reported bacterial pathogen in 2008 and was found in 13 (87%) of the 15 children with co-infections. Nine of the Staphylococcus isolates were methicillin-resistant and the remaining four were sensitive to methicillin. Of the 65 children aged >6 months for whom the vaccination status was known, nine had been vaccinated against influenza according to the 2008 Advisory Committee on Immunization Practices recommendations (1). Continued surveillance of influenza-related mortality is important to monitor the effects of influenza and the possible effect of interventions in children.
Listeriosis is a rare but severe infection caused by Listeria monocytogenes; it has been a nationally notifiable disease since 2000. Listeriosis is primarily foodborne and occurs most frequently among persons who are older, pregnant, or immunocompromised. During 2008, most cases occurred among persons aged ≥65 years.
Molecular subtyping of L. monocytogenes isolates and sharing that information through PulseNet has enhanced the ability of public health officials to detect and investigate outbreaks. Recent outbreaks have been linked to ready-to-eat deli meat (1) and unpasteurized cheese (2). During 2008, the incidence of listeriosis in FoodNet/active surveillance sites was 0.29 cases per 100,000 population, representing a decrease of 36% compared with 1996--1998; however, the incidence remained higher than at its lowest point in 2002 (3).
All clinical isolates should be submitted to state public health laboratories for pulsed-field gel electrophoresis pattern determination, and all persons with listeriosis should be interviewed by a public health official or health-care provider using a standard Listeria case form, available at http://www.cdc.gov/national/surveillance/listeria_surveillance.html. Rapid analysis of surveillance data will allow identification of possible food sources of outbreaks.
Gottlieb SL, Newbern EC, Griffin PM, et al. Multistate outbreak of listeriosis linked to turkey deli meat and subsequent changes in US regulatory policy. Clin Infect Dis 2006;42:29--36.
MacDonald PDM, Whitwam RE, Boggs JD, et al. Outbreak of listeriosis among Mexican immigrants caused by illicitly produced Mexican-style cheese. Clin Infect Dis 2005;40:677--82.
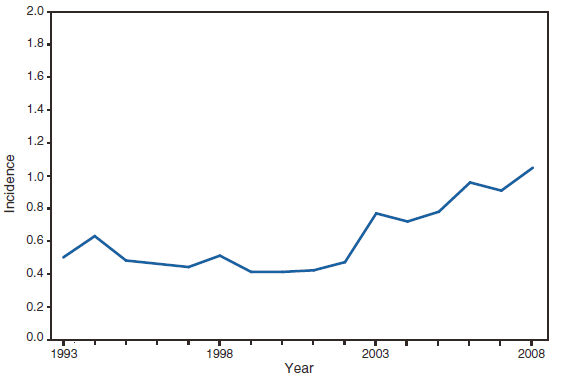
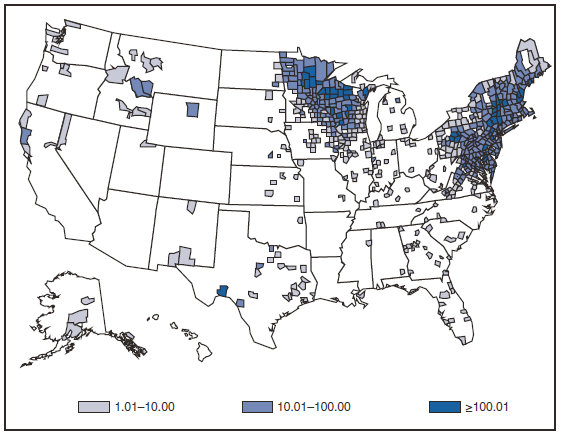
In January 2008, a CSTE-approved revised national surveillance case definition was implemented. The purpose of the revision was to permit states and territories to report confirmed and probable cases of Lyme disease to the National Notifiable Diseases Surveillance System in accordance with the 2007 CSTE position statement template, update the criteria for laboratory evidence of infection to reflect current testing practices, and provide measures to assess the public health surveillance burden. Because of the modifications to the classification of a confirmed case and criteria for laboratory evidence and addition of probable cases to the total case count, the total and confirmed case counts from 2008 are not directly comparable to total case counts reported in previous years. The revised surveillance case definition can be accessed at http://www.cdc.gov/ncphi/disss/nndss/casedef/lyme_disease_2008.htm.
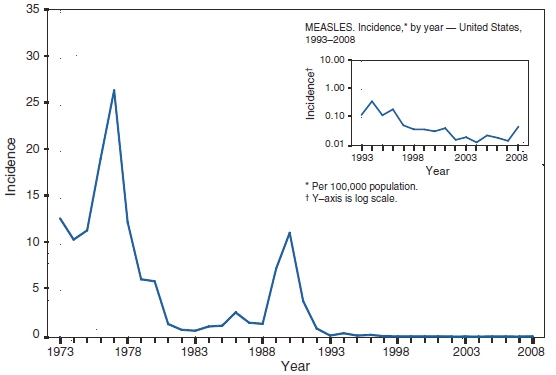
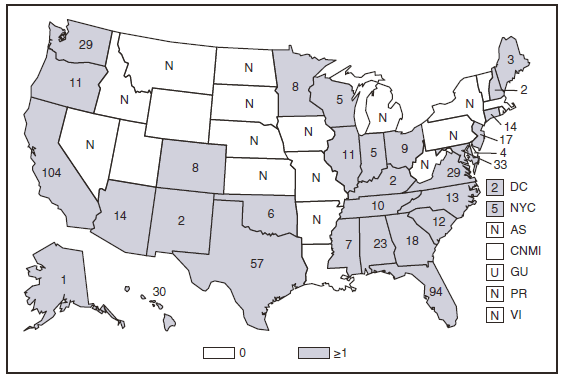
Measles
As in recent years, the majority (125) of confirmed measles cases in 2008 were import-associated (1). Twenty-five cases were internationally imported, including 13 in U.S. residents who had acquired measles while traveling abroad and 12 in non-U.S. residents who had acquired the disease abroad before traveling to the United States. Importations came from 12 countries, many of which are within the WHO European Region. Other import-associated cases included 29 cases with a direct link to an imported case, 22 imported virus cases (i.e., cases that cannot be linked epidemiologically to an imported case, but for which imported virus has been isolated), and 49 cases with link to virus-only cases. The sources of infection for the remaining 15 cases were classified as unknown because no link to importation was found.
Of the 127 U.S. residents with measles in 2008, 7 were vaccinated, 21 had unknown vaccination histories, and 99 were not vaccinated. Of the 99 cases in unvaccinated U.S. residents: 67% were among persons unvaccinated because of their personal or religious beliefs. Fourteen cases occurred among children unvaccinated because of missed opportunity, delayed vaccination, or unknown reasons. This group included mostly children aged 12--15 months, who had not been vaccinated, or older toddlers whose parents delayed vaccination but did not state any religious or personal objections to vaccination. Seventeen cases occurred in children too young to be vaccinated routinely, although two infants, aged 6 and 9 months, were traveling internationally and thus should have been vaccinated according to vaccination recommendations of the Advisory Committee for Immunization Practices (2). One case occurred in a person who was born before 1957, and therefore was considered to have evidence of immunity because of birth year (2).
Although still low, the number of measles cases reported during 2008 was the highest since 1996. The increase was not the result of a greater number of imported cases, but was the result of greater viral transmission after importation into the United States. The import-linked cases occurred largely among school-aged children who were eligible for vaccination but whose parents chose not to have them vaccinated (3). One study reported an increase in the number of vaccine exemptions among U.S. children who attend school in states that allow philosophical exemptions (4). In 2008, 41% of measles cases occurred among school-aged children and adolescents (aged 5--19 years). Seventeen children, including five aged <15 months, were hospitalized.
Nine outbreaks occurred in seven states, all with viral or epidemiologic evidence of an imported source. These outbreaks accounted for 74% of all cases. In four outbreaks, 50% of cases occurred among persons unvaccinated because of personal beliefs. Two such outbreaks involved home-schooled populations (3). In one 12-case outbreak among children with personal belief exemptions, 70 children exposed to a measles case were placed on voluntary home quarantine because parents declined vaccination or because they were too young to be vaccinated (5). In another outbreak, the majority of infections were acquired in hospitals or emergency rooms. This outbreak lasted over 2 months and 6 generations of spread. This outbreak included a case in an unvaccinated health-care worker who was infected in a hospital (6).
Although the elimination of endemic measles in the United States has been achieved, and population immunity remains high (7), outbreaks can occur when measles is introduced into susceptible groups, often at substantial cost to control (8). Measles can be prevented by adhering to recommendations for vaccinations, including guidelines for travelers (2, 9).
Council of State and Territorial Epidemiologists. Revision of measles, rubella, and congenital rubella syndrome case classifications as part of elimination goals in the United States. Position statement 2006-ID-16. Available at http://www.cste.org/position%20statements/searchbyyear2006.asp.
Omer SB, Pan WKY, Halsey NA, et al. Nonmedical exemptions school immunization requirements: secular trends and association to state policies with pertussis incidence. JAMA 2006;296:1757--63.
Hutchins SS, Bellini W, Coronado V, et al. Population immunity to measles in the United States. J Infect Dis 2004:189(Suppl 1):S91--7.
Parker AA, Staggs W. Dayan G, et al. Implications of a 2005 measles outbreak in Indiana for sustained elimination of measles in the United States, N Engl J Med 2006;355:447--55.
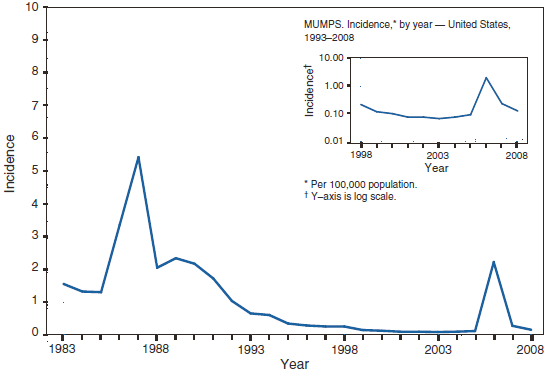
Since mumps vaccine licensure in 1967, the number of cases of mumps in the United States declined steadily until 2006, when the largest mumps outbreak in >20 years occurred, with >6,000 reported cases (1--4). Following the resurgence of mumps in 2006, reported cases declined towards pre-resurgence levels with 800 cases in 2007 and 454 cases in 2008 (5). In response to the 2006 outbreak, the Advisory Committee on Immunization Practices (ACIP) updated criteria for mumps immunity and mumps vaccination recommendations (5). In 2007, the Council of State and Territorial Epidemiologists revised the mumps case definition by extending the case definition to include cases with mumps symptoms other than parotitis, by adding mumps virus nucleic acid detection to the laboratory criteria, and by making several changes to the case classification system (6). The revised case definition has been in effect since January 1, 2008.
In 2008, after a review of scientific evidence, ACIP, the Healthcare Infection Control Practices Advisory Committee, and the American Academy of Pediatrics recommended reducing, from 9 to 5 days, the period of isolation for persons with mumps in both health-care and community settings. All three groups now recommend a 5-day period of isolation after onset of parotitis, both for isolation of persons with mumps in either community or health-care settings and for use of standard precautions and droplet precautions. Among the rationale cited for these recommendations is the substantial reduction in viral secretion 5 days after onset of parotitis and the likelihood that much transmission in community settings occurs from persons with asymptomatic infection and, among persons with symptomatic disease, before the onset of parotitis. Postexposure recommendations remain unchanged. Health-care personnel with no evidence of mumps immunity who are exposed to patients with mumps should be excluded from duty from the 12th day after first exposure through the 26th day after last exposure (7--8).
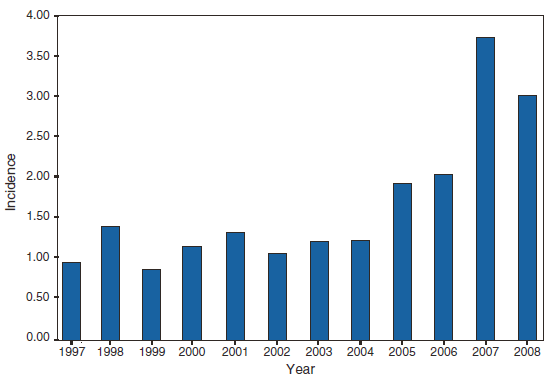
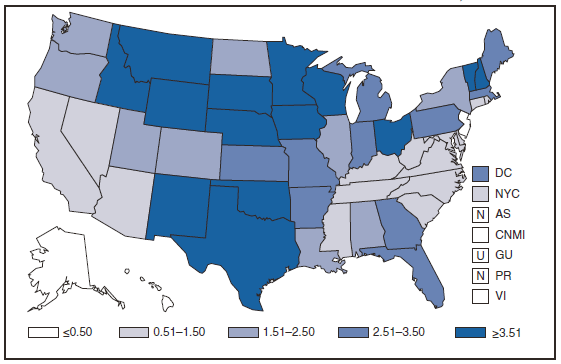
Although the incidence of reported pertussis has declined in the United States following the 2004 peak (8.9 per 100,000), overall incidence increased slightly during 2007 and 2008 (3.62 and 4.18 cases per 100,000, respectively). Infants aged <6 months, who are at greatest risk for severe disease and death, continued to have the highest reported rate of pertussis (79.41 per 100,000). However, adolescents (aged 10--19 years) and adults (aged >20 years) accounted for nearly half of reported cases in 2008, and the contribution of cases in persons aged 5--9 years appears to be increasing in comparison with previous years (20% of cases in 2008, 13% of cases in 2007, 10% in 2006). Adolescents and adults are critical age groups as they are thought to be a source of transmission of pertussis to young infants who are too young to be completely vaccinated. In 2005, a combined tetanus toxoid, reduced diphtheria toxoid, and acellular pertussis vaccine (Tdap) was recommended for use among adolescents and adults (1,2). Although Tdap coverage among adolescents aged 13--17 years has increased from 10.8% in 2006 to 40.8% in 2008, the direct impact of Tdap is still unknown (3,4). Continued monitoring of disease trends through national surveillance will be important to assess both the direct impact of Tdap among target vaccine age groups and the indirect effects of vaccination on infants.
Psittacosis is a respiratory infection caused by the bacterium Chlamydophila psittaci. Once referred to as "parrot fever", psittacosis occurs through exposure to the feces, respiratory secretions, plumage, or tissues of infected birds and can lead to severe respiratory compromise in a minority of cases. In 2008, the incidence of reported cases of psittacosis continued to be low. Because of the recent development of improved molecular diagnostics for the detection of C. psittaci (1), a revised position statement by the Council of State and Territorial Epidemiologists and case definition for psittacosis is anticipated. Additional information about psittacosis and case reporting tools can be found at http://www.nasphv.org/documentsCompendiaPsittacosis.html.
Mitchell SL, Wolff BJ, Thacker WL, et al. Genotyping of Chlamydophila psittaci by real time PCR and high resolution melt analysis. J Clin Microbiol 2008;47:175--81.
Q Fever
The case definition for Q fever was modified beginning in 2008 (1) to include a separate designation for acute and chronic infection and to restrict designation of cases diagnosedby use of indirect immunofluorescent antibody assays to those minimally exhibiting IgG antibody titers ≥1:128.Among cases reported in 2008, 88% were identified as acute infection, whereas 12% were the result of chronic Q fever infection. In 2008, cases remained distributed across the United States, in keeping with the consideration that Q fever is considered enzootic in ruminants (sheep, goats, and cattle) throughout the country.
During 2008, cases of Q fever reported decreased by 30% from those reported for 2007, the largest decrease since reporting of cases of Q fever was initiated in 2000. This decrease likely reflects the more stringent case classification criteria in effect during 2008 (1) compared with the previous year. Although few human cases are reported annually, Q fever is believed to be substantially underreported because of its nonspecific presentation and the failure of physicians to suspect infection and request appropriate diagnostic tests.
Council of State and Territorial Epidemiologists. Revision of the surveillance case definitions for Q fever. Position statement 07-ID-04. Atlanta, GA: Council of State and Territorial Epidemiologists; 2007. Available at http://www.cste.org/position%20statements/searchbyyear2007final.asp.
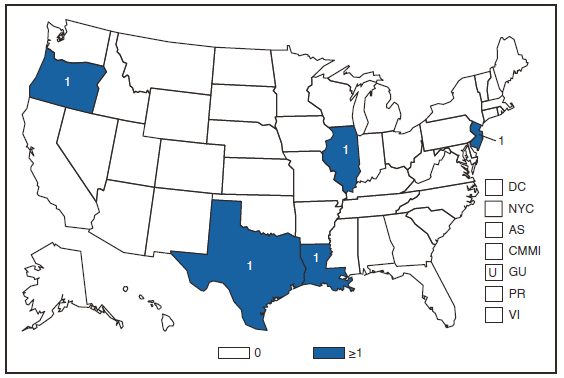
Rabies
During 2008, two cases of human rabies were reported in the United States: an imported case from Mexico and an indigenous case in a 55-year-old male from Missouri. Epidemiologic investigations of these cases implicated bat rabies virus variants in both cases. The case from Mexico marked the first imported case of rabies reported as a rabies virus variant not associated with dogs in the origin country (1). During 2008, the majority (93%) of 6,841 animal rabies cases in the United States were reported in wild animal species. Overall, a 3% decrease in rabies cases was reported in animals in 2008 compared with 2007. In the United States, five groups of animals are recognized as reservoirs for various rabies virus variants over defined geographic regions: raccoons (eastern United States), bats (various species, all U.S. states except Hawaii), skunks (north central United States, south central United States, and California), foxes (Alaska, Arizona, and Texas), and mongoose (Puerto Rico) (2). A skunk rabies virus variant associated with spillover and adaptation of a big brown bat rabies virus was reported in Flagstaff, Arizona after nearly 2 years with no cases after wildlife vaccination campaigns were implemented in the area.
Reported cases of rabies in domestic animals remain low (7% of reported rabid animals) in part because of high vaccination rates and the elimination of dog-to-dog transmission, which was last reported in 2004. One case of canine rabies imported in a dog from Iraq was reported during 2008 (3). This case illustrates the continued challenge for the United States to remain canine rabies free. Public health education programs should target travelers and health-care providers regarding rabies prevention measures and the potential risk of rabies exposure in countries where the disease is endemic in domestic animals. In the United States, cats remained the most commonly reported domestic animal with rabies during 2008 (62% of reported rabid domestic animals).
Vaccination programs to control rabies in wild carnivores are ongoing through the distribution of baits containing an oral rabies vaccine in the eastern United States and Texas. Oral rabies vaccination programs in the eastern United States are targeted at preventing the westward spread of the raccoon rabies virus variant whereas programs in Texas are being maintained as a barrier to prevent the reintroduction of canine rabies from Mexico and to eliminate gray fox rabies.
Velasco-Villa A, Messenger SL, Orciari LA, et al. New rabies virus variant in a Mexican immigrant. Emerg Infect Dis 2008;14:1906--8.
Blanton JD, Robertson K, Palmer D, Rupprecht CE. Rabies surveillance in the United States during 2008. J Am Vet Med Assoc 2009; 235:676--89.
The case definition for Rocky Mountain Spotted Fever (RMSF) was modified beginning in 2008 (1) to include more detailed classification criteria for serologic assays, including enzyme-linked immunosorbent assays and use of IgM antibody tests. During 2008, RMSF cases increased 15% over those reported in 2007. Cases reported in 2008 were distributed across the United States, reflecting the endemic status of RMSF and the widespread ranges of the primary tick vectors (primarily Dermacentor variabilis and Dermacentor andersoni) responsible for transmission. RMSF cases associated with transmission by Rhipicephalus sanguineus, first reported in 2004 (2), continued to be reported from Arizona during 2008.
The reporting years 2005--2008 reflect a trend toward stabilized numbers of reported RMSF cases. However, RMSF case reports have increased more than 300% during the past decade. This increase might be the result of several factors, including ecological changes influencing disease transmission, changes in diagnostic approaches that alter detection rates, or changes in surveillance and reporting. Changes in the case definition in 2004 and a further revision of the case definition beginning in 2008 (1) also might have altered how cases were classified.
Council of State and Territorial Epidemiologists. Revision of the surveillance case definitions for Rocky Mountain spotted fever. Position statement 07-ID-05. Atlanta, GA: Council of State and Territorial Epidemiologists; 2007. Available at http://www.cste.org/position%20statements/searchbyyear2007final.asp.
L Demma, Traeger M, Nicholson W, et al. Rocky Mountain spotted fever from an unexpected tick vector in Arizona. New Engl J Med 2005;353:587--94.
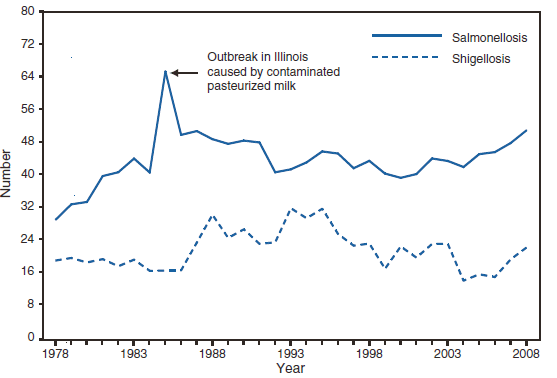
Salmonellosis
During 2008, as in previous years, the age group with the highest incidence of salmonellosis was children aged <5 years. Salmonella enterica serotype Typhimurium and S. enterica serotype Enteritidis have been the most frequently isolated serotypes since 1996 (1). The epidemiology of Salmonella has been changing during the past decade. Salmonella serotype Typhimurium has decreased in incidence, whereas the incidence of serotypes Newport, Mississippi, and Javiana have increased. Specific control programs might have led to the reduction of serotype Enteritidis infections, which have been associated with the consumption of internally contaminated eggs. Rates of antimicrobial resistance among several serotypes have been increasing; a substantial proportion of serotypes Typhimurium and Newport isolates are resistant to multiple drugs (2). The epidemiology of Salmonella infections is based on serotype characterization; therefore, in 2005, the Council of State and Territorial Epidemiologists adopted a position statement for serotype-specific reporting of laboratory-confirmed salmonellosis cases (3). Increasing evidence indicates that infections with certain serotypes of Salmonella are more likely to be invasive and lead to poor outcomes than infections with other serotypes. Such findings have implications for better understanding the public health importance and pathogencity of salmonellosis (4).
CDC. National Antimicrobial Resistance Monitoring System for Enteric Bacteria (NARMS): 2006 human isolates final report. Atlanta, Georgia: U.S. Department of Health and Human Services, CDC; 2009.
Council of State and Territorial Epidemiologists. Position statement 05-ID-09. Serotype specific national reporting for salmonellosis. Atlanta, GA: Council of State and Territorial Epidemiologists; 2005. Available at http://www.cste.org/PS/2005pdf/final2005/05-ID-09final.pdf.
Jones TF, Ingram LA, Cieslak PR, et al. Salmonellosis outcomes differ substantially by serotype. J Infect Dis 2008;198:109--14.
Shiga Toxin-Producing Escherichia coli (STEC)
Escherichia coli O157:H7 has been nationally notifiable since 1994 (1). National surveillance for all Shiga toxin-producing E. coli (STEC), under the name enterohemorrhagic E. coli (EHEC), began in 2001. In 2006, the nationally notifiable diseases case definition designation was changed from EHEC to STEC, and serotype-specific reporting was implemented (2). Diagnosis solely on the basis of detection of Shiga toxin does not protect public health sufficiently; characterizing STEC isolates by serogroup and, for E. coli O157, also by pulsed-field gel electrophoresis pattern is important to detect, investigate, and control outbreaks. Stool specimens from patients with community-acquired diarrhea should be submitted to clinical laboratories for routine testing, should be cultured for O157 STEC, and tested with an assay that detects Shiga toxins (3). This simultaneous approach has several advantages. First, it enables rapid detection of Shiga toxin-related illness, including that caused by non-O157 STEC, which are not readily identified in culture. Second, it permits rapid identification of O157 STEC, the serogroup most strongly associated with the development of hemolytic uremic syndrome (HUS); quickly identifying O157 STEC infections might facilitate measures to prevent HUS and speed the identification of outbreaks. Third, culturing enables isolation of STEC, which can then be characterized by serogroup and pulsed-field gel electrophoresis pattern to facilitate outbreak detection and investigation. All STEC isolates and enrichment broths from Shiga toxin-positive specimens that do not yield STEC O157 should be forwarded to state or local public health laboratories for further testing.
Healthy cattle, which harbor the organism as part of the bowel flora, are the main animal reservoir of STEC. Most reported outbreaks are caused by contaminated food or water. During 2004, a substantial decline in reported O157:H7 STEC cases led to an incidence measured in the Foodborne Diseases Active Surveillance System (FoodNet) that met the Healthy People 2010 goal of <1.0 cases/100,000 population; since then, the incidence has increased (4).
Council of State and Territorial Epidemiologists. Revision of the Enterohemorrhagic Escherichia coli (EHEC) condition name to Shiga toxin-producing Escherichia coli (STEC) and adoption of serotype specific national reporting for STEC. Position statement 05-ID-07. Atlanta, GA: Council of State and Territorial Epidemiologists; 2005. Available at http://www.cste.org/position%20statements/searchbyyear2005.asp.
During 1978--2003, shigellosis cases reported to CDC exceeded 17,000 in nearly every year. The approximately 14,000 cases of shigellosis reported to CDC in 2004 represented an all-time low. This number increased to approximately 16,000 in 2005, decreased slightly in 2006, increased to approximately 20,000 in 2007, and to approximately 22,000 in 2008. Shigella sonnei infections continue to account for >75% of shigellosis in the United States (1). Most cases occur among young children, and large day care-associated outbreaks are common and difficult to control (2). Some cases of shigellosis are acquired during international travel (3,4). In addition to spreading from one person to another, Shigellae can be transmitted through contaminated foods, sexual contact, and water used for drinking or recreational purposes (1). Resistance to ampicillin and trimethoprim-sulfamethoxazole among S. sonnei strains in the United States remains common (5).
Gupta A, Polyak CS, Bishop RD, Sobel J, Mintz ED. Laboratory confirmed shigellosis in the United States, 1989--2002: epidemiologic trends and patterns. Clin Infect Dis 2004;38:1372--7.
Arvelo W, Hinkle J, Nguyen TA, et al. Transmission risk factors and treatment of pediatric shigellosis during a large daycare center-associated outbreak of multidrug resistant Shigella sonnei. Pediatr Infect Dis J 2009;11:976--80
Ram PK, Crump JA, Gupta SK, Miller MA, Mintz, ED. Review article: part II. Analysis of data gaps pertaining to Shigella infections in low and medium human development index countries, 1984--2005. Epidemiol Infect 2008;136:577--603.
Gupta SK, Strockbine N, Omondi M, Hise K, Fair MA, Mintz ED. Short report: emergence of Shiga toxin 1 genes within Shigella dysenteriae Type 4 isolates from travelers returning from the island of Hispanola. Am J Trop Med Hyg 2007;76:1163--5.
CDC. National Antimicrobial Resistance Monitoring System for enteric bacteria (NARMS): Human isolates final report, 2006. Atlanta, GA: US Department of Health and Human Services, CDC; 2009. Available at http://www.cdc.gov/narms.
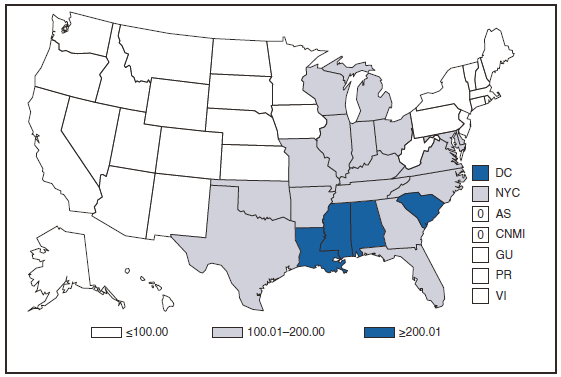
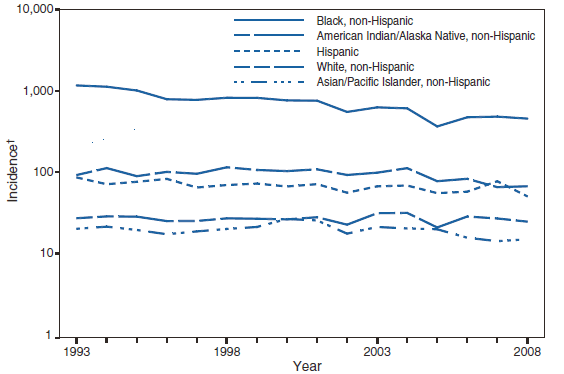
Syphilis, Primary and Secondary
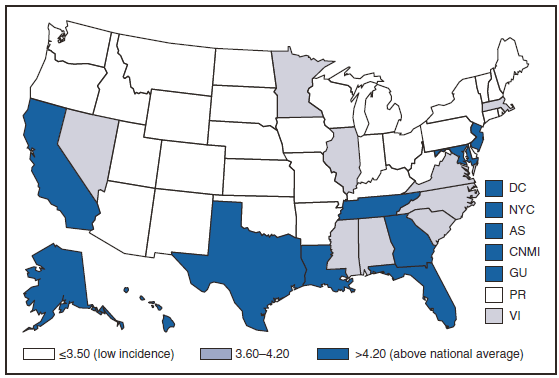
The rate of primary and secondary (P&S) syphilis in the United States declined 90% during 1990--2000. However, the rate of P&S syphilis has increased each year since 2001, mostly in men, but also in women for the past 4 years. In 2008, a total of 13,500 cases of P&S syphilis were reported to CDC. (1) This is the highest number of reported cases since 1995 and corresponds to a rate of 4.5 cases per 100,000 population, an 18% increase from 2007. Since 2001, the rate of P&S syphilis has increased 114%. On the basis of information from 44 states and Washington, D.C. in 2008, 63% of reported P&S syphilis cases in the United States occurred among men who have sex with men (MSM). Although the majority of U.S. syphilis cases have occurred among MSM, syphilis among heterosexuals is an emerging problem as reflected in a 88% increase in women since 2004 (1).
CDC. Sexually Transmitted Disease Surveillance, 2008. Atlanta, GA: U.S. Department of Health and Human Services; November 2009.
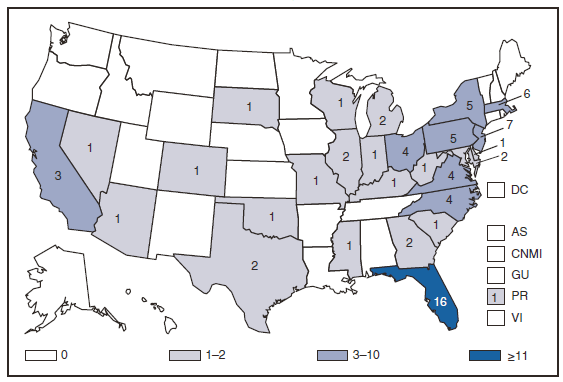
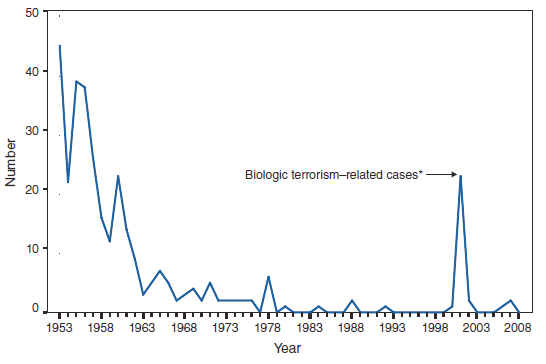
Trichinellosis
In November 2008, an outbreak of trichinellosis occurred in Humboldt County, California, among several families who participated in a cultural ceremony. At least 34 persons attended the event, at which they shared a meal of bear meat that was hunted by one of the family members. Case-patients recalled eating both raw and undercooked bear meat; 30 confirmed cases were reported to CDC.
This is the eighth outbreak and the largest attributed to bear meat reported to CDC in the past 10 years (1,2); it highlights the continued need for public health prevention messages aimed at consumers of wild game meat in general and for targeted prevention messages for certain cultural groups whose customs put them at risk for Trichinella infection in particular.
Proper cooking of meat dishes, especially dishes prepared with some types of game meats, will prevent trichinellosis. Meat products, including sausages or other prepared dishes, should be cooked to internal temperatures of at least 170° F or until juices run clear. Some species of Trichinella are resistant to freezing, so freezing might not be an effective prevention measure (3).
Hill DE, Gamble HR, Zarlenga DS, Coss C, Finnigan J. Trichinella native in a black bear from Plymouth, New Hampshire. Vet Parasitol 2005;132:143--6.
Typhoid Fever
Recommendations indicate that travelers to countries in which typhoid fever is endemic should be vaccinated with either of two effective vaccines available in the United States. Despite these recommendations, approximately 75% of all cases of typhoid fever reported in the United States from 1999 through 2006 occurred among persons who reported international travel during the preceding month and who had not been vaccinated (1). Persons visiting friends and relatives in South Asia appear to be at particular risk, even during short visits (1,2). Certain recent illnesses have been caused by ciprofloxacin-resistant isolates (1). Salmonella serotype Typhi strains with decreased susceptibility to ciprofloxacin are isolated with increasing frequency, and infected persons might require treatment with alternative antimicrobial agents (3). Although the number of S. Typhi infections in the United States has been decreasing slowly, the number of infections attributed to Salmonella serotype Paratyphi A, which causes an illness indistinguishable from that caused by S. Typhi, has been increasing. In a cross-sectional laboratory-based surveillance study conducted by CDC, 80% of patients with paratyphoid fever acquired their infections in South Asia, and 75% were infected with nalidixic acid-resistant strains, indicating decreased susceptibility to ciprofloxacin. A vaccine for paratyphoid fever is needed (4).
Lynch MF, Blanton EM, Bulens S, et al. Typhoid fever in the United States, 1999--2006. JAMA 2009;302:898--9
Steinberg EB, Bishop RB, Dempsey AF, et al. Typhoid fever in travelers: who should be targeted for prevention? Clin Infect Dis 2004;39:186--91.
Crump JA, Ram PK, Gupta SK, Miller MA, Mintz ED. Review article: part I. analysis of data gaps pertaining to Salmonella enterica serotype Typhi infections in low and medium human development index countries, 1984--2005. Epidemiol Infect 2008;136:436-48.
Gupta SK, Medalla F, Omondi MW, et al. Laboratory-based surveillance of paratyphoid fever in the United States: travel and antimicrobial resistance. Clin Infect Dis 2007;46:1656--63.
Varicella (Chickenpox) Deaths
Varicella-related deaths have declined dramatically since the prevaccine era; during 2003--2005 the national annual average of varicella-related deaths was 16 (1) compared with 100--150 deaths during 1990--1994 (2,3). In 1999, varicella-related deaths became reportable to CDC (4) and an average of five deaths (range: 0--9 deaths) has been reported annually to CDC since then (1). The two varicella-related deaths reported in 2008 highlight important aspects of continued progress towards varicella disease control and prevention.
Both varicella-related deaths occurred in adult females aged 41 and 72 years; both were born outside of the United States, had underlying chronic conditions that were not contraindications for vaccination, and had no history of varicella disease or vaccination. Assessing evidence of immunity to varicella is important in determining who should be vaccinated. One of the criteria for evidence of immunity is birth in the United States before 1980 (5). Both of the reported deaths that occurred in adults in 2008 were in persons born outside of the United States. Both women had been assessed as susceptible to varicella during previous health-care visits. Vaccination was recommended to both women at the time of assessment but one refused it and vaccine was not available for the second woman at a follow-up visit. These deaths highlight the importance of assessing immune status among foreign-born persons and emphasize the need for vaccination if they are determined to be susceptible.
Nguyen HQ, Jumaan AO, Seward JF. Decline in mortality due to varicella after implementation of varicella vaccination in the United States. N Engl J Med 2005;352:450--8.
Preblud SR. Age-specific risk of varicella complications. Pediatrics 1981;68:14--7.
Council of State and Territorial Epidemiologists. CSTE position statement 1998-ID-10: inclusion of varicella-related deaths in the National Public Health Surveillance System (NPHSS). Available at http://www.cste.org/ps/1998/1998-id-10.htm.
Vibriosis became a nationally notifiable disease in January 2007 (1). Cholera, which is caused by infection with toxigenic Vibrio cholerae O1 and O139, has been nationally notifiable for several years. Infections attributable to other Vibrio species (vibriosis), especially V. parahaemolyticus and V. vulnificus, are a substantial public health burden. Infections are either foodborne or associated with wounds exposed to waters containing Vibrio species. During 2008, the majority of cases occurred in persons aged 40--64 years. In addition to reporting through the National Notifiable Diseases Surveillance System, CDC requests that states collect information on the standard surveillance form for cholera and other Vibrio illness surveillance (available at http://www.cdc.gov/nationalsurveillance/cholera_vibrio_surveillance.html).
Council of State and Territorial Epidemiologists. National reporting for non-cholera Vibrio infections (vibriosis). Position statement 06-ID-05. Atlanta, GA: Council of State and Territorial Epidemiologists; 2006. Available at http://www.cste.org/position%20statements/searchbyyear2006.
PART 1
Summaries of Notifiable Diseases in the United States, 2008
Abbreviations and Symbols Used in Tables
U Data not available.
N Not reportable (i.e., report of disease is not required in that jurisdiction).
--- No reported cases.
Notes: Rates <0.01 after rounding are listed as 0.
Data in the MMWR Summary of Notifiable Diseases --- United States, 2008 might not match data in other CDC surveillance reports because of differences in the timing of reports, the source of the data, and the use of different case definitions.
TABLE 1. Reported cases of notifiable diseases,* by month --- United States, 2008
Disease
Jan
Feb
Mar
Apr
May
Jun
Jul
Aug
Sep
Oct
Nov
Dec
Total
AIDS†
1,557
1,675
4,757
1,999
1,723
6,378
1,782
1,728
6,332
1,891
1,800
7,580
39,202
Botulism, total
9
6
9
14
13
10
13
15
9
17
18
12
145
foodborne
---
---
---
2
4
1
---
2
---
4
3
1
17
infant
9
6
8
10
8
7
12
12
8
11
10
8
109
other (wound and unspecified)
---
---
1
2
1
2
1
1
1
2
5
3
19
Brucellosis
4
5
2
7
10
7
6
9
8
6
8
8
80
Chancroid§
1
6
4
3
2
1
3
1
---
1
1
2
25
Chlamydia trachomatis infections§
76,143
89,998
113,581
97,620
114,978
92,058
88,902
118,288
94,455
95,523
114,776
114,201
1,210,523
Cholera
---
---
---
---
---
---
1
2
1
---
---
1
5
Coccidioidomycosis
702
443
552
474
665
516
464
533
432
486
997
1,259
7,523
Cryptosporidiosis
269
260
394
385
418
411
657
2,015
1,532
1,166
778
828
9,113
Cyclosporiasis
10
9
6
2
8
23
27
22
6
6
6
14
139
Domestic arboviral diseases¶
California serogroup virus
neuroinvasive
---
1
---
1
1
6
11
18
14
3
---
---
55
nonneuroinvasive
---
---
---
---
1
1
2
2
1
---
---
---
7
Eastern equine encephalitis virus, neuroinvasive
---
---
---
---
---
1
---
1
1
1
---
---
4
Powassan virus, neuroinvasive
---
---
---
---
---
1
1
---
---
---
---
---
2
St. Louis encephalitis virus
neuroinvasive
---
---
1
---
1
2
3
1
---
---
---
---
8
nonneuroinvasive
---
---
---
---
---
---
1
2
1
1
---
---
5
West Nile virus
neuroinvasive
---
1
1
---
2
10
78
265
236
84
10
2
689
nonneuroinvasive
1
---
1
3
9
22
67
325
181
55
3
---
667
Ehrlichiosis/Anaplasmosis
Ehrlichia chaffeensis
5
8
17
8
62
126
180
185
85
73
71
137
957
Ehrlichia ewingii
---
---
---
---
---
1
3
3
1
1
---
---
9
Anaplasma phagocytophilum
2
3
25
12
59
125
169
154
87
91
133
149
1,009
Undetermined
---
---
1
1
6
6
35
30
9
10
13
21
132
Giardiasis
959
1,148
1,451
1,173
1,518
1,276
1,557
2,405
2,067
1,809
1,821
1,724
18,908
Gonorrhea§
23,231
25,311
31,347
26,579
31,286
25,720
26,435
33,882
26,847
26,345
29,468
30,291
336,742
Haemophilus influenzae, invasive disease
all ages, serotypes
260
267
324
222
284
232
191
198
132
167
240
369
2,886
age<5 yrs
serotype b
2
6
3
1
2
---
1
2
1
2
3
7
30
nonserotype b
29
22
27
18
31
15
15
15
11
13
18
30
244
unknown serotype
12
22
18
13
19
14
15
5
7
6
13
19
163
Hansen disease (Leprosy)
7
10
9
8
4
1
7
8
8
6
5
7
80
Hantavirus pulmonary syndrome
---
2
1
1
4
2
---
2
3
---
1
2
18
Hemolytic uremic syndrome, post-diarrheal
4
8
14
13
23
38
29
38
29
27
28
79
330
Hepatitis, viral, acute
A
186
218
237
222
295
167
233
243
215
183
162
224
2,585
B
245
308
345
296
397
249
321
378
312
299
337
546
4,033
C
45
69
58
57
102
69
88
85
49
66
83
106
877
Influenza-associated pediatric mortality**
---
23
35
8
12
8
1
1
---
1
1
---
90
Legionellosis
142
141
185
117
205
257
439
455
380
309
235
316
3,181
Listeriosis
61
34
48
48
47
53
58
93
70
82
70
95
759
Lyme disease, total
498
646
832
913
2,099
4,788
7,426
5,864
3,079
2,783
2,528
3,742
35,198
confirmed
420
524
672
701
1,717
4,169
6,463
4,958
2,481
2,217
2,004
2,595
28,921
probable
78
122
160
212
382
619
963
906
598
566
524
1,147
6,277
Malaria
68
72
35
71
110
111
137
174
145
107
94
131
1,255
Measles, total
1
5
24
39
21
36
5
2
1
---
1
5
140
indigenous
---
3
21
34
14
34
5
1
1
---
---
2
115
imported
1
2
3
5
7
2
---
1
---
---
1
3
25
Meningococcal disease
all serogroups
70
137
197
100
114
96
81
68
54
65
81
109
1,172
serogroup A,C,Y, & W-135
16
40
62
28
31
26
26
21
13
17
19
31
330
serogroup B
14
25
30
10
15
14
17
11
8
9
16
19
188
other serogroup
4
3
9
1
6
6
1
3
---
1
3
1
38
serogroup unknown
36
69
96
61
62
50
37
33
33
38
43
58
616
Mumps
38
76
63
37
33
22
28
29
23
25
25
55
454
Novel influenza A virus infections
---
---
---
---
---
---
---
---
---
---
1
1
2
Pertussis
557
723
620
576
659
692
877
1,318
1,122
1,046
1,683
3,405
13,278
Plague
1
---
---
---
---
---
---
---
---
1
---
1
3
Psittacosis
1
1
1
---
2
---
---
---
1
---
1
1
8
See footnotes on next page.
TABLE 1. (Continued) Reported cases of notifiable diseases,* by month --- United States, 2008
* No cases of anthrax; diphtheria; eastern equine encephalitis virus, non-neuroinvasive; poliomyelitis, paralytic; poliovirus infection, nonparalytic; Powassan virus, non-neuroinvasive; rubella; congenital syndrome; severe acute respiratory syndrome-associated coronavirus disease (SARS-CoV); smallpox; vancomycin-resistant Staphylococcus aureus (VRSA) infection; western equine encephalitis virus, neuroinvasive and non-neuroinvasive; and yellow fever were reported in 2008. Data on chronic hepatitis B and hepatitis C virus infection (past or present) are not included because they are undergoing data quality review. Data on human immunodeficiency virus (HIV) infections are not included because HIV infection reporting has been implemented on different dates and using different methods than for AIDS case reporting.
† Total number of AIDS cases reported to the Division of HIV/AIDS Prevention, National Center for HIV/AIDS, Viral Hepatitis, STD, and TB Prevention (NCHHSTP) through December 31, 2008.
§ Totals reported to the Division of STD Prevention, NCHHSTP, as of May 8, 2009.
¶ Totals reported to the Division of Vector-Borne Diseases, National Center for Emerging and Zoonotic Infectious Diseases, (ArboNET Surveillance), as of May 1, 2009.
** Totals reported to the Influenza Division, National Center for Immunization and Respiratory Diseases (NCIRD), as of December 31, 2008.
†† Includes the following categories: primary, secondary, latent (including early latent, late latent, and latent syphilis of unknown duration), neurosyphilis, late (including late syphilis with clinical manifestations other than neurosyphilis), and congenital syphilis.
§§ Totals reported to the Division of TB Elimination, NCHHSTP, as of May 15, 2009.
¶¶ Totals reported to the Division of Viral Diseases, NCIRD, as of June 30, 2009.
TABLE 2. Reported cases of notifiable diseases,* by geographic division and area --- United States, 2008
Total resident population (in thousands)
Botulism
Area
AIDS†
Total
Foodborne
Infant
Other§
Brucellosis
United States
301,621
39,202¶
145
17
109
19
80
New England
14,264
1,188
4
---
4
---
---
Connecticut
3,502
408
2
---
2
---
---
Maine
1,317
30
---
---
---
---
---
Massachusetts
6,450
622
1
---
1
---
---
New Hampshire
1,316
30
---
---
---
---
---
Rhode Island
1,058
88
1
---
1
---
---
Vermont
621
10
---
---
---
---
---
Mid. Atlantic
40,417
7,042
23
---
23
---
7
New Jersey
8,686
1,627
3
---
3
---
2
New York (Upstate)
11,023
1,522
1
---
1
---
1
New York City
8,275
2,649
1
---
1
---
2
Pennsylvania
12,433
1,244
18
---
18
---
2
E.N. Central
46,339
3,310
6
4
2
---
6
Illinois
12,853
1,360
1
---
1
---
1
Indiana
6,345
424
1
1
---
---
1
Michigan
10,072
651
---
---
---
---
1
Ohio
11,467
701
4
3
1
---
---
Wisconsin
5,602
174
---
---
---
---
3
W.N. Central
20,051
913
5
1
4
---
4
Iowa
2,988
71
1
---
1
---
2
Kansas
2,776
122
---
---
---
---
---
Minnesota
5,198
207
1
---
1
---
1
Missouri
5,878
417
2
---
2
---
---
Nebraska
1,775
73
1
1
---
---
1
North Dakota
640
12
---
---
---
---
---
South Dakota
796
11
---
---
---
---
---
S. Atlantic
57,860
13,411
13
1
12
---
14
Delaware
865
166
---
---
---
---
---
District of Columbia
588
767
---
---
---
---
1
Florida
18,251
5,064
1
---
1
---
10
Georgia
9,545
2,153
---
---
---
---
1
Maryland
5,618
2,389
5
---
5
---
---
North Carolina
9,061
1,384
1
---
1
---
1
South Carolina
4,408
723
1
---
1
---
1
Virginia
7,712
698
3
---
3
---
---
West Virginia
1,812
67
2
1
1
---
---
E.S. Central
17,945
1,640
---
---
---
---
1
Alabama
4,628
402
---
---
---
---
---
Kentucky
4,241
293
---
---
---
---
---
Mississippi
2,919
356
---
---
---
---
---
Tennessee
6,157
589
---
---
---
---
1
W.S. Central
34,649
4,001
8
---
8
---
10
Arkansas
2,835
100
---
---
---
---
---
Louisiana
4,293
903
---
---
---
---
1
Oklahoma
3,617
137
---
---
---
---
---
Texas
23,904
2,861
8
---
8
N
9
Mountain
21,361
1,486
19
1
17
1
9
Arizona
6,339
570
4
1
2
1
3
Colorado
4,862
343
3
---
3
---
2
Idaho
1,499
31
1
---
1
---
---
Montana
958
48
3
---
3
---
---
Nevada
2,565
307
---
---
---
N
1
New Mexico
1,970
109
2
---
2
---
1
Utah
2,645
65
5
---
5
---
1
Wyoming
523
13
1
---
1
---
1
Pacific
48,735
5,539
67
10
39
18
29
Alaska
684
27
7
7
---
---
---
California
36,553
4,818
55
3
36
16
23
Hawaii
1,283
97
---
---
---
---
4
Oregon
3,747
207
2
---
2
---
1
Washington
6,468
390
3
---
1
2
1
American Samoa
64
---
---
---
---
---
---
C.N.M.I.
59
1
---
---
---
---
---
Guam
174
7
U
U
U
U
U
Puerto Rico
3,942
704
---
---
---
---
---
U.S. Virgin Islands
110
12
---
---
---
---
---
N: Not reportable. U: Unavailable. ---: No reported cases. C.N.M.I.: Commonwealth of Northern Mariana Islands.
* No cases of anthrax; diphtheria; eastern equine encephalitis virus disease, non-neuroinvasive; poliomyelitis, paralytic; poliovirus infection, nonparalytic; Powassan virus disease, non-neuroinvasive; rubella, congenital syndrome; severe acute respiratory syndrome-associated coronavirus disease (SARS-CoV); smallpox; vancomycin-resistant Staphylococcus aureus (VRSA) infection; western equine encephalitis virus disease, neuroinvasive and non-neuroinvasive; and yellow fever were reported in 2008. Data on chronic hepatitis B and hepatitis C virus infection (past or present) are not included because they are undergoing data quality review. Data on human immunodeficiency virus (HIV) infections are not included because HIV infection reporting has been implemented on different dates and using different methods than for AIDS case reporting.
† Total number of acquired immunodeficiency syndrome (AIDS) cases reported to the Division of HIV/AIDS Prevention, National Center for HIV/AIDS, Viral Hepatitis, STD, and TB Prevention (NCHHSTP), through December 31, 2008.
§ Includes cases reported as wound and unspecified botulism.
¶ Includes 672 cases of AIDS in persons with unknown state or area of residence that were reported in 2008.
TABLE 2. (Continued) Reported cases of notifiable diseases,* by geographic division and area --- United States, 2008
Area
Chancroid**
Chlamydia**
Cholera
Coccidioidomycosis
Cryptosporidiosis
Cyclosporiasis
United States
25
1,210,523
5
7,523
9,113
139
New England
4
39,246
---
1
393
10
Connecticut
---
12,519
---
N
41
4
Maine
---
2,608
---
N
46
N
Massachusetts
4
17,503
---
N
172
5
New Hampshire
---
2,109
---
1
60
1
Rhode Island
---
3,317
---
---
10
---
Vermont
---
1,190
---
N
64
N
Mid. Atlantic
2
152,997
1
---
742
33
New Jersey
---
22,405
1
N
40
9
New York (Upstate)
2
31,881
---
N
269
6
New York City
---
56,478
---
N
107
18
Pennsylvania
---
42,233
---
N
326
N
E.N. Central
1
194,359
1
44
2,163
9
Illinois
---
59,169
1
N
205
4
Indiana
---
22,154
---
N
203
2
Michigan
---
44,923
---
31
280
1
Ohio
1
47,117
---
13
689
1
Wisconsin
---
20,996
---
N
786
1
W.N. Central
---
68,198
---
3
1,002
4
Iowa
---
9,372
---
N
284
---
Kansas
---
9,208
---
N
84
---
Minnesota
---
14,351
---
---
236
3
Missouri
---
24,817
---
3
181
---
Nebraska
---
5,573
---
N
113
N
North Dakota
---
1,921
---
N
16
N
South Dakota
---
2,956
---
N
88
1
S. Atlantic
5
247,480
---
5
1,071
70
Delaware
---
3,868
---
2
12
---
District of Columbia
---
6,924
---
---
15
3
Florida
---
71,017
---
N
486
58
Georgia
---
42,629
---
N
263
2
Maryland
---
24,669
---
3
54
3
North Carolina
4
37,516
---
N
78
1
South Carolina
1
26,323
---
N
57
1
Virginia
---
31,218
---
N
81
2
West Virginia
---
3,316
---
N
25
---
E.S. Central
---
86,214
---
---
174
3
Alabama
---
24,760
---
N
74
N
Kentucky
---
12,163
---
N
36
N
Mississippi
---
21,253
---
N
17
N
Tennessee
---
28,038
---
N
47
3
W.S. Central
8
152,468
2
3
2,545
6
Arkansas
---
14,136
---
N
95
---
Louisiana
---
22,659
1
3
67
---
Oklahoma
---
14,803
---
N
143
---
Texas
8
100,870
1
N
2,240
6
Mountain
2
77,774
---
4,870
580
3
Arizona
---
24,769
---
4,768
89
---
Colorado
2
19,180
---
N
112
1
Idaho
---
4,194
---
N
72
N
Montana
---
3,101
---
N
44
N
Nevada
---
9,670
---
52
17
N
New Mexico
---
9,262
---
35
175
2
Utah
---
6,021
---
12
48
---
Wyoming
---
1,577
---
3
23
---
Pacific
3
191,787
1
2,597
443
1
Alaska
---
4,861
---
N
3
---
California
2
148,798
---
2,597
275
---
Hawaii
---
5,982
---
N
2
---
Oregon
---
10,744
1
N
64
---
Washington
1
21,402
---
N
99
1
American Samoa
---
---
---
N
N
N
C.N.M.I.
---
---
---
---
---
---
Guam
---
687
U
U
U
U
Puerto Rico
---
6,874
---
N
N
N
U.S. Virgin Islands
---
587
---
---
---
---
N: Not reportable. U: Unavailable. ---: No reported cases. C.N.M.I.: Commonwealth of Northern Mariana Islands.
** Totals reported to the Division of STD Prevention, NCHHSTP, as of May 8, 2009.
TABLE 2. (Continued) Reported cases of notifiable diseases,* by geographic division and area --- United States, 2008
Domestic arboviral diseases††
California serogroup virus
Eastern equine encephalitis virus
Powassan virus
St. Louis encephalitis virus
West Nile virus
Area
Neuro- invasive
Nonneuro- invasive
Neuro- invasive
Neuro- invasive
Neuro- invasive
Nonneuro- invasive
Neuro- invasive
Nonneuro- invasive
United States
55
7
4
2
8
5
689
667
New England
---
---
1
---
---
---
7
3
Connecticut
---
---
---
---
---
---
5
3
Maine
---
---
---
---
---
---
---
---
Massachusetts
---
---
1
---
---
---
1
---
New Hampshire
---
---
---
---
---
---
---
---
Rhode Island
---
---
---
---
---
---
1
---
Vermont
---
---
---
---
---
---
---
---
Mid. Atlantic
5
1
---
1
---
1
50
20
New Jersey
---
---
---
---
---
---
6
4
New York (Upstate)
5
1
---
1
---
---
24
7
New York City
---
---
---
---
---
---
8
7
Pennsylvania
---
---
---
---
---
1
12
2
E.N. Central
13
2
---
---
---
---
44
20
Illinois
---
---
---
---
---
---
12
8
Indiana
---
---
---
---
---
---
3
1
Michigan
---
---
---
---
---
---
11
6
Ohio
9
---
---
---
---
---
14
1
Wisconsin
4
2
---
---
---
---
4
4
W.N. Central
1
---
---
1
---
1
51
134
Iowa
---
---
---
---
---
---
3
3
Kansas
---
---
---
---
---
---
14
17
Minnesota
1
---
---
1
---
---
2
8
Missouri
---
---
---
---
---
1
12
3
Nebraska
---
---
---
---
---
---
7
40
North Dakota
---
---
---
---
---
---
2
35
South Dakota
---
---
---
---
---
---
11
28
S. Atlantic
27
1
2
---
3
---
20
20
Delaware
---
---
---
---
---
---
---
1
District of Columbia
---
---
---
---
---
---
4
4
Florida
---
1
1
---
---
---
3
---
Georgia
2
---
---
---
---
---
4
4
Maryland
---
---
---
---
---
---
6
8
North Carolina
9
---
1
---
3
---
2
1
South Carolina
---
---
---
---
---
---
---
1
Virginia
2
---
---
---
---
---
---
1
West Virginia
14
---
---
---
---
---
1
---
E.S. Central
8
3
1
---
---
---
48
57
Alabama
---
---
1
---
---
---
11
7
Kentucky
1
---
---
---
---
---
3
---
Mississippi
1
3
---
---
---
---
22
43
Tennessee
6
---
---
---
---
---
12
7
W.S. Central
1
---
---
---
5
2
69
62
Arkansas
---
---
---
---
4
---
7
2
Louisiana
1
---
---
---
1
2
18
31
Oklahoma
---
---
---
---
---
---
4
5
Texas
---
---
---
---
---
---
40
24
Mountain
---
---
---
---
---
---
103
184
Arizona
---
---
---
---
---
---
62
52
Colorado
---
---
---
---
---
---
17
54
Idaho
---
---
---
---
---
---
4
35
Montana
---
---
---
---
---
---
---
5
Nevada
---
---
---
---
---
---
9
7
New Mexico
---
---
---
---
---
---
5
3
Utah
---
---
---
---
---
---
6
20
Wyoming
---
---
---
---
---
---
---
8
Pacific
---
---
---
---
---
1
297
167
Alaska
---
---
---
---
---
---
---
---
California
---
---
---
---
---
---
292
153
Hawaii
---
---
---
---
---
---
---
---
Oregon
---
---
---
---
---
1
3
13
Washington
---
---
---
---
---
---
2
1
American Samoa
---
---
---
---
---
---
---
---
C.N.M.I.
---
---
---
---
---
---
---
---
Guam
---
---
---
---
---
---
---
---
Puerto Rico
---
---
---
---
---
---
---
---
U.S. Virgin Islands
---
---
---
---
---
---
---
---
N: Not reportable. U: Unavailable. ---: No reported cases. C.N.M.I.: Commonwealth of Northern Mariana Islands.
†† Totals reported to the Division of Vector-Borne Diseases, National Center for Emerging and Zoonotic Infectious Diseases (NCEZID) (ArboNET Surveillance), as of May 1, 2009.
TABLE 2. (Continued) Reported cases of notifiable diseases,* by geographic division and area --- United States, 2008
Area
Ehrlichiosis/Anaplasmosis
Giardiasis
Gonorrhea**
Ehrlichia chaffeensis
Ehrlichia ewingii
Anaplasma phagocytophilum
Undetermined
United States
957
9
1,009
132
18,908
336,742
New England
42
---
197
1
1,660
5,470
Connecticut
2
---
45
---
334
2,801
Maine
1
---
17
---
188
96
Massachusetts
21
---
85
---
678
2,129
New Hampshire
7
---
14
---
160
100
Rhode Island
11
---
36
1
90
307
Vermont
---
---
---
---
210
37
Mid. Atlantic
123
1
303
10
3,532
33,477
New Jersey
54
---
45
3
520
5,298
New York (Upstate)
61
---
239
3
1,282
6,615
New York City
5
1
17
---
851
10,493
Pennsylvania
3
---
2
4
879
11,071
E.N. Central
58
---
205
31
2,743
69,397
Illinois
28
---
3
3
705
20,674
Indiana
4
---
---
---
N
8,769
Michigan
3
---
---
---
611
17,064
Ohio
11
---
1
---
904
16,803
Wisconsin
12
---
201
28
523
6,087
W.N. Central
212
6
281
69
2,106
17,003
Iowa
N
N
N
N
326
1,700
Kansas
---
---
---
---
162
2,274
Minnesota
14
1
278
43
769
3,037
Missouri
195
5
1
26
468
8,014
Nebraska
3
N
1
N
209
1,460
North Dakota
N
N
N
N
36
143
South Dakota
---
---
1
---
136
375
S. Atlantic
207
1
15
5
3,119
86,462
Delaware
19
1
4
---
42
1,045
District of Columbia
N
N
N
N
72
2,656
Florida
10
---
2
---
1,391
23,326
Georgia
19
---
1
---
691
16,272
Maryland
61
---
4
1
284
6,666
North Carolina
34
---
2
4
N
15,972
South Carolina
1
---
---
---
136
9,442
Virginia
63
---
2
---
432
10,337
West Virginia
---
---
---
---
71
746
E.S. Central
86
---
---
14
506
30,562
Alabama
9
---
N
N
281
9,740
Kentucky
13
---
---
---
N
4,548
Mississippi
---
---
---
---
N
7,494
Tennessee
64
---
---
14
225
8,780
W.S. Central
229
1
8
---
473
51,353
Arkansas
87
---
N
N
143
4,514
Louisiana
---
1
---
---
150
9,455
Oklahoma
114
---
7
---
180
5,185
Texas
28
---
1
---
N
32,199
Mountain
---
---
---
2
1,661
11,691
Arizona
---
---
---
2
142
3,449
Colorado
N
N
N
N
564
3,757
Idaho
N
N
N
N
211
187
Montana
N
N
N
N
93
122
Nevada
N
N
N
N
121
2,172
New Mexico
N
N
N
N
107
1,403
Utah
---
---
---
---
374
477
Wyoming
---
---
---
---
49
124
Pacific
---
---
---
---
3,108
31,327
Alaska
N
N
N
N
108
578
California
---
---
N
N
2,017
25,787
Hawaii
N
N
N
N
42
610
Oregon
---
---
---
---
455
1,225
Washington
N
N
N
N
486
3,127
American Samoa
N
N
N
N
---
---
C.N.M.I.
---
---
---
---
---
---
Guam
U
U
U
U
U
109
Puerto Rico
N
N
N
N
227
273
U.S. Virgin Islands
N
N
N
N
---
120
N: Not reportable. U: Unavailable. ---: No reported cases. C.N.M.I.: Commonwealth of Northern Mariana Islands.
TABLE 2. (Continued) Reported cases of notifiable diseases,* by geographic division and area --- United States, 2008
Haemophilus influenzae, invasive disease
Hansen disease (leprosy)
Hantavirus pulmonary syndrome
Hemolytic uremic syndrome, postdiarrheal
All ages, serotypes
Age <5 yrs
Area
Serotype b
Nonserotype b
Unknown serotype
United States
2,886
30
244
163
80
18
330
New England
196
1
10
2
8
---
15
Connecticut
54
---
4
---
3
N
5
Maine
21
---
2
---
N
---
1
Massachusetts
83
1
3
1
5
---
6
New Hampshire
12
---
---
1
---
---
1
Rhode Island
17
---
1
---
---
---
---
Vermont
9
---
---
---
N
---
2
Mid. Atlantic
554
2
16
38
9
---
15
New Jersey
98
---
---
10
1
---
3
New York (Upstate)
171
2
15
2
N
---
7
New York City
90
---
---
9
8
---
5
Pennsylvania
195
---
1
17
---
---
N
E.N. Central
483
8
35
30
3
---
28
Illinois
157
---
---
16
1
---
3
Indiana
93
2
6
5
---
---
1
Michigan
31
2
6
---
---
---
6
Ohio
135
2
11
9
2
---
7
Wisconsin
67
2
12
---
---
---
11
W.N. Central
211
5
5
21
4
2
48
Iowa
2
---
---
---
1
1
16
Kansas
20
---
---
2
---
---
3
Minnesota
71
5
5
2
1
---
11
Missouri
72
---
---
15
1
---
13
Nebraska
30
---
---
2
---
---
1
North Dakota
16
---
---
---
N
1
1
South Dakota
---
---
---
---
1
---
3
S. Atlantic
714
4
77
22
11
---
36
Delaware
8
---
---
2
---
---
---
District of Columbia
8
---
---
---
---
---
---
Florida
191
1
22
2
10
---
5
Georgia
149
---
14
10
N
---
19
Maryland
97
1
12
---
---
---
1
North Carolina
81
1
11
2
---
---
7
South Carolina
62
---
8
3
1
---
2
Virginia
92
1
8
3
---
---
2
West Virginia
26
---
2
---
N
---
---
E.S. Central
151
2
7
11
---
---
25
Alabama
25
1
2
---
---
N
5
Kentucky
10
---
---
1
---
---
N
Mississippi
14
1
1
---
---
---
---
Tennessee
102
---
4
10
---
---
20
W.S. Central
132
2
11
4
3
2
69
Arkansas
15
---
3
1
---
---
5
Louisiana
13
---
1
3
2
2
1
Oklahoma
93
---
7
---
1
---
51
Texas
11
2
---
---
---
---
12
Mountain
297
5
49
16
4
12
32
Arizona
107
3
23
3
---
1
6
Colorado
60
---
6
2
1
6
6
Idaho
12
---
3
3
---
---
4
Montana
5
---
1
2
---
2
---
Nevada
16
---
1
---
---
---
N
New Mexico
50
1
3
6
1
2
6
Utah
43
1
12
---
2
1
10
Wyoming
4
---
---
---
---
---
---
Pacific
148
1
34
19
38
2
62
Alaska
21
---
---
8
---
N
N
California
46
1
32
6
20
---
46
Hawaii
22
---
---
1
18
---
1
Oregon
57
---
---
4
N
---
13
Washington
2
---
2
---
N
2
2
American Samoa
---
---
---
---
1
N
N
C.N.M.I.
---
---
---
---
---
---
---
Guam
U
U
U
U
U
U
U
Puerto Rico
1
---
---
---
---
N
N
U.S. Virgin Islands
N
---
---
---
---
---
---
N: Not reportable. U: Unavailable. ---: No reported cases. C.N.M.I.: Commonwealth of Northern Mariana Islands.
TABLE 2. (Continued) Reported cases of notifiable diseases,* by geographic division and area --- United States, 2008
Influenza- associated pediatric mortality§§
Legionellosis
Listeriosis
Lyme disease¶¶
Malaria
Hepatitis, viral, acute
Total
Confirmed
Probable
Area
A
B
C
United States
2,585
4,033
877
90
3,181
759
35,198
28,921
6,277
1,255
New England
128
81
37
9
231
63
11,601
9,205
2,396
61
Connecticut
26
30
19
2
47
16
3,896
2,738
1,158
14
Maine
18
15
3
1
11
5
908
780
128
1
Massachusetts
58
21
13
4
91
30
4,582
3,960
622
33
New Hampshire
12
8
N
1
30
6
1,601
1,211
390
5
Rhode Island
12
4
1
---
47
5
210
186
24
3
Vermont
2
3
1
1
5
1
404
330
74
5
Mid. Atlantic
333
448
131
13
1,061
168
15,097
12,773
2,324
337
New Jersey
86
118
61
1
150
34
3,485
3,214
271
65
New York (Upstate)
66
73
43
3
360
48
6,986
5,203
1,783
42
New York City
113
100
---
5
143
30
808
538
270
188
Pennsylvania
68
157
27
4
408
56
3,818
3,818
---
42
E.N. Central
335
536
195
12
667
104
2,321
1,759
562
152
Illinois
112
184
10
6
121
28
108
108
---
77
Indiana
20
67
13
1
60
10
42
42
---
5
Michigan
119
149
129
1
179
20
92
76
16
18
Ohio
51
118
40
1
268
29
45
40
5
31
Wisconsin
33
18
3
3
39
17
2,034
1,493
541
21
W.N. Central
255
107
27
5
145
31
1,438
1,172
266
72
Iowa
109
24
---
2
21
1
109
85
24
12
Kansas
15
9
1
---
2
6
16
16
---
9
Minnesota
49
25
22
3
25
8
1,282
1,046
236
29
Missouri
35
38
2
---
70
11
6
6
---
14
Nebraska
41
9
2
---
21
4
12
8
4
8
North Dakota
2
2
---
---
3
---
10
8
2
---
South Dakota
4
---
---
---
3
1
3
3
---
---
S. Atlantic
393
981
150
13
508
147
4,331
3,732
599
303
Delaware
7
U
U
---
13
2
772
772
---
3
District of Columbia
U
U
U
---
16
---
74
71
3
7
Florida
146
344
32
4
148
50
88
72
16
65
Georgia
57
187
16
4
43
26
35
35
---
57
Maryland
44
85
22
1
143
17
2,218
1,746
472
80
North Carolina
63
81
46
1
37
25
47
16
31
31
South Carolina
19
71
4
---
12
7
29
14
15
9
Virginia
51
130
8
3
66
17
933
886
47
49
West Virginia
6
83
22
---
30
3
135
120
15
2
E.S. Central
81
409
109
7
119
29
46
19
27
27
Alabama
12
109
13
---
18
4
9
6
3
5
Kentucky
30
101
68
1
58
7
5
5
---
6
Mississippi
7
50
---
4
1
4
1
1
---
1
Tennessee
32
149
28
2
42
14
31
7
24
15
W.S. Central
294
852
89
12
117
60
158
109
49
97
Arkansas
10
67
1
1
14
5
---
---
---
1
Louisiana
12
94
9
---
11
11
3
3
---
4
Oklahoma
13
129
20
2
11
7
2
1
1
5
Texas
259
562
59
9
81
37
153
105
48
87
Mountain
219
202
62
9
100
28
65
32
33
36
Arizona
118
80
---
2
26
8
8
2
6
15
Colorado
36
33
14
2
14
8
3
2
1
5
Idaho
17
12
3
---
3
1
9
5
4
3
Montana
1
2
6
---
4
1
17
6
11
---
Nevada
13
43
22
2
13
1
12
9
3
5
New Mexico
18
12
5
1
11
5
8
4
4
3
Utah
13
14
12
2
29
2
5
3
2
5
Wyoming
3
6
---
---
---
2
3
1
2
---
Pacific
547
417
77
10
233
129
141
120
21
170
Alaska
5
10
---
1
3
3
6
6
---
6
California
446
303
29
6
185
88
74
74
---
125
Hawaii
20
7
---
---
8
3
N
---
---
3
Oregon
25
41
23
1
18
6
38
18
20
4
Washington
51
56
25
2
19
29
23
22
1
32
American Samoa
---
---
---
---
N
N
N
---
---
---
C.N.M.I.
---
---
---
---
---
---
---
---
---
---
Guam
U
U
U
---
U
U
U
U
U
U
Puerto Rico
27
50
---
---
---
---
N
---
---
2
U.S. Virgin Islands
---
---
---
---
---
---
N
---
---
---
N: Not reportable. U: Unavailable. ---: No reported cases. C.N.M.I.: Commonwealth of Northern Mariana Islands.
§§ Totals reported to the Division of Influenza, National Center for Immunization and Respiratory Diseases (NCIRD), as of December 31, 2008.
¶¶ National Surveillance Case Definition revised in 2008; probable cases not previously reported.
TABLE 2. (Continued) Reported cases of notifiable diseases,* by geographic division and area --- United States, 2008
Measles
Meningococcal disease
Area
All serogroups
Serogroup A, C, Y, and W-135
Serogroup B
Other serogroup
Serogroup unknown
Total
Indigenous
Imported***
United States
140
115
25
1,172
330
188
38
616
New England
2
1
1
38
15
20
---
3
Connecticut
---
---
---
1
1
---
---
---
Maine
---
---
---
6
3
3
---
---
Massachusetts
2
1
1
24
8
14
---
2
New Hampshire
---
---
---
5
1
3
---
1
Rhode Island
---
---
---
2
2
---
---
---
Vermont
---
---
---
---
---
---
---
---
Mid. Atlantic
32
23
9
128
27
12
---
89
New Jersey
1
---
1
17
---
---
---
17
New York (Upstate)
2
---
2
33
21
11
---
1
New York City
28
22
6
28
---
---
---
28
Pennsylvania
1
1
---
50
6
1
---
43
E.N. Central
42
40
2
211
64
32
3
112
Illinois
32
32
---
88
---
---
---
88
Indiana
---
---
---
27
18
8
---
1
Michigan
4
4
---
35
15
4
1
15
Ohio
---
---
---
40
23
11
1
5
Wisconsin
6
4
2
21
8
9
1
3
W.N. Central
1
1
---
105
39
23
2
41
Iowa
---
---
---
19
12
6
---
1
Kansas
---
---
---
8
1
---
---
7
Minnesota
---
---
---
30
13
13
1
3
Missouri
1
1
---
26
8
---
---
18
Nebraska
---
---
---
13
4
3
1
5
North Dakota
---
---
---
6
---
---
---
6
South Dakota
---
---
---
3
1
1
---
1
S. Atlantic
4
1
3
157
64
43
10
40
Delaware
---
---
---
2
---
---
---
2
District of Columbia
1
1
---
---
---
---
---
---
Florida
1
---
1
51
24
16
2
9
Georgia
1
---
1
18
6
10
---
2
Maryland
---
---
---
19
8
3
3
5
North Carolina
---
---
---
16
6
2
2
6
South Carolina
---
---
---
22
6
10
3
3
Virginia
1
---
1
24
9
2
---
13
West Virginia
---
---
---
5
5
---
---
---
E.S. Central
---
---
---
55
11
7
10
27
Alabama
---
---
---
10
2
2
4
2
Kentucky
---
---
---
10
---
---
---
10
Mississippi
---
---
---
12
7
1
4
---
Tennessee
---
---
---
23
2
4
2
15
W.S. Central
3
2
1
131
58
28
9
36
Arkansas
2
2
---
16
6
2
1
7
Louisiana
1
---
1
26
9
4
1
12
Oklahoma
---
---
---
19
9
4
6
---
Texas
---
---
---
70
34
18
1
17
Mountain
15
14
1
60
36
10
3
11
Arizona
14
13
1
9
6
2
---
1
Colorado
---
---
---
16
12
4
---
---
Idaho
---
---
---
6
1
1
---
4
Montana
---
---
---
4
1
---
---
3
Nevada
---
---
---
7
3
1
1
2
New Mexico
1
1
---
8
7
---
1
---
Utah
---
---
---
8
6
1
1
---
Wyoming
---
---
---
2
---
1
---
1
Pacific
41
33
8
287
16
13
1
257
Alaska
---
---
---
8
---
---
---
8
California
17
13
4
204
---
---
---
204
Hawaii
4
1
3
5
---
2
---
3
Oregon
1
---
1
39
---
---
---
39
Washington
19
19
---
31
16
11
1
3
American Samoa
---
---
---
---
---
---
---
---
C.N.M.I.
---
---
---
---
---
---
---
---
Guam
U
U
U
U
U
U
U
U
Puerto Rico
---
---
---
3
---
---
---
3
U.S. Virgin Islands
---
---
---
---
---
---
---
---
N: Not reportable. U: Unavailable. ---: No reported cases. C.N.M.I.: Commonwealth of Northern Mariana Islands.
*** Imported cases include only those directly related to importation from other countries.
TABLE 2. (Continued) Reported cases of notifiable diseases,* by geographic division and area --- United States, 2008
Novel influenza A virus infections
Q Fever
Rabies
Area
Mumps
Pertussis
Plague
Psittacosis
Total
Acute
Chronic
Animal
Human
United States
454
2
13,278
3
8
120
106
14
4,196
2
New England
18
---
1,052
1
2
---
---
---
433
---
Connecticut
---
---
55
1
N
---
---
---
202
---
Maine
5
---
49
---
---
---
---
---
64
---
Massachusetts
7
---
800
---
1
---
---
---
---
---
New Hampshire
5
---
49
---
---
---
N
N
58
---
Rhode Island
---
---
87
---
1
---
---
---
34
---
Vermont
1
---
12
---
---
---
N
N
75
---
Mid. Atlantic
71
---
1,311
---
1
17
15
2
944
---
New Jersey
13
---
246
---
1
2
2
---
---
---
New York (Upstate)
19
---
456
---
---
9
7
2
500
---
New York City
18
---
114
---
---
6
6
---
19
---
Pennsylvania
21
---
495
---
---
---
---
---
425
---
E.N. Central
151
---
2,252
---
---
7
6
1
256
---
Illinois
91
---
628
---
---
---
---
---
104
---
Indiana
2
---
270
---
---
1
---
1
10
---
Michigan
22
---
317
---
---
2
2
---
78
---
Ohio
23
---
845
---
---
1
1
---
64
---
Wisconsin
13
---
192
---
---
3
3
---
N
---
W.N. Central
50
1
2,327
---
---
15
15
---
323
1
Iowa
24
---
257
---
---
---
N
N
29
---
Kansas
2
---
106
---
---
2
2
---
68
---
Minnesota
9
---
1,034
---
---
5
5
---
70
---
Missouri
8
---
561
---
---
5
5
---
64
1
Nebraska
4
---
277
---
---
2
2
---
34
---
North Dakota
2
---
25
---
---
---
---
---
34
---
South Dakota
1
1
67
---
---
1
1
---
24
---
S. Atlantic
49
---
1,068
---
3
9
7
2
1,650
---
Delaware
1
---
18
---
---
---
---
---
---
---
District of Columbia
2
---
7
---
---
1
1
---
---
---
Florida
16
---
314
---
2
1
1
---
138
---
Georgia
3
---
115
---
---
2
2
---
386
---
Maryland
11
---
164
---
---
1
1
---
420
---
North Carolina
6
---
94
---
---
2
2
---
N
---
South Carolina
---
---
147
---
1
---
---
---
---
---
Virginia
9
---
198
---
---
2
---
2
620
---
West Virginia
1
---
11
---
---
---
---
---
86
---
E.S. Central
7
---
473
---
---
3
3
---
181
---
Alabama
5
---
69
N
---
2
2
---
---
---
Kentucky
---
---
183
---
---
1
1
---
45
---
Mississippi
---
---
105
---
---
---
---
---
7
---
Tennessee
2
---
116
---
---
---
---
---
129
---
W.S. Central
27
1
2,438
---
---
26
22
4
94
---
Arkansas
5
---
197
---
---
2
2
---
49
---
Louisiana
1
---
95
---
---
---
---
---
---
---
Oklahoma
1
---
100
---
---
---
N
N
43
---
Texas
20
1
2,046
---
N
24
20
4
2
---
Mountain
26
---
885
2
---
19
16
3
108
---
Arizona
5
---
218
1
---
4
3
1
N
---
Colorado
8
---
161
---
---
5
5
---
---
---
Idaho
2
---
40
---
---
1
1
---
11
---
Montana
1
---
84
---
---
1
1
---
13
---
Nevada
6
---
28
---
---
2
2
---
12
---
New Mexico
---
---
94
1
---
3
3
---
30
---
Utah
4
---
242
---
---
3
1
2
14
---
Wyoming
---
---
18
---
---
---
---
---
28
---
Pacific
55
---
1,472
---
2
24
22
2
207
1
Alaska
5
---
277
---
---
---
---
---
15
---
California
31
---
534
---
1
20
18
2
179
1
Hawaii
4
---
20
---
---
3
3
---
---
---
Oregon
1
---
181
---
1
1
1
---
13
---
Washington
14
---
460
---
---
---
---
---
---
---
American Samoa
25
---
---
---
N
---
---
N
N
N
C.N.M.I.
---
---
---
---
---
---
---
---
---
---
Guam
U
U
U
U
U
U
U
U
U
U
Puerto Rico
3
---
---
---
N
---
---
---
59
---
U.S. Virgin Islands
---
---
---
---
---
---
---
---
N
---
N: Not reportable. U: Unavailable. ---: No reported cases. C.N.M.I.: Commonwealth of Northern Mariana Islands.
TABLE 2. (Continued) Reported cases of notifiable diseases,* by geographic division and area --- United States, 2008
Area
Rocky Mountain spotted fever†††
Rubella
Salmonellosis
Shiga toxin-producing E. Coli (STEC)§§§
Shigellosis
Streptococcal disease, invasive,
Streptococcal toxic-shock syndrome
Total
Confirmed
Probable
United States
2,563
190
2,367
16
51,040
5,309
22,625
5,674
157
New England
7
---
7
2
2,244
264
243
397
23
Connecticut
---
---
---
1
491
47
40
118
21
Maine
1
---
1
---
159
26
20
28
N
Massachusetts
2
---
2
1
1,227
117
160
176
1
New Hampshire
1
---
1
---
155
34
6
30
---
Rhode Island
3
---
3
---
115
10
12
29
---
Vermont
---
---
---
---
97
30
5
16
1
Mid. Atlantic
154
5
149
4
5,827
476
2,572
1,097
23
New Jersey
85
3
82
---
1,297
138
925
191
4
New York (Upstate)
43
1
42
---
1,491
187
596
347
18
New York City
11
1
10
1
1,276
58
738
207
---
Pennsylvania
15
---
15
3
1,763
93
313
352
1
E.N. Central
150
9
141
2
5,252
876
4,339
1,018
61
Illinois
110
3
107
---
1,522
135
990
279
36
Indiana
6
6
---
---
652
96
607
150
10
Michigan
3
---
3
---
960
219
257
186
1
Ohio
31
---
31
---
1,366
204
1,923
262
13
Wisconsin
---
---
---
2
752
222
562
141
1
W.N. Central
439
22
417
1
2,878
837
953
401
10
Iowa
8
1
7
---
425
208
214
---
---
Kansas
---
---
---
---
467
52
67
41
---
Minnesota
---
---
---
---
748
191
311
185
6
Missouri
407
12
395
---
764
153
227
96
2
Nebraska
20
7
13
---
243
150
16
44
2
North Dakota
1
1
---
1
79
30
42
12
---
South Dakota
3
1
2
---
152
53
76
23
---
S. Atlantic
961
109
852
3
12,837
844
3,248
1,177
19
Delaware
33
1
32
---
148
15
12
11
2
District of Columbia
6
3
3
---
62
6
21
15
---
Florida
19
1
18
3
5,312
146
801
275
N
Georgia
78
78
---
---
2,302
88
1,103
273
---
Maryland
92
8
84
---
884
128
138
198
N
North Carolina
511
10
501
---
1,570
142
275
136
6
South Carolina
57
7
50
---
1,185
46
554
78
---
Virginia
155
1
154
---
1,165
241
310
150
---
West Virginia
10
---
10
---
209
32
34
41
11
E.S. Central
338
13
321
---
3,533
286
1,959
197
4
Alabama
93
2
91
---
1,013
65
427
N
N
Kentucky
1
1
---
---
485
100
264
46
4
Mississippi
11
---
11
---
1,087
5
296
N
N
Tennessee
233
10
219
---
948
116
972
151
---
W.S. Central
465
17
448
---
8,401
535
6,127
598
---
Arkansas
129
2
127
---
797
59
585
11
---
Louisiana
6
2
4
---
1,115
9
640
19
---
Oklahoma
268
10
258
---
906
135
237
142
N
Texas
62
3
59
---
5,583
332
4,665
426
---
Mountain
46
12
32
---
3,425
635
1,261
606
17
Arizona
17
11
6
---
1,154
69
650
204
---
Colorado
1
---
1
---
718
204
150
150
1
Idaho
1
---
1
---
200
149
14
16
---
Montana
3
---
3
---
130
38
8
N
N
Nevada
3
1
2
---
241
19
228
13
3
New Mexico
4
---
4
---
521
52
161
148
---
Utah
7
---
6
---
377
91
42
66
13
Wyoming
10
---
9
---
84
13
8
9
---
Pacific
3
3
---
4
6,643
556
1,923
183
---
Alaska
N
---
---
1
58
6
1
41
---
California
---
---
---
3
5,034
280
1,665
N
N
Hawaii
N
---
---
---
269
13
46
142
---
Oregon
3
3
---
---
436
68
95
N
N
Washington
---
---
---
---
846
189
116
N
N
American Samoa
N
---
---
1
3
---
1
30
N
C.N.M.I.
---
---
---
---
---
---
---
---
---
Guam
U
U
U
U
U
U
U
U
U
Puerto Rico
N
---
---
---
847
---
31
N
N
U.S. Virgin Islands
N
---
---
---
---
---
---
---
---
N: Not reportable. U: Unavailable. ---: No reported cases. C.N.M.I.: Commonwealth of Northern Mariana Islands.
††† Revision of National Surveillance Case Definition distinguishing between confirmed and probable cases. Total count includes six unknown case status reports.
§§§ Includes E-coli O157:H7; shiga toxin positive, serogroup non-O157; and shiga toxin positive, not serogrouped.
TABLE 2. (Continued) Reported cases of notifiable diseases,* by geographic division and area --- United States, 2008
N: Not reportable. U: Unavailable. ---: No reported cases. C.N.M.I.: Commonwealth of Northern Mariana Islands.
¶¶¶ Includes the following categories: primary, secondary, latent (including early latent, late latent, and latent syphilis of unknown duration), neurosyphilis, late (including late syphilis with clinical manifestations other than neurosyphilis), and congenital syphilis.
TABLE 2. (Continued) Reported cases of notifiable diseases,* by geographic division and area --- United States, 2008
Area
Tuberculosis****
Tularemia
Typhoid fever
Vancomycin- intermediate Staphylococcus aureus
Varicella
Vibriosis
Morbidity
Mortality††††
United States
12,904
123
449
63
30,386
2
588
New England
429
19
23
9
1,729
---
19
Connecticut
98
---
3
2
857
---
14
Maine
9
---
---
---
269
---
3
Massachusetts
261
19
16
7
---
---
---
New Hampshire
19
---
2
N
280
---
2
Rhode Island
36
---
1
---
---
---
---
Vermont
6
---
1
---
323
---
---
Mid. Atlantic
2,009
3
124
22
2,409
2
22
New Jersey
422
2
31
N
N
N
17
New York (Upstate)
305
---
12
6
N
1
N
New York City
895
1
57
16
---
1
5
Pennsylvania
387
---
24
---
2,409
---
N
E.N. Central
1,056
2
44
11
7,805
---
30
Illinois
469
1
18
2
1,489
---
11
Indiana
118
---
1
N
---
---
5
Michigan
188
---
9
6
3,053
---
N
Ohio
213
---
8
3
2,403
---
9
Wisconsin
68
1
8
---
860
---
5
W.N. Central
476
45
25
4
1,418
---
8
Iowa
49
---
6
---
N
N
N
Kansas
57
2
2
N
481
---
N
Minnesota
211
2
7
3
---
---
8
Missouri
107
21
2
1
774
---
N
Nebraska
33
7
3
---
N
N
N
North Dakota
3
3
3
---
108
---
N
South Dakota
16
10
2
---
55
---
N
S. Atlantic
2,630
5
78
7
4,863
---
205
Delaware
23
---
4
---
47
---
4
District of Columbia
54
---
---
N
24
---
2
Florida
954
---
18
3
1,735
---
94
Georgia
478
---
9
1
N
N
18
Maryland
278
1
17
N
N
---
33
North Carolina
335
3
6
3
N
N
13
South Carolina
188
---
4
---
886
---
12
Virginia
292
1
19
---
1,489
---
29
West Virginia
28
---
1
---
682
---
N
E.S. Central
677
4
7
2
1,127
---
42
Alabama
176
---
4
N
1,113
---
23
Kentucky
101
2
---
N
N
N
2
Mississippi
118
---
---
2
14
N
7
Tennessee
282
2
3
---
N
---
10
W.S. Central
1,911
18
39
2
8,688
---
63
Arkansas
83
11
4
---
777
---
N
Louisiana
227
---
---
---
72
---
---
Oklahoma
100
7
3
---
N
N
6
Texas
1,501
---
32
2
7,839
---
57
Mountain
544
17
10
3
2,203
---
24
Arizona
227
---
3
2
---
---
14
Colorado
103
2
4
N
874
---
8
Idaho
11
2
---
N
N
N
N
Montana
9
---
1
N
336
---
N
Nevada
102
2
---
---
N
N
N
New Mexico
60
1
1
N
219
---
2
Utah
27
8
1
1
763
---
---
Wyoming
5
2
---
---
11
---
---
Pacific
3,172
10
99
3
144
---
175
Alaska
50
---
1
N
76
N
1
California
2,695
2
75
N
---
---
104
Hawaii
124
---
7
3
68
---
30
Oregon
75
4
1
N
N
N
11
Washington
228
4
15
N
N
N
29
American Samoa
3
---
6
N
N
N
N
C.N.M.I.
34
---
---
---
---
---
---
Guam
90
U
U
U
U
---
U
Puerto Rico
95
---
---
---
600
N
N
U.S. Virgin Islands
4
---
---
N
---
---
N
N: Not reportable. U: Unavailable. ---: No reported cases. C.N.M.I.: Commonwealth of Northern Mariana Islands.
**** Totals reported to the Division of Tuberculosis Elimination, NCHHSTP, as of May 15, 2009.
†††† Totals reported to the Division of Viral Diseases, National Center for Immunization and Respiratory Diseases (NCIRD), as of June 30, 2009.
TABLE 3. Reported cases and incidence* of notifiable diseases,† by age group --- United States, 2008
Disease
<1 yr
1--4 yrs
5--14 yrs
15--24 yrs
25--39 yrs
40--64 yrs
≥65 yrs
Age not stated
Total
No.
Rate
No.
Rate
No.
Rate
No.
Rate
No.
Rate
No.
Rate
No.
Rate
AIDS§
31
(0.73)
588
(14.06)
5,616
(68.31)
11,321
(47.34)
17,411
(27.72)
4,151
(3.89)
62
(0.07)
22
39,202
Botulism, total
106
(2.49)
3
(0.07)
---
(0)
3
(0.01)
4
(0.01)
20
(0.02)
8
(0.01)
1
145
foodborne
---
(0)
1
(0.02)
---
(0)
2
(0.01)
1
(0)
6
(0.01)
7
(0.01)
---
17
infant
106
(2.49)
2
(0.05)
---
(0)
---
(0)
---
(0)
---
(0)
---
(0)
1
109
other (wound and unspecified)
---
(0)
---
(0)
---
(0)
1
(0)
3
(0.01)
14
(0.01)
1
(0)
---
19
Brucellosis
---
(0)
3
(0.07)
8
(0.10)
8
(0.03)
19
(0.03)
24
(0.02)
18
(0.02)
---
80
Chancroid¶
---
(0)
---
(0)
---
(0)
14
(0.06)
10
(0.02)
1
(0)
---
(0)
---
25
Chlamydia trachomatis infections¶
---
(0)
---
(0)
---
(0)
856,189
(3580.47)
299,307
(476.45)
35,326
(33.13)
887
(0.97)
3,168
1,210,523
Cholera
---
(0)
---
(0)
---
(0)
---
(0)
2
(0)
1
(0)
2
(0)
---
5
Coccidioidomycosis**
8
(0.19)
36
(0.86)
225
(2.74)
726
(3.04)
1,632
(2.60)
3,169
(2.97)
1,689
(1.84)
38
7,523
Cryptosporidiosis
157
(3.69)
1,845
(44.12)
2,050
(24.93)
1,023
(4.28)
1,769
(2.82)
1,567
(1.47)
618
(0.67)
84
9,113
Cyclosporiasis
---
(0)
3
(0.08)
3
(0.04)
7
(0.03)
30
(0.05)
63
(0.07)
27
(0.03)
6
139
Domestic arboviral diseases††
California serogroup virus
neuroinvasive
1
(0.02)
10
(0.24)
34
(0.41)
---
(0)
2
(0)
4
(0)
4
(0)
---
55
nonneuroinvasive
---
(0)
1
(0.02)
3
(0.04)
---
(0)
1
(0)
2
(0)
---
(0)
---
7
Eastern equine encephalitis virus, neuroinvasive
2
(0.05)
---
(0)
---
(0)
---
(0)
---
(0)
---
(0)
2
(0)
---
4
Powassan virus, neuroinvasive
---
(0)
---
(0)
2
(0.02)
---
(0)
---
(0)
---
(0)
---
(0)
---
2
St. Louis encephalitis virus
neuroinvasive
---
(0)
---
(0)
---
(0)
---
(0)
3
(0)
5
(0)
---
(0)
---
8
nonneuroinvasive
---
(0)
1
(0.02)
2
(0.02)
---
(0)
---
(0)
2
(0)
---
(0)
---
5
West Nile virus
neuroinvasive
---
(0)
7
(0.17)
14
(0.17)
42
(0.18)
79
(0.13)
280
(0.26)
267
(0.29)
---
689
nonneuroinvasive
---
(0)
2
(0.05)
22
(0.27)
39
(0.16)
133
(0.21)
361
(0.34)
110
(0.12)
---
667
Ehrlichiosis/Anaplasmosis
Ehrlichia chaffeensis
1
(0.03)
22
(0.57)
76
(1.01)
62
(0.28)
102
(0.18)
429
(0.44)
256
(0.30)
9
957
Ehrlichia ewingii
---
(0)
---
(0)
---
(0)
1
(0)
2
(0)
2
(0)
4
(0)
---
9
Anaplasma phagocytophilum
---
(0)
6
(0.19)
54
(0.86)
39
(0.21)
95
(0.20)
477
(0.58)
313
(0.44)
25
1,009
Undetermined
---
(0)
4
(0.13)
14
(0.22)
8
(0.04)
21
(0.04)
56
(0.07)
28
(0.04)
1
132
Giardiasis
226
(6.41)
3,427
(98.99)
3,104
(45.60)
1,861
(9.37)
3,416
(6.45)
5,103
(5.67)
1,360
(1.73)
411
18,908
Gonorrhea¶
---
(0)
---
(0)
---
(0)
205,816
(860.70)
100,593
(160.13)
24,765
(23.23)
655
(0.71)
801
336,742
Haemophilus influenzae, invasive disease all ages, all serotypes
261
(6.13)
176
(4.21)
91
(1.11)
95
(0.40)
176
(0.28)
720
(0.68)
1,336
(1.46)
31
2,886
age <5 years
serotype bt
18
(0.42)
12
(0.29)
---
(0)
---
(0)
---
(0)
---
(0)
---
(0)
---
30
nonserotype b
146
(3.43)
98
(2.34)
---
(0)
---
(0)
---
(0)
---
(0)
---
(0)
---
244
unknown serotype
97
(2.28)
66
(1.58)
---
(0)
---
(0)
---
(0)
---
(0)
---
(0)
---
163
Hansen disease (Leprosy)
---
(0)
---
(0)
---
(0)
8
(0.04)
22
(0.04)
22
(0.02)
9
(0.01)
19
80
Hantavirus pulmonary syndrome
---
(0)
---
(0)
---
(0)
3
(0.01)
10
(0.02)
5
(0)
---
(0)
---
18
Hemolytic uremic syndrome, post-diarrheal
14
(0.35)
164
(4.17)
74
(0.96)
17
(0.08)
8
(0.01)
26
(0.03)
24
(0.03)
3
330
Hepatitis, viral, acute
A
6
(0.14)
60
(0.36)
287
(0.72)
377
(0.89)
620
(1.01)
852
(0.87)
368
(0.97)
15
2,585
B
---
(0)
3
(0.02)
9
(0.02)
307
(0.73)
1,586
(2.58)
1,898
(1.93)
204
(0.54)
26
4,033
C
1
(0.02)
---
(0)
4
(0.01)
160
(0.38)
318
(0.52)
360
(0.37)
27
(0.07)
7
877
Influenza-associated pediatric mortality§§
14
(0.33)
29
(0.18)
43
(0.11)
4
(0.03)
---
(0)
---
(0)
---
(0)
---
90
Legionellosis
3
(0.07)
2
(0.05)
9
(0.11)
40
(0.17)
220
(0.35)
1,649
(1.55)
1,241
(1.35)
17
3,181
Listeriosis
93
(2.18)
6
(0.14)
6
(0.07)
34
(0.14)
55
(0.09)
191
(0.18)
361
(0.39)
13
759
Lyme disease, total
51
(1.20)
1,139
(27.23)
5,261
(63.99)
3,182
(13.31)
4,218
(6.71)
12,327
(11.56)
4,532
(4.95)
4,488
35,198
confirmed
47
(1.10)
1,030
(24.63)
4,401
(53.53)
2,516
(10.52)
3,356
(5.34)
10,094
(9.47)
3,555
(3.88)
3,922
28,921
probable
4
(0.09)
109
(2.61)
860
(10.46)
666
(2.79)
862
(1.37)
2,233
(2.09)
977
(1.07)
566
6,277
Malaria
3
(0.07)
45
(1.08)
132
(1.61)
199
(0.83)
367
(0.58)
449
(0.42)
44
(0.05)
16
1,255
Measles, total
17
(0.40)
31
(0.74)
47
(0.57)
16
(0.07)
17
(0.03)
11
(0.01)
---
(0)
1
140
indigenous
13
(0.31)
29
(0.69)
44
(0.54)
12
(0.05)
9
(0.01)
8
(0.01)
---
(0)
---
115
imported
4
(0.09)
2
(0.05)
3
(0.04)
4
(0.02)
8
(0.01)
3
(0)
---
(0)
1
25
Meningococcal disease, all serogroups
160
(3.76)
124
(2.96)
84
(1.02)
208
(0.87)
135
(0.21)
240
(0.23)
214
(0.23)
7
1,172
serogroup A,C,Y, and W-135
31
(0.73)
25
(0.60)
29
(0.35)
53
(0.22)
36
(0.06)
68
(0.06)
87
(0.09)
1
330
serogroup B
46
(1.08)
30
(0.72)
12
(0.15)
40
(0.17)
16
(0.03)
26
(0.02)
15
(0.02)
3
188
other serogroup
5
(0.12)
6
(0.14)
4
(0.05)
8
(0.03)
4
(0.01)
6
(0.01)
5
(0.01)
---
38
serogroup unknown
78
(1.83)
63
(1.51)
39
(0.47)
107
(0.45)
79
(0.13)
140
(0.13)
107
(0.12)
3
616
Mumps
3
(0.07)
57
(1.36)
121
(1.47)
83
(0.35)
73
(0.12)
93
(0.09)
18
(0.02)
6
454
Novel influenza A virus infections
---
(0)
---
(0)
1
(0.01)
1
(0)
---
(0)
---
(0)
---
(0)
---
2
Pertussis
2,180
(51.21)
1,288
(30.80)
4,994
(60.74)
1,385
(5.79)
1,069
(1.70)
1,433
(1.34)
258
(0.28)
671
13,278
Plague
---
(0)
---
(0)
---
(0)
1
(0)
1
(0)
1
(0)
---
(0)
---
3
Psittacosis
---
(0)
---
(0)
1
(0.01)
---
(0)
---
(0)
6
(0.01)
1
(0)
---
8
See footnotes on next page.
TABLE 3. (Continued) Reported cases and incidence* of notifiable diseases,† by age group --- United States, 2008
Disease
<1 yr
1--4 yrs
5--14 yrs
15--24 yrs
25--39 yrs
40--64 yrs
≥65 yrs
Age not stated
Total
No.
Rate
No.
Rate
No.
Rate
No.
Rate
No.
Rate
No.
Rate
No.
Rate
Q Fever, total
---
(0)
1
(0.02)
---
(0)
7
(0.03)
26
(0.04)
60
(0.06)
25
(0.03)
1
120
acute
---
(0)
1
(0.02)
---
(0)
7
(0.03)
23
(0.04)
54
(0.05)
20
(0.02)
1
106
chronic
---
(0)
---
(0)
---
(0)
---
(0)
3
(0)
6
(0.01)
5
(0.01)
---
14
Rabies
animal
22
(0.56)
4
(0.10)
2
(0.03)
4
(0.02)
11
(0.02)
12
(0.01)
9
(0.01)
4,132
4,196
human
---
(0)
---
(0)
---
(0)
1
(0)
---
(0)
1
(0)
---
(0)
---
2
Rocky Mountain spotted fever, total
2
(0.05)
45
(1.08)
223
(2.71)
268
(1.12)
479
(0.76)
1,123
(1.05)
417
(0.46)
6
2,563
confirmed
2
(0.05)
4
(0.10)
11
(0.13)
19
(0.08)
34
(0.05)
86
(0.08)
33
(0.04)
1
190
probable
---
(0)
41
(0.98)
212
(2.58)
249
(1.04)
443
(0.71)
1,034
(0.97)
383
(0.42)
5
2,367
Rubella
3
(0.07)
2
(0.05)
1
(0.01)
---
(0)
4
(0.01)
6
(0.01)
---
(0)
---
16
Salmonellosis
5,624
(132.11)
9,095
(217.47)
6,504
(79.11)
4,880
(20.41)
7,024
(11.18)
11,002
(10.32)
5,983
(6.53)
928
51,040
Shiga toxin-producing E. coli (STEC)
192
(4.51)
1,239
(29.63)
1,140
(13.87)
805
(3.37)
526
(0.84)
787
(0.74)
497
(0.54)
123
5,309
Shigellosis
492
(11.56)
7,320
(175.03)
7,781
(94.64)
1,491
(6.24)
2,873
(4.57)
1,952
(1.83)
533
(0.58)
183
22,625
Streptococcal disease, invasive, group A
150
(4.36)
300
(8.86)
318
(4.76)
226
(1.16)
643
(1.26)
2,101
(2.42)
1,869
(2.47)
67
5,674
Streptococcal, toxic-shock syndrome
1
(0.03)
1
(0.03)
8
(0.13)
6
(0.03)
27
(0.06)
66
(0.09)
47
(0.07)
1
157
Streptococcus pneumoniae, invasive disease all ages
† No cases of anthrax; diphtheria; Eastern equine encephalitis virus, non-neuroinvasive; poliomyelitis, paralytic; poliovirus infection, nonparalytic; Powassan virus, non-neuroinvasive; rubella, congenital syndrome; severe acute respiratory syndrome-associated coronavirus disease (SARS-CoV); smallpox; vancomycin-resistant Staphylococcus aureus (VRSA) infection; western equine encephalitis virus, neuroinvasive and non-neuroinvasive; and yellow fever were reported in 2008. Data on chronic hepatitis B and hepatitis C virus infection (past or present) are not included because they are undergoing data quality review. Data on human immunodeficiency virus (HIV) infections are not included because HIV infection reporting has been implemented on different dates and using different methods than for AIDS case reporting.
§ Total number of AIDS cases reported to the Division of HIV/AIDS Prevention, National Center for HIV/AIDS, Viral Hepatitis, STD, and TB Prevention (NCHHSTP) through December 31, 2008.
¶ Cases among persons aged <15 years are not shown because some might not be caused by sexual transmission; these cases are included in the totals. Totals reported to the Division of STD Prevention, NCHHSTP, as of May 8, 2009. Includes the following categories: primary, secondary, latent (including early latent, late latent, and latent syphilis of unknown duration), neurosyphilis, late (including late syphilis with clinical manifestations other than neurosyphilis), and congenital syphilis.
** Notifiable in <40 states.
†† Totals reported to the Division of Vector-Borne Diseases, National Center for Emerging and Zoonotic Infectious Diseases, (ArboNET Surveillance), as of May 1, 2009.
§§ Totals reported to the Influenza Division, National Center for Immunization and Respiratory Diseases, as of December 31, 2008.
¶¶ Totals reported to the Division of TB Elimination, NCHHSTP, as of May 15, 2009.
TABLE 4. Reported cases and incidence* of notifiable diseases,† by sex --- United States, 2008
Sex
Sex not stated
Male
Female
Disease
No.
Rate
No.
Rate
Total
AIDS§
29,015
(19.52)
10,186
(6.66)
1
39,202
Botulism, total
75
(0.05)
67
(0.04)
3
145
foodborne
8
(0.01)
9
(0.01)
---
17
infant
56
(2.57)
53
(2.55)
---
109
other (wound and unspecified)
11
(0.01)
5
(0)
3
19
Brucellosis
51
(0.03)
29
(0.02)
---
80
Chancroid¶
11
(0.01)
14
(0.01)
0
25
Chlamydia trachomatis infections¶
313,779
(211.07)
893,004
(583.81)
3,740
1,210,523
Cholera
3
(0)
2
(0)
---
5
Coccidioidomycosis**
4,167
(8.68)
3,308
(6.76)
48
7,523
Cryptosporidiosis
4,525
(3.04)
4,520
(2.95)
68
9,113
Cyclosporiasis
67
(0.05)
71
(0.05)
1
139
Domestic arboviral diseases††
California serogroup virus
neuroinvasive
38
(0.03)
17
(0.01)
---
55
nonneuroinvasive
4
(0)
3
(0)
---
7
Eastern equine encephalitis virus, neuroinvasive
3
(0)
1
(0)
---
4
Powassan virus, neuroinvasive
1
(0)
1
(0)
---
2
St. Louis encephalitis virus
neuroinvasive
4
(0)
4
(0)
---
8
nonneuroinvasive
1
(0)
4
(0)
---
5
West Nile virus
neuroinvasive
428
(0.29)
261
(0.17)
---
689
nonneuroinvasive
376
(0.25)
290
(0.19)
1
667
Ehrlichiosis/Anaplasmosis
Ehrlichia chaffeensis
556
(0.41)
396
(0.28)
5
957
Ehrlichia ewingii
5
(0)
4
(0)
---
9
Anaplasma phagocytophilum
594
(0.52)
407
(0.34)
8
1,009
Undetermined
79
(0.07)
53
(0.05)
---
132
Giardiasis
10,664
(8.48)
8,123
(6.27)
121
18,908
Gonorrhea¶
153,103
(102.99)
182,577
(119.36)
1,062
336,742
Haemophilus influenzae, invasive disease, all ages, all serotypes
1,294
(0.87)
1,578
(1.03)
14
2,886
age <5 yrs
serotype b
19
(0.18)
11
(0.11)
---
30
nonserotype b
136
(1.28)
107
(1.06)
1
244
unknown serotype
100
(0.94)
61
(0.60)
2
163
Hansen disease (Leprosy)
45
(0.03)
16
(0.01)
19
80
Hantavirus pulmonary syndrome
13
(0.01)
5
(0)
---
18
Hemolytic uremic syndrome, post-diarrheal
154
(0.11)
174
(0.12)
2
330
Hepatitis, viral, acute
A
1,326
(0.89)
1,241
(0.81)
18
2,585
B
2,533
(1.71)
1,491
(0.98)
9
4,033
C
437
(0.30)
423
(0.28)
17
877
Influenza-associated pediatric mortality§§
48
(0.13)
42
(0.12)
---
90
Legionellosis
2,030
(1.37)
1,140
(0.75)
11
3,181
Listeriosis
362
(0.24)
396
(0.26)
1
759
Lyme disease, total
18,911
(12.72)
15,550
(10.17)
737
35,198
confirmed
15,586
(10.48)
12,622
(8.25)
713
28,921
probable
3,325
(2.24)
2,928
(1.91)
24
6,277
Malaria
816
(0.55)
427
(0.28)
12
1,255
Measles, total
69
(0.05)
71
(0.05)
---
140
indigenous
57
(0.04)
58
(0.04)
---
115
imported
12
(0.01)
13
(0.01)
---
25
Meningococcal disease, invasive, all serogroups
544
(0.39)
620
(0.32)
8
1,172
serogroup A,C,Y, and W-135
132
(0.09)
195
(0.13)
3
330
serogroup B
90
(0.06)
97
(0.06)
1
188
other serogroup
27
(0.02)
10
(0.01)
1
38
serogroup unknown
295
(0.20)
318
(0.21)
3
616
See footnotes on next page.
TABLE 4. (Continued) Reported cases and incidence* of notifiable diseases,† by sex --- United States, 2008
Sex
Sex not stated
Male
Female
Disease
No.
Rate
No.
Rate
Total
Mumps
258
(0.17)
193
(0.13)
3
454
Novel influenza A virus infections
2
(0)
---
(0)
---
2
Pertussis
6,058
(4.08)
7,155
(4.68)
65
13,278
Plague
3
(0)
---
(0)
---
3
Psittacosis
5
(0)
3
(0)
---
8
Q Fever, total
97
(0.07)
22
(0.01)
1
120
acute
88
(0.06)
17
(0.01)
1
106
chronic
9
(0.01)
5
(0)
---
14
Rabies
animal
39
(0.03)
43
(0.03)
4,114
4,196
human
2
(0)
---
(0)
---
2
Rocky Mountain spotted fever, total
1,481
(1.00)
1,044
(0.68)
38
2,563
confirmed
103
(0.07)
85
(0.06)
2
190
probable
1,373
(0.92)
958
(0.63)
36
2,367
Rubella
6
(0)
10
(0.01)
---
16
Salmonellosis
24,313
(16.35)
26,339
(17.22)
388
51,040
Shiga toxin-producing E. coli (STEC)
2,506
(1.69)
2,760
(1.80)
43
5,309
Shigellosis
10,511
(7.07)
11,950
(7.81)
164
22,625
Streptococcal disease, invasive, group A
2,973
(2.45)
2,679
(2.14)
22
5,674
Streptococcal, toxic-shock syndrome
70
(0.07)
87
(0.08)
---
157
Streptococcus pneumoniae, invasive disease, all ages
† No cases of anthrax; diphtheria; eastern equine encephalitis virus, non-neuroinvasive; poliomyelitis, paralytic; poliovirus infection, nonparalytic; Powassan virus, non-neuroinvasive; rubella, congenital syndrome; severe acute respiratory syndrome-associated coronavirus disease (SARS-CoV); smallpox; vancomycin-resistant Staphylococcus aureus (VRSA) infection; western equine encephalitis virus, neuroinvasive and non-neuroinvasive; and yellow fever were reported in 2008. Data on chronic hepatitis B and hepatitis C virus infection (past or present) are not included because they are undergoing data quality review. Data on human immunodeficiency virus (HIV) infections are not included because HIV infection reporting has been implemented on different dates and using different methods than for AIDS case reporting.
§ Total number of AIDS cases reported to the Division of HIV/AIDS Prevention, National Center for HIV/AIDS, Viral Hepatitis, STD, and TB Prevention (NCHHSTP) through December 31, 2008.
¶ Totals reported to the Division of STD Prevention, NCHHSTP, as of May 8, 2009.
** Notifiable in <40 states.
†† Totals reported to the Division of Vector-Borne Diseases, National Center for Emerging and Zoonotic Infectious Diseases, (ArboNET Surveillance), as of May 1, 2009.
§§ Totals reported to the Influenza Division, National Center for Immunization and Respiratory Diseases, as of December 31, 2008.
¶¶ Totals reported to the Division of TB Elimination, NCHHSTP, as of May 15, 2009.
TABLE 5. Reported cases and incidence* of notifiable diseases,† by race --- United States, 2008
Disease
American Indian or Alaska Native
Asian or Pacific Islander
Black
White
Other
Race not stated
Total
No.
Rate
No.
Rate
No.
Rate
No.
Rate
AIDS§
225
(6.95)
621
(4.20)
19,448
(48.58)
15,423
(6.33)
431
3,054
39,202
Botulism, total
8
(0.25)
5
(0.03)
6
(0.01)
75
(0.03)
2
49
145
infant
1
(2.13)
5
(2.31)
3
(0.42)
63
(1.92)
1
36
109
Brucellosis
0
(0)
2
(0.01)
3
(0.01)
33
(0.01)
5
37
80
Chancroid¶
0
(0)
1
(0.01)
10
(0.02)
12
(0)
0
2
25
Chlamydia trachomatis infections¶
15,052
(465.18)
16,795
(113.68)
426,416
(1065.3)
343,574
(141.05)
39,239
369,447
1,210,523
Coccidioidomycosis**
78
(5.73)
139
(2.10)
310
(2.87)
1,998
(2.56)
169
4,829
7,523
Cryptosporidiosis
39
(1.21)
83
(0.56)
717
(1.79)
5,494
(2.26)
185
2,595
9,113
Cyclosporiasis
0
(0)
0
(0)
4
(0.01)
90
(0.04)
1
44
139
Domestic arboviral diseases††
California serogroup virus, neuroinvasive
0
(0)
0
(0)
0
(0)
48
(0.02)
1
6
55
West Nile virus
neuroinvasive
12
(0.37)
7
(0.05)
63
(0.16)
487
(0.20)
11
109
689
nonneuroinvasive
8
(0.25)
4
(0.03)
19
(0.05)
458
(0.19)
11
167
667
Ehrlichiosis/Anaplasmosis
Ehrlichia chaffeensis
21
(0.82)
2
(0.02)
19
(0.05)
672
(0.30)
16
227
957
Anaplasma phagocytophilum
12
(0.59)
3
(0.04)
7
(0.02)
534
(0.28)
8
445
1,009
Undetermined
0
(0)
0
(0)
1
(0)
82
(0.04)
2
47
132
Giardiasis
70
(2.42)
1,203
(8.89)
1,333
(4.03)
7,892
(3.84)
752
7,658
18,908
Gonorrhea¶
2,264
(69.97)
2,300
(15.57)
189,160
(472.56)
62,631
(25.71)
6,987
73,400
336,742
Haemophilus influenzae, invasive disease, all ages, all serotypes
47
(1.45)
36
(0.24)
341
(0.85)
1,759
(0.72)
84
619
2,886
age <5 years
serotype b
1
(0.45)
---
(0)
4
(0.12)
16
(0.10)
3
6
30
nonserotype b
9
(4.03)
3
(0.28)
43
(1.26)
123
(0.77)
14
52
244
unknown serotype
10
(4.47)
2
(0.19)
24
(0.70)
66
(0.41)
8
53
163
Hansen disease (Leprosy)
0
(0)
16
(0.12)
5
(0.01)
21
(0.01)
1
37
80
Hemolytic uremic syndrome, post-diarrheal
8
(0.26)
6
(0.04)
13
(0.03)
224
(0.10)
10
69
330
Hepatitis, viral, acute
A
19
(0.59)
180
(1.22)
147
(0.37)
1,388
(0.57)
111
740
2,585
B
42
(1.30)
102
(0.69)
815
(2.06)
2,003
(0.83)
103
968
4,033
C
15
(0.47)
4
(0.03)
56
(0.14)
585
(0.24)
25
192
877
Influenza-associated pediatric mortality§§
1
(0.11)
2
(0.06)
15
(0.12)
59
(0.10)
0
13
90
Legionellosis
7
(0.22)
44
(0.30)
522
(1.30)
2,023
(0.83)
63
522
3,181
Listeriosis
6
(0.19)
32
(0.22)
69
(0.17)
457
(0.19)
20
175
759
Lyme disease, total
104
(3.21)
249
(1.69)
298
(0.74)
19,799
(8.13)
1,405
13,343
35,198
confirmed
88
(2.72)
198
(1.34)
232
(0.58)
16,024
(6.58)
1,366
11,013
28,921
probable
16
(0.49)
51
(0.35)
66
(0.16)
3,775
(1.55)
39
2,330
6,277
Malaria
4
(0.12)
134
(0.91)
627
(1.57)
171
(0.07)
45
274
1,255
Measles, total
0
(0)
7
(0.05)
3
(0.01)
113
(0.05)
0
17
140
indigenous
0
(0)
2
(0.01)
3
(0.01)
94
(0.04)
0
16
115
imported
0
(0)
5
(0.03)
0
(0)
19
(0.01)
0
1
25
Meningococcal disease, invasive, all serogroups
12
(0.37)
29
(0.20)
172
(0.43)
655
(0.27)
28
276
1,172
serogroup A,C,Y, and W-135
4
(0.12)
2
(0.01)
53
(0.13)
200
(0.08)
9
62
330
serogroup B
1
(0.03)
5
(0.03)
12
(0.03)
128
(0.05)
3
39
188
other serogroup
0
(0)
0
(0)
0
(0)
31
(0.01)
1
6
38
serogroup unknown
7
(0.22)
22
(0.15)
107
(0.27)
296
(0.12)
15
169
616
Mumps
6
(0.19)
25
(0.17)
26
(0.06)
263
(0.11)
22
112
454
Pertussis
109
(3.37)
145
(0.98)
571
(1.43)
9,104
(3.74)
321
3,028
13,278
Q Fever, total
1
(0.03)
0
(0)
4
(0.01)
82
(0.03)
3
30
120
acute
1
(0.03)
0
(0)
4
(0.01)
72
(0.03)
2
27
106
Rabies, animal
0
(0)
0
(0)
0
(0)
23
(0.01)
2
4,171
4,196
Rocky Mountain spotted fever, total
104
(3.21)
9
(0.06)
85
(0.21)
1,703
(0.70)
37
625
2,563
confirmed
11
(0.34)
3
(0.02)
4
(0.01)
134
(0.06)
1
37
190
probable
93
(2.87)
6
(0.04)
81
(0.20)
1,568
(0.64)
36
583
2,367
Salmonellosis
428
(13.23)
1,202
(8.14)
4,183
(10.45)
28,167
(11.56)
1,439
15,621
51,040
Shiga toxin-producing E. coli (STEC)
36
(1.11)
79
(0.53)
208
(0.52)
3,391
(1.39)
103
1,492
5,309
Shigellosis
259
(8.00)
238
(1.61)
4,246
(10.61)
10,219
(4.20)
797
6,866
22,625
Streptococcal disease, invasive, group A
113
(4.59)
107
(1.17)
792
(2.28)
3,221
(1.61)
157
1,284
5,674
Streptococcal, toxic-shock syndrome
0
(0)
2
(0.02)
19
(0.06)
114
(0.06)
2
20
157
See footnotes on next page.
TABLE 5. (Continued) Reported cases and incidence* of notifiable diseases,† by race --- United States, 2008
Disease
American Indian or Alaska Native
Asian or Pacific Islander
Black
White
Other
Race not stated
Total
No.
Rate
No.
Rate
No.
Rate
No.
Rate
Streptococcus pneumoniae, invasive disease, all ages
* Per 100,000 population. Diseases for which <25 cases were reported are not included in this table.
† No cases of anthrax; diphtheria; eastern equine encephalitis virus, non-neuroinvasive; poliomyelitis, paralytic; poliovirus infection, nonparalytic; Powassan virus, non-neuroinvasive; rubella; congenital syndrome; severe acute respiratory syndrome-associated coronavirus disease (SARS-CoV); smallpox, vancomycin-resistant Staphylococcus aureus (VRSA) infection; western equine encephalitis virus, neuroinvasive and non-neuroinvasive; and yellow fever were reported in 2008. Data on chronic hepatitis B and hepatitis C virus infection (past or present) are not included because they are undergoing data quality review. Data on human immunodeficiency virus (HIV) infections are not included because HIV infection reporting has been implemented on different dates and using different methods than for AIDS case reporting.
§ Total number of AIDS cases reported to the Division of HIV/AIDS Prevention, National Center for HIV/AIDS, Viral Hepatitis, STD, and TB Prevention (NCHHSTP) through December 31, 2008.
¶ Cases with unknown race have not been redistributed. For this reason, the total number of cases reported here might differ slightly from totals reported in other surveillance summaries. Totals reported to the Division of STD Prevention, National Center for HIV/AIDS, Viral Hepatitis, STD Prevention, NCHHSTP, as of May 8, 2009.
** Notifiable in <40 states.
†† Totals reported to the Division of Vector-Borne Diseases, National Center for Emerging and Zoonotic Infectious Diseases (ArboNET Surveillance), as of May 1, 2009.
§§ Totals reported to the Influenza Division, National Center for Immunization and Respiratory Diseases, as of December 31, 2008.
¶¶ Totals reported to the Division of TB Elimination, NCHHSTP, as of May 15, 2009.
TABLE 6. Reported cases and incidence* of notifiable diseases,† by ethnicity --- United States, 2008
Disease
Hispanic
Non---Hispanic
Ethnicity not stated
Total
No.
Rate
No.
Rate
AIDS§
7,108
(15.62)
30,192
(11.79)
1,902
39,202
Botulism, total
29
(0.06)
73
(0.03)
43
145
infant
21
(2.16)
56
(1.77)
32
109
Brucellosis
43
(0.09)
23
(0.01)
14
80
Chancroid¶
5
(0.01)
17
(0.01)
3
25
Chlamydia trachomatis infections¶
167,306
(367.67)
570,526
(222.76)
472,691
1,210,523
Coccidioidomycosis**
1,020
(5.43)
1,759
(2.25)
4,744
7,523
Cryptosporidiosis
755
(1.66)
4,602
(1.80)
3,756
9,113
Cyclosporiasis
14
(0.03)
91
(0.04)
34
139
Domestic arboviral diseases††
California serogroup virus, neuroinvasive
0
(0)
34
(0.01)
21
55
West Nile virus
neuroinvasive
137
(0.30)
412
(0.16)
140
689
nonneuroinvasive
72
(0.16)
379
(0.15)
216
667
Ehrlichiosis/Anaplasmosis
Ehrlichia chaffeensis
31
(0.07)
592
(0.25)
334
957
Anaplasma phagocytophilum
16
(0.06)
380
(0.19)
613
1,009
Undetermined
1
(0)
61
(0.03)
70
132
Giardiasis
1,436
(4.01)
8,275
(3.77)
9,197
18,908
Gonorrhea¶
23,888
(52.50)
192,110
(75.01)
120,744
336,742
Haemophilus influenzae, invasive disease, all ages, all serotypes
190
(0.42)
1,463
(0.57)
1,233
2,886
age <5 years
serotype b
6
(0.12)
12
(0.08)
12
30
nonserotype b
51
(1.04)
126
(0.80)
67
244
unknown serotype
14
(0.28)
69
(0.44)
80
163
Hansen disease (Leprosy)
25
(0.06)
27
(0.01)
28
80
Hemolytic uremic syndrome, post-diarrheal
47
(0.11)
202
(0.09)
81
330
Hepatitis, viral, acute
A
470
(1.03)
1,357
(0.53)
758
2,585
B
373
(0.82)
2,257
(0.89)
1,403
4,033
C
57
(0.13)
461
(0.18)
359
877
Influenza-associated pediatric mortality§§
20
(0.13)
58
(0.10)
12
90
Legionellosis
131
(0.29)
1,803
(0.70)
1,247
3,181
Listeriosis
132
(0.29)
389
(0.15)
238
759
Lyme disease, total
469
(1.03)
13,347
(5.21)
21,382
35,198
confirmed
365
(0.80)
10,933
(4.27)
17,623
28,921
probable
104
(0.23)
2,414
(0.94)
3,759
6,277
Malaria
40
(0.09)
824
(0.32)
391
1,255
Measles, total
11
(0.02)
92
(0.04)
37
140
indigenous
11
(0.02)
71
(0.03)
33
115
imported
0
(0)
21
(0.01)
4
25
Meningococcal disease, invasive, all serogroups
147
(0.32)
659
(0.26)
366
1,172
serogroup A,C,Y, and W-135
40
(0.09)
178
(0.07)
112
330
serogroup B
22
(0.05)
106
(0.04)
60
188
other serogroup
4
(0.01)
21
(0.01)
13
38
serogroup unknown
81
(0.18)
354
(0.14)
181
616
Mumps
74
(0.16)
249
(0.10)
131
454
Pertussis
1,462
(3.21)
7,901
(3.08)
3,915
13,278
Q Fever, total
17
(0.04)
68
(0.03)
35
120
acute
17
(0.04)
57
(0.02)
32
106
Rabies, animal
0
(0)
0
(0)
---
4,196
Rocky Mountain spotted fever, total
82
(0.18)
1,631
(0.64)
850
2,563
confirmed
5
(0.01)
125
(0.05)
60
190
probable
76
(0.17)
1,505
(0.59)
786
2,367
Salmonellosis
6,888
(15.14)
25,028
(9.77)
19,124
51,040
Shiga toxin-producing E. coli (STEC)
460
(1.01)
2,926
(1.14)
1,923
5,309
Shigellosis
5,295
(11.64)
9,446
(3.69)
7,884
22,625
See footnotes on next page.
TABLE 6. (Continued) Reported cases and incidence* of notifiable diseases,† by ethnicity --- United States, 2008
Disease
Hispanic
Non---Hispanic
Ethnicity not stated
Total
No.
Rate
No.
Rate
Streptococcal disease, invasive, group A
432
(1.39)
2,712
(1.26)
2,530
5,674
Streptococcal, toxic-shock syndrome
7
(0.03)
82
(0.04)
68
157
Streptococcus pneumoniae, invasive disease, all ages
* Per 100,000 population. Diseases for which <25 cases were reported are not included in this table.
† No cases of anthrax; diphtheria; eastern equine encephalitis virus, non-neuroinvasive; poliomyelitis, paralytic; poliovirus infection, nonparalytic; Powassan virus, non-neuroinvasive; rubella, congenital syndrome; severe acute respiratory syndrome-associated coronavirus disease (SARS-CoV); smallpox; vancomycin-resistant Staphylococcus aureus (VRSA) infection; western equine encephalitis virus, neuroinvasive and non-neuroinvasive; and yellow fever were reported in 2008. Data on chronic hepatitis B and hepatitis C virus infection (past or present) are not included because they are undergoing data quality review. Data on human immunodeficiency virus (HIV) infections are not included because HIV infection reporting has been implemented on different dates and using different methods than for AIDS case reporting.
§ Total number of AIDS cases reported to the Division of HIV/AIDS Prevention, National Center for HIV/AIDS, Viral Hepatitis, STD, and TB Prevention (NCHHSTP) through December 31, 2008.
¶ Cases with unknown race have not been redistributed. For this reason, the total number of cases reported here might differ slightly from totals reported in other surveillance summaries. Totals reported to the Division of STD Prevention, NCHHSTP, as of May 8, 2009.
** Notifiable in <40 states.
†† Totals reported to the Division of Vector-Borne Diseases, National Center for Emerging and Zoonotic Infectious Diseases (ArboNET Surveillance), as of May 1, 2009.
§§ Totals reported to the Influenza Division, National Center for Immunization and Respiratory Diseases, as of December 31, 2008.
¶¶ Totals reported to the Division of TB Elimination, NCHHSTP, as of May 15, 2009.
PART 2
Graphs and Maps for Selected Notifiable Diseases in the United States, 2008
Abbreviations and Symbols Used in Graphs and Maps
U Data not available.
N Not reportable (i.e., report of disease not required in that jurisdiction).
DC District of Columbia
AS American Samoa
CNMI Commonwealth of Northern Mariana Islands
GU Guam
PR Puerto Rico
VI U.S. Virgin Islands
ACQUIRED IMMUNODEFICIENCY SYNDROME (AIDS). Percentage of reported cases, by race/ethnicity* --- United States, 2008
* For 0.9% of respondents, race/ethnicity was unknown.
Of persons reported with AIDS in 2008, the greatest percentage was among non-Hispanic blacks, followed by non-Hispanic whites, Hispanics, Asians/Pacific Islanders, and American Indians/Alaska Natives.
Alternate Text: The figure above presents the percentage of reported AIDS cases by race/ethnicity in the United States. Most cases occurred among non-Hispanics blacks (48.7%) followed by non-Hispance whites (30.2%) and Hispanics (18.1%).
ACQUIRED IMMUNODEFICIENCY SYNDROME (AIDS). Reported AIDS rates* --- United States† and U.S. territories, 2008
* Per 100,000 population.
† Includes 672 persons with unknown state of residence.
High rates (i.e., ≥15 cases per 100,000 population) of reported AIDS cases were observed in certain states in the Southeast and Northeast. Rates ≥15 cases per 100,000 population also were observed in Washington DC, and Puerto Rico.
Alternate Text: The figure above shows the number of AIDS cases in the United States and U.S. territories. The largest number of cases occurred in the southeast and the lowest number in the Midwest.
ACQUIRED IMMUNODEFICIENCY SYNDROME (AIDS). Number of reported pediatric cases* --- United States† and U.S. Territories, 2008
* Children and adolescents aged <13 years.
† Includes two persons with unknown state of residence.
During 2008, a total of 80 pediatric AIDS cases were reported in the United States and U.S. territories.
Alternate Text: The figure above presents the number of reported pediatric AIDS cases (i.e., persons aged <13 years) in the United States and U.S. territories. The largest number (16) occurred in Florida.
Anthrax. Number of reported cases, by year --- United States, 1953--2008
* One epizootic-associated cutaneous case was reported in 2001 from Texas.
No cases of anthrax were reported to CDC in 2008, and the number of naturally occurring cases reported in the United States and U.S. territories has remained two or fewer per year for the past 30 years. In 2006 and 2007, anthrax cases resulting from a previously unrecognized source of risk for serious illness from anthrax were reported, occurring among persons who make drums using untreated animal hides from countries where anthrax is common in animals and in persons exposed to environments cross-contaminated by these activities. Such cases constitute half of the naturally occurring cases reported to CDC during the past 10 years.
Alternate Text: The figure above shows the number of reported anthrax cases in the United States from 1953–2008 in the United States and U.S. territories. In the past 30 years, the number of naturally occurring cases reported was ≤2 a year. In 2001, an epizootic-assocated cutaneous case was reported in Texas.
Botulism, foodborne. Number of reported cases, by year --- United States, 1988--2008
Rates of foodborne botulism have remained relatively stable during the past two decades. In 2008, all cases were caused by home-canned or other home-prepared foods.
Alternate Text: The figure above presents the number of reported cases of foodborne botulism in the United States during a 20-year period. Rates remained stable during this period. The greatest number of outbreaks (50) occurred in 1994.
Botulism, infant. Number of reported cases, by year --- United States, 1988--2008
Infant botulism remains the most common cause of botulism in the United States and accounted for 73% of U.S. botulism cases in 2008.
Alternate Text: The figure above shows the number of reported cases of infant botulism in the United States from 1988–2008. Infant botulism is the most common cause of botulism and accounted for 73% of cases in 2008.
Botulism, other (includes wound and unspecified). Number of reported cases, by year --- United States, 1998--2008
Annual numbers of wound and unspecified forms of botulism have remained stable during the past decade. In 2008, a majority (96%) of cases occurred among injection-drug users in California, Washington, and Texas.
Alternate Text: The figure above presents the number of reported cases of other botulism (including wound and unspecified) in the United States during 1998-2008. In 2008, 96% of cases occurred among injection-drug users in California, Washington, and Texas.
Brucellosis. Number of reported cases, by year --- United States, 1978--2008
The incidence of brucellosis in the United States increased slightly during 2003--2007. In 2008, the number of cases reported to CDC decreased. Although brucellosis in cattle is in the final stages of eradication, the disease persists in feral swine, elk, and bison, increasing the risk of transmission to hunters while they clean and dress these animals. Outside of the United States, brucellosis remains endemic in several areas, including Mexico and the Mediterranean region, which poses a greater risk of infection to travelers who consume unpasteurized milk products, including soft cheeses.
Alternate Text: The above figure shows the number of reported cases of brucellosis in the United States from 1978–2008. Brucellosis is nearly eradicated in cattle, but remains in feral swine, elk, and bison. Outside the United States, brucellosis remains endemic in areas that include Mexico and the Mediterranean region.
Brucellosis. Number of reported cases --- United States and U.S. territories, 2008
Reports of brucellosis cases are more frequent along the southern U.S. border, as the disease remains endemic in Mexico. Consumption of unpasteurized milk products, including soft cheeses from regions where brucellosis is common in cattle, sheep, and goats, presents a substantial risk. Brucellosis caused by contact with infected feral swine while hunting has been documented in several southern and western states.
Alternate Text: The figure above presents the number of reported cases of brucellosis in the United States and U.S. territories in 2008. Cases are more frequent along the southern border states and Florida. The disease remains endemic in Mexico.
Chlamydia. Incidence* among women --- United States and U.S. territories, 2008
* Per 100,000 population.
In 2008, the chlamydia rate among women in the United States and territories (Guam, Puerto Rico, and Virgin Islands) was 580.0 cases per 100,000 population.
Alternate Text: The figure above shows the incidence of Chlamydia among women in the United States in 2008. The majority of cases occurred in the South and upper Midwest.
Cholera. Number of reported cases --- United States and U.S. territories, 2008
In 2008, a majority (80%) of cholera infections in the United States were acquired during travel abroad. Foreign travel and the consumption of contaminated domestic seafood remain important sources of cholera infection.
Alternate Text: The above figure presents the number of reported cases of cholera in the United States and U.S. territories n 2008. Approximately 80% of infections in the United States were acquired during travel abroad.
Coccidioidomycosis. Number of reported cses --- United States* and U.S. territories, 2008
* In the United States, coccidioidomycosis is endemic to the southwestern states. However, cases have been reported in other states, usually among travelers returning from areas in which the disease is endemic.
In 2008, the number of reported coccidioidomycosis cases in the United States decreased slightly, primarily because of fewer reports received from the disease-endemic states of California and, to a lesser extent, Arizona. Case counts decreased even after the case definition revision implemented by the Council of State and Territorial Epidemiologists in 2007 included less stringent diagnostic criteria.
Alternate Text: The figure above shows the number of reported cases of coccidioidomycosis in the United States and U.S. territories in 2008. Coccidioidomycosis is endemic in Arizona (4,768 cases) and California (2,597 cases). Cases in other states are reportedly among travelers returning from areas where the disease is endemic.
Cryptosporidiosis. Incidence,* by year --- United States, 1997--2008
* Per 100,000 population.
Cryptosporidiosis incidence decreased slightly in 2008 after a >3 fold increase during 2004--2007. Whether the changes in cryptosporidiosis reporting reflect a real change in cryptosporidiosis incidence or reflect changing diagnosis, testing, and reporting patterns is unclear.
Alternate Text: The figure above presents annual incidence of cryptosporidiosis in the United States from 1997–2008. Incidence peaked in 2007 before decreasing in 2008.
Cryptosporidiosis. Incidence* --- United States and U.S. territories, 2008
* Per 100,000 population.
Cryptosporidiosis is widespread geographically in the United States. Differences in reported incidence among states might reflect differences in risk factors, increased cases associated with outbreaks, or difference in the capacity to detect and report cases. Cryptosporidiosis cases increase during summer, coinciding with increased use of recreational water.
Alternate Text: The figure above shows the incidence of cryptosporidiosis in the United States and U.S. territories in 2008. Cryptosporidiosis is widespread geographically in the United States. Cases typically increase during the summer with increased use of recreational water.
Diphtheria. Number of reported cases, by year --- United States, 1978--2008
Since 2004, no case of respiratory diphtheria has been reported in the United States, and the national health objective of zero cases for 2010 has been maintained.
Alternate Text: The figure above shows the number of reported cases if diphtheria from 1978–2008. Since 2004, no cases have been reported in the United States.
DOMESTIC ARBOVIRAL DISEASES. Number* of reported cases of neuroinvasive disease, by year --- United States, 1999--2008
* Data from the Division of Vector-Borne Diseases, National Center for Emerging and Zoonotic Infectious Diseases (ArboNET Surveillance). Only reported cases of neuroinvasive disease are shown.
Arthropod-borne viruses (arboviruses) are primarily transmitted during the summer and fall in the United States, with the incidence of human disease peaking in the late summer. The most common arboviruses affecting humans in the United States are West Nile virus (WNV), La Crosse virus (LACV), Eastern equine encephalitis virus (EEEV), and St. Louis encephalitis virus (SLEV). LACV is the most common California (CAL) serogroup virus in the United States. LACV causes neuroinvasive disease primarily among children. In 2008, CAL serogroup virus neuroinvasive disease cases were reported from 12 states (Georgia, Kentucky, Louisiana, Minnesota, Mississippi, New York, North Carolina, Ohio, Tennessee, Virginia, West Virginia, and Wisconsin). During 1999--2008, a median of 93 (range: 50--167) cases per year were reported in the United States. EEEV disease in humans is associated with high mortality rates (>20%) and severe neurologic sequelae. In 2008, EEEV neuroinvasive disease cases were reported from four states (Alabama, Florida, Massachusetts, and North Carolina). During 1999--2008, a median of seven (range: 3--21) cases per year were reported in the United States. Before the introduction of WNV to the United States, SLEV was the nation's leading cause of epidemic viral encephalitis. In 2008, SLEV neuroinvasive disease cases were reported from three states (Arkansas, Louisiana, and North Carolina). During 1999--2008, a median of eight (range: 2--79) cases per year were reported in the United States.
Alternate Text: The figure above presents the number of reported cases of neuroinvasive disease in the United States from 1999–2008. California serogroup viruses had the highest rate of incidence.
DOMESTIC ARBOVIRAL DISEASES, WEST NILE. Incidence* of reported cases of neuroinvasive disease, by state --- United States, 2008
* Per 100,000 population. Data from the Division of Vector-Borne Diseases, National Center for Emerging and Zoonotic Infectious Diseases (ArboNET Surveillance).
In 2008, the states with the greatest reported incidence of West Nile virus neuroinvasive disease (WNND) were South Dakota (1.4 per 100,000 population), Arizona (1.0), California (0.8), Mississippi (0.8), and Kansas (0.5). The five states with the greatest number of reported cases were California (292), Arizona (62), Texas (40), New York (32), and Mississippi (22). California reported 42% of all WNND cases in 2008.
Alternate Text: The figure above shows the incidence of reported cases of neuroinvasive disease in the United States in 2008. The five states with the greatest number of reported cases were California (292), Arizona (62), Texas (40), New York (32), and Mississippi (22).
DOMESTIC ARBOVIRAL DISEASES, WEST NILE. Incidence* of reported cases of neuroinvasive disease, by year --- United States, 1999--2008
* Per 100,000 population.
West Nile virus (WNV) was first detected in the United States in 1999. Despite substantial geographic spread of the virus from 1999 through 2001, WNV neuroinvasive disease (WNND) incidence remained low until 2002, when large outbreaks occurred in the Midwest and Great Plains. The national incidence of WNND peaked in 2002 and 2003 and was relatively stable from 2004 through 2007. In 2008, the reported incidence of WNND in the United States was 0.23 per 100,000 population. Although WNND did not become nationally notifiable until 2002, WNND cases have been consistently reported to ArboNET since 2000.
Alternate Text: The figure above presents the incidence of reported cases of neuroinvasive disease in the United States from 1999–2008. Large outbreaks occurred during 2002–2003.
DOMESTIC ARBOVIRAL DISEASES, WEST NILE. Incidence* of reported cases of neuroinvasive disease, by age group --- United States, 2008
* Per 100,000 population.
In 2008, the median age of patients with West Nile virus neuroinvasive disease was 58 years (range: 1-- 92 years), with increasing incidence among older age groups.
Alternate Text: The figure above shows the incidence of reported cases of neuroinvasive disease, by age group, in the United States in 2008. The greatest rate of incidence occurred among patients aged 70-79 years followed by patients aged ≥80 years.
Ehrlichiosis, ANAPLASMA PHAGOCYTOPHILUM. Number of reported cases, by county --- United States, 2008
Anaplasmosis is caused by infection with Anaplasma phagocytophilum. Cases are reported primarily from the upper Midwest and coastal New England, reflecting both the range of the primary tick vector species (Ixodes scapularis) and the range of preferred animal hosts for tick feeding.
Alternate Text: The figure above presents the number of reported cases of the anaplasma phagocytophilum ehrlichiosis in the United States, by county, in 2008. Cases are reported primarily in the upper Midwest and coastal New England because of the range of the primary tick vector species Ixodes scapularis.
Ehrlichiosis, EHRLICHIA CHAFFEENSIS Number of reported cases, by county --- United States, 2008
The most common type of Ehrlichiosis results from infection with Ehrlichia chaffeensis. Cases are reported primarily in the lower Midwest, Southeast, and East Coast, reflecting the range of the primary tick vector species (Amblyomma americanum).
Alternate Text: The figure above shows the number of reported cases of ehrlichiosis, by county, in the United States in 2008. Cases are reported primarily in the lower Midwest, Southeast, and East Coast because of the primary tick vector species Amblyomma americanum.
Ehrlichiosis, ehrlichia ewingii. Number of reported cases, by county --- United States, 2008
Cases of ehrlichiosis caused by Ehrlichia ewingii remain rare and are reported primarily from the central United States.
Alternate Text: The figure above presents the number of reported cases of ehrlichiosis caused by Ehrlichia ewingii. Cases primarily occurred in the central United States.
Ehrlichiosis, UNDETERMINED. Number of reported cases, by county --- United States, 2008
Cases of ehrlichiosis and anaplasmosis caused by undetermined species, or more commonly, cases for which the geographically expected species is not clearly differentiated by serologic testing, are reflected in this reporting category. Because Ehrlichia and Anaplasma infections might elicit cross-reactive antibody responses, some states also might use this category to report cases for which single, inappropriate diagnostic tests were run (e.g., physicians ordering only ehrlichiosis tests in a region where anaplasmosis is expected to predominate).
Alternate Text: The figure above shows the number of reported cases of ehrlichiosis and anaplasmosis caused by undetermined species.
Giardiasis. Incidence* --- United States and U.S. territories, 2008
* Per 100,000 population.
Giardiasis is widespread geographically in the United States, with consistent increased reporting in certain states and regions. Whether this difference is of true biologic significance or reflects differences in giardiasis case detection and reporting among states is uncertain.
Alternate Text: The figure above presents the incidence of giardiasis in the United States and U.S. territories in 2008. Giardiasis is widespread geographically in the United States.
Gonorrhea. Incidence* --- United States and U.S. territories, 2008
* Per 100,000 population.
In 2008, the gonorrhea rate in the United States and territories (Guam, Puerto Rico, and Virgin Islands) was 110.3 cases per 100,000 population, a decrease from the rate in 2007.
Alternate Text: The figure above shows the incidence of gonorrhea in the United States and U.S. territories in 2008. Cases are more prevalent in four southeast states and the District of Columbia.
Gonorrhea. Incidence,* by sex --- United States, 1993--2008
* Per 100,000 population.
After a 74% decline in the rate of reported gonorrhea from 1975 through 1997, overall gonorrhea rates plateaued. For the eighth year in a row, the gonorrhea rate among women in 2008 was slightly higher than the rate among men.
Alternate Text: The figure above presents the reported incidence of gonorrhea, by sex, in the United States in 2008. For the eighth consecutive year, the gonorrhea rate among women in 2008 was slightly higher than the rate among men.
Gonorrhea. Incidence,* by race/ethnicity --- United States, 1993--2008
* Per 100,000 population.
† Y-axis is log scale.
Gonorrhea incidence among blacks decreased considerably during the 1990s but continues to be the highest among all races/ethnicities. In 2008, incidence among non-Hispanic blacks was approximately 20 times greater than that for non-Hispanic whites.
Alternate Text: The figure above shows the incidence of gonorrhea by race/ethnicity in the United States from 1993–2008. Incidence among blacks was the highest among all races/ethnicities.
Haemophilus influenzae, Invasive Disease. Incidence,* by age group --- United States, 1995--2008
* Per 100,000 population.
Substantial reductions in the incidence of Haemophilus influenzae serotype b (Hib) disease have been achieved through universal Hib vaccination. Before the introduction of conjugate vaccines in 1987, the incidence of invasive Hib disease among children aged <5 years was estimated to be 100 cases per 100,000 population. To monitor the epidemiology of Hib invasive disease and to detect the emergence of invasive non-Hib, serotyping of all Haemophilus influenzae isolates in children aged <5 years and thorough and timely investigation of all cases of Hib disease are essential.
Alternate Text: The figure above presents the incidence of haemophilus influenzae, by age group, in the United States from 1995-2008. Incidence is greater among children aged <5 years.
Hansen Disease (Leprosy). Number of reported cases, by year --- United States, 1988--2008
The number of cases of Hansen disease reported to CDC gradually declined during 1988--2008. This decline is primarily the result of decreasing numbers of imported cases.
Alternate Text: The figure above shows the number of cases of Hansen disease (leprosy), by year, in the United States from 1988–2008. Cases declined during that time, largely because of decreases in imported cases.
Hemolytic Uremic Syndrome, Postdiarrheal. Number of reported cases --- United States and U.S. territories, 2008
During 2008, as usual, most reported cases occurred among children aged 1--4 years. Hemolytic uremic syndrome has been a nationally notifiable disease since 1995. In 2008, cases continued to be reported from all regions of the country. Reporting is likely not complete; this is corroborated by data from Foodborne Disease Active Surveillance Network (FoodNet) sites indicating that additional cases can be detected by review of hospital discharge data.
Alternate Text: The figure above presents the number of reported cases of Hemolytic Uremic Syndrome (postdiarrheal) in the United States and U.S. territories in 2008. Most cases were reported in California (46).
Hepatitis, Viral. Incidence,* by year --- United States, 1978--2008
* Per 100,000 population.
† Hepatitis A vaccine was first licensed in 1995.
§ Hepatitis B vaccine was first licensed in June 1982.
¶ An anti-hepatitis C virus (HCV) antibody test first became available in May 1990.
Hepatitis A incidence continues to decline and in 2008 was the lowest ever recorded. This reduction in incidence is attributable, in part, to routine vaccination of children. Hepatitis A incidence has declined >90% since the last nationwide outbreak in 1995. Routine hepatitis B vaccination of infants has reduced rates >95% in children. Rates also have declined among adults, but a substantial proportion of cases continue to occur among adults with high-risk behaviors. Incidence of acute hepatitis C has declined approximately 90% since 1992; however, a substantial burden of disease as a result of chronic HCV infection remains.
Alternate Text: The figure above shows the incidence of hepatitis (viral) in the United States from 1978–2008. Hepatitis A incidence has declined >90% since the last nationwide outbreak in 1995. Routine hepatitis B vaccination of infants has reportedly reduced rates >95% in children.
Hepatitis A. Incidence,* by county --- United States, 2008
* Per 100,000 population.
In 1999, routine hepatitis A vaccination was recommended for children living in 11 states with consistently elevated rates of disease. Since then, rates of infection with hepatitis A virus (HAV) have declined in all regions, with the greatest decline occurring in western states. HAV infection rates are now the lowest ever reported and similar in all regions. As of 2006, hepatitis A vaccine is now recommended for children in all states.
Alternate Text: The figure above presents the incidence of hepatitis A, by county, in the United States in 2008. Hepatitis A virus rates are the lowest ever reported in all regions.
Influenza-Associated Pediatric Mortality. Incidence* --- United States and U.S. territories, 2008
* Per 100,000 population.
During 2008, 34 states and New York City reported a total of 90 influenza-associated pediatric deaths to CDC for an overall incidence rate in the United States of 0.12 deaths per 100,000 children aged <18 years. This is similar to rates estimated through mathematical modeling. State-to-state variation in rates likely reflected the rarity of the event and small population size rather than true differences in disease burden.
Alternate Text: The figure above shows the incidence of Influenza-associated pediatric mortality in the United States and U.S. territories in 2008. Thirty four states and New York City reported 90 influenza-associated pediatric deaths for an overall incidence rate in the United States of 0.12 deaths per 100,000 children aged <18 years.
Legionellosis. Incidence,* by year --- United States, 1993--2008
* Per 100,000 population.
Legionellosis incidence increased again in 2008, a trend that has been observed since 2003. Factors contributing to this increase might include a true increase in disease transmission, greater use of diagnostic testing, and increased reporting.
Alternate Text: The figure above presents the incidence of legionellosis, by year, in the United States from 1993. Incidence has been increasing every year since 2003.
Listeriosis. Incidence* --- United States and U.S. territories, 2008
* Per 100,000 population.
Listeriosis is primarily foodborne and occurs most frequently among persons who are older, pregnant, or immunocompromised. Although the infection is relatively uncommon, listeriosis is a leading cause of death attributable to foodborne illness in the United States. Recent outbreaks have been linked to sprouts and Mexican-style cheese.
Alternate Text: The figure above shows the incidence of listeriosis in the United States and U.S. territories in 2008. Incidence is greater in the Northeast, Alaska, Washington, Wyoming, and Wisconsin.
Lyme Disease. Incidence* of reported cases, by county --- United States, 2008
* Per 100,000 population.
Approximately 90% of Lyme disease cases are reported from the northeastern and upper midwestern United States. A rash that can be confused with early Lyme disease sometimes occurs following bites of the lone star tick (Amblyomma americanum). These ticks, which do not transmit the Lyme disease bacterium, are common human-biting ticks in southern and southeastern United States.
Alternate Text: The figure above presents the incidence of reported cases of Lyme disease, by county, in the United States in 2008. Approximately 90% of cases are reported from the Northeast and upper Midwest.
Malaria. Incidence,* by year --- United States, 1994--2008
* Per 100,000 population.
Following a steady rate from 2005 to 2007, the number of reported malaria cases decreased by almost 11% from 2007 to 2008, which is reflected in the decreasing incidence.
Alternate Text: The figure above shows the incidence of malaria in the United States from 1994–2008. The number of reported cases decreased by approximately 11% during 2007–2008.
Measles. Incidence,* by year --- United States, 1973--2008
* Per 100,000 population.
Measles vaccine was licensed in 1963. Evidence suggests that measles is no longer endemic in the United States.
Alternate Text: The figure above presents the incidence of measles, by year, in the United States from 1973–2008. Incidence peaked in 1977.
Meningococcal disease. Incidence,* by year --- United States, 1978--2008
* Per 100,000 population.
Meningococcal disease incidence is at a historic low but continues to cause substantial morbidity and mortality in the United States. The highest incidence of meningococcal disease occurs among infants, with a second peak occurring in late adolescence. In 2005, a quadrivalent (A, C, Y, W-135) meningococcal conjugate vaccine was licensed and recommended for adolescents and others at increased risk for disease. In 2008, coverage with meningococcal conjugate vaccine was 41.8% among adolescents aged 13--17 years in the United States.
Alternate Text: The figure above shows the incidence of meningococcal disease, by year, in the United States from 1978–2008. In 2008, coverage with meningococcal conjugate vaccine was 41.8% among adolescents aged 13–17 years in the United States.
Mumps. Incidence,* by year --- United states, 1983--2008
* Per 100,000 population.
Mumps vaccine was licensed in 1967. The widespread use of a second dose of mumps vaccine in 1990 was followed by historically low morbidity until 2006, when the United States experienced the largest mumps outbreak in two decades. The 2006 outbreak of more than 6,000 cases affected primarily college students aged 18--24 years in the Midwest. As a result, the Advisory Committee on Immunization Practices updated its vaccination recommendations, and the Council of State and Territorial Epidemiologists updated its case definition.
Alternate Text: The figure above presents the incidence of mumps, by year, in the United States from 1983–2008. The widespread use of a second dose of mumps vaccine in 1990 was followed by historically low morbidity until 2006, when the United States experienced the largest mumps outbreak in two decades. The 2006 outbreak of more than 6,000 cases affected primarily college students aged 18–24 years in the Midwest.
PERTUSSIS. Incidence,* by year --- United States, 1978--2008
* Per 100,000 population.
Although the incidence of reported pertussis is substantially lower than the peak in 2004, incidence increased slightly during 2007--2008, and continues to remain higher than in the 1990s.
Alternate Text: The figure above shows the incidence of pertussis, by year, in the United States from 1978–2008. Incidence increased during 2007–2008 and remains higher than the 1990s.
PERTUSSIS. Number of reported cases,* by age group --- United States, 2008
* Of 13,278 cases, age was reported unknown for 671 persons.
Infants, especially those who are undervaccinated, are at increased risk for complicated infections and death from pertussis. Immunity to pertussis is thought to wane approximately 5--10 years after completion of childhood vaccination. A second peak in the number of reported cases is observed among school-aged children and adolescents. The contribution of cases in children aged 5--9 years appears to be increasing compared with previous years.
Alternate Text: The figure above presents the number of reported cases of pertussis, by age group, in the United States in 2008. The majority of cases were reported in the 5–9 and 10–14 age groups.
Q Fever, acUTE AND CHRONIC. Number of reported cases --- United States and U.S. territories, 2008
* Number of Q fever acute cases/Q fever chronic cases. Numbers displayed with no forward slash are Q fever acute cases.
Q fever, caused by Coxiella burnetii, is reported throughout the United States. Human cases occur as a result of human interaction with livestock, especially sheep, goats, and cattle. Although relatively few human cases are reported annually, the disease is believed to be substantially underreported because of its nonspecific presentation and the subsequent failure to suspect infection and request appropriate diagnostic tests.
Alternate Text: The figure above shows the number of reported cases for Q fever (acute and chronic) in the United States and U.S. territories in 2008. The majority of cases were reported in Texas and California.
Rabies, Animal. Number of reported cases among wild and domestic animals,* by year --- United States and Puerto Rico, 1978--2008
* Data from the National Center for Emerging and Zoonotic Infectious Diseases.
† In thousands.
Reported periods of resurgence and decline of rabies cases result primarily from cyclic reemergence. However, the proportion of rabid animals among those tested has demonstrated an overall negative trend from 6.1% rabid in 2006 to 5.6% rabid in 2008. Despite increases in diagnostic testing and the subsequent increase in reported number of rabid bats, the raccoon rabies virus variant continues to be responsible for more than 75% of all terrestrial rabies cases reported in the United States.
Alternate Text: The figure above presents the number of reported cases among wild and domestic animals, by year, in the United States and Puerto Rico from 1978–2008. The proportion of rabid animals among those tested has demonstrated an overall negative trend from 6.1% rabid in 2006 to 5.6% rabid in 2008.
Rocky Mountain Spotted Fever. Number of reported cases, by county --- United States, 2008
Rocky Mountain spotted fever, caused by Rickettsia rickettsii, is reported throughout much of the United States, reflecting the widespread ranges of the primary tick vectors responsible for transmission (primarily Dermacentor variabilis in the East and Dermacentor andersonii in the West, but also Rhipicephalus sanguineus in some newly recognized focal areas).
Alternate Text: The figure above shows the number of reported cases of Rocky Mountain spotted fever, by county, in the United States in 2008. Cases are reported throughout the United States reflecting the widespread ranges of the primary tick vectors responsible for transmission (primarily Dermacentor variabilis in the East and Dermacentor andersonii in the West).
Rubella. Incidence,* by year --- United States, 1978--2008
* Per 100,000 population.
Rubella vaccine was licensed in 1969. Evidence suggests that rubella is no longer endemic in the United States.
Alternate Text: The figure above presents the incidence of rubella, by year, in the United States from 1978–2008. Rubella is no longer endemic in the United States.
Salmonellosis and Shigellosis. Number* of reported cases, by year --- United States, 1978--2008
* In thousands.
Rates of salmonellosis have remained relatively stable during the past two decades. Typhimurium, Enteritidis, and Newport are the most commonly reported Salmonella serotypes.
Alternate Text: The figure above shows the number of reported cases of salmonellosis and shigellosis, by year, in the United States from 1978–2008. Rates of salmonellosis have been steady for the past two decades.
Shiga toxin-producing Escherichia coli(STEC). Number of reported cases --- United States and U.S. territories, 2008
Escherichia coli O157:H7 is the serotype of Shiga toxin-producing E. coli (STEC) isolated most commonly from ill persons. Other serotypes of E. coli also produce shiga toxin and can cause diarrhea and hemolytic uremic syndrome. E. coli O157:H7 has been nationally notifiable since 1994. National surveillance for all STEC, under the name enterohemorrhagic E. coli (EHEC), began in 2001. In 2008, cases continued to be reported from all regions of the country.
Alternate Text: The figure above presents the number of reported cases of shiga toxin-producing eschericha coli in the United States and U.S. territories in 2008. Cases were reported from all regions of the country.
Syphilis, Congenital. Incidence* among infants aged <1 year --- United States, 1978--2008
* Per 100,000 live births.
Following a decline in the incidence of congenital syphilis since 1991, overall congenital syphilis rates remained the same from 2007 to 2008, 10.1 cases per 100,000 live births.
Alternate Text: The figure above shows the incidence among infants aged <1 year for congential syphilis in the United States from 1978–2008. Rates have declined since 1991 and have remained the same from 2007–2008.
Syphilis, Primary and Secondary. Incidence* --- United States and U.S. territories, 2008
* Per 100,000 population.
In 2008, the primary and secondary syphilis rate in the United States and territories (Guam, Puerto Rico, and Virgin Islands) was 4.5 cases per 100,000 population.
Alternate Text: The figure above presents incidence for primary and secondary syphilis in the United States and U.S. territories in 2008. The majority of cases were reported in the south and western states.
Syphilis, Primary and Secondary. Incidence*, by sex --- United States, 1993--2008
* Per 100,000 population.
During 2007--2008, the incidence of primary and secondary syphilis in the United States increased from 3.8 to 4.5 cases (women: from 1.1 to 1.5; men: from 6.6 to 7.6) per 100,000 population.
Alternate Text: The figure above shows incidence of primary and secondary syphilis, by sex, from 1993–2008. Incidence for men has increased every year since 2001.
Syphilis, Primary and Secondary. Incidence,* by race/ethnicity --- United States, 1993--2008
* Per 100,000 population.
† Y-axis is log scale.
During 2007--2008, incidence of primary and secondary syphilis increased among all races/ethnicities except American Indian/Alaska Natives. Incidence per 100,000 population increased from 13.8 to 17.3 among non-Hispanic blacks; from 4.2 to 4.7 among Hispanics; from 1.2 to 1.5 among Asian/Pacific Islanders; from 2.0 to 2.2 among non-Hispanic whites; and decreased from 3.4 to 2.3 among American Indian/Alaska Natives.
Alternate Text: The figure above presents incidence of primary and secondary syphilis, by race/ethnicity in the United States from 1993–2008. Incidence of primary and secondary syphilis increased among all races/ethnicities except American Indian/Alaska Natives during 2007–2008.
Trichinellosis. Number of reported cases, by year --- United States, 1978--2008
In 2008, a total of 39 cases of trichinellosis were reported to CDC, the most since 1992 when 41 cases were reported. An outbreak of trichinellosis occurred among attendees of a cultural celebration in northern California in which raw and undercooked bear meat was the implicated meat product; this outbreak accounted for 30 of the cases. Of the remaining nine cases, the source of infection was unknown in seven cases and commercial pork was implicated in two. Consumption of raw and undercooked bear meat continues to be the most frequent cause of reported human trichinellosis in the United States. Prevention strategies should continue to address risk from consumption of raw or undercooked pork and wild game meat, especially bear.
Alternate Text: The figure shows the number of reported cases of trichinellosis, by year, in the United States from 1978–2008. Thirty nine cases were reported in 2008, the most since 1992 when 41 cases were reported.
Tuberculosis. Incidence* --- United States and U.S. territories, 2008
* Per 100,000 population.
Thirty-one states had a rate of ≤3.5 TB cases per 100,000 in 2008, the interim goal for the year 2000 established by the Advisory Council for the Elimination of Tuberculosis. Ten states, New York City, and Washington, DC reported a rate above the national average in 2008.
Alternate Text: The figure presents the incidence of tuberculosis in the United States and U.S. territories in 2008. Ten states, New York City, and Washington, DC, reported a rate above the national average in 2008.
Tuberculosis. Number of reported cases among U.S.-born and foreign-born persons,* by year --- United States, 1998--2008
* For 91 cases, origin of patients was unknown
† In thousands
The number of TB cases occurring among the foreign-born has remained fairly constant during 1998--2008. The percentage of U.S. TB cases among the foreign-born has increased from 42% in 1998 to 59% in 2008.
Alternate Text: The figure shows the number of reported cases of tuberculosis among U.S.-born and foreign-born persons, by year, in the United States from 1998–2008. The percentage of U.S. tuberculosis cases among foreign-born increased from 42% in 1998 to 59% in 2008.
Tuberculosis. Incidence,* by race/ethnicity --- United States, 1998--2008
* Per 100,000 population.
From 1998 to 2008, case rates in Asian / Pacific Islanders declined by 25%. All other racial and ethnic groups declined by at least 35% during this period. Since 2003, Asian only and Native Hawaiian and other Pacific Islander have been reported separately but were merged for this graph for continuity in reporting trends.
Alternate Text: The figure presents the incidence of tuberculosis by race/ethnicity in the United States from 1998–2008. During this period, case rates for Asian/Pacific Islanders declined 25%; all other groups declined by at ≥35%.
Tularemia. Number of reported cases --- United States and U.S. territories, 2008
Historically, tularemia has been reported from all states except Hawaii. To define the geographic distribution of Francisella tularensis subspecies, CDC requests that state public health laboratories forward isolates to the CDC laboratory in Fort Collins, Colorado.
Alternate Text: The figure shows the number of reported cases of tularemia in the United States and U.S. territories in 2008. The majority of cases were reported in Missouri and Massachusetts.
Typhoid fever. Number of reported cases, by year --- United States, 1978--2008
Typhoid fever in the United States is primarily a disease of travelers, for whom vaccination against typhoid fever is recommended. Emerging resistance to fluoroquinolone antimicrobial agents has complicated the clinical management of cases of typhoid and paratyphoid fever.
Alternate Text: The figure presents the number of reported cases of typhoid fever, by year, in the United States from 1978–2008. The number of cases has increased every year since 2005
Varicella (ChickenPox). Number of reported cases --- Illinois, Michigan, Texas, and West Virginia*, 1992--2008
* Source: CDC. National Center for Immunization and Respiratory Diseases.
† In thousands.
In four states (Michigan, Illinois, Texas, and West Virginia), the number of cases reported in 2008 was 24% lower than 2007 and 85% less than the number reported during the prevaccine years 1993--1995.
Alternate Text: The figure shows the number of reported cases of varicella (chickenpox) in Illinois, Michigan, Texas, and West Virginia from 1992–2008. The number of cases in the four states was 24% lower than 2007.
Vibriosis. Number of reported cases --- United States and U.S. territories, 2008
Infections caused by noncholera Vibrio organisms became nationally notifiable in January 2007. Infections are acquired through consumption of contaminated seafood, particularly oysters, or by contact of broken skin with salt water containing Vibrio organisms.
Alternate Text: The figure presents the number of reported cases for vibriosis in the United States and U.S. territories in 2008. The majority of cases were reported in California, Florida, and Texas.
PART 3
Historical Summaries of Notifiable Diseases in the United States, 1977--2008
Abbreviations and Symbols Used in Tables
NA Data not available.
--- No reported cases.
Notes: Rates <0.01 after rounding are listed as 0.
Data in the MMWR Summary of Notifiable Diseases --- United States, 2008 might not match data in other CDC surveillance reports because of differences in the timing of reports, the source of the data, and the use of different case definitions.
TABLE 7. Reported incidence* of notifiable diseases --- United States, 1998--2008
Disease
1998
1999
2000
2001
2002
2003
2004
2005
2006
2007
2008
AIDS†
7.21
16.66
14.95
14.88
15.29
15.36
15.28
14.00
12.87
12.53
13.00
Anthrax
---
---
0
0.01
0
---
---
---
0
0
0
Botulism, total (includes wound and unspecified)
0.04
0.06
0.05
0.06
0.03
0.01
0.02
0.01
0.02
0.05
0.05
foodborne
0.01
0.01
0.01
0.01
0
0.01
0.01
0.01
0.01
0.01
0.01
Brucellosis
0.03
0.03
0.03
0.05
0.04
0.04
0.04
0.04
0.04
0.04
0.03
Chancroid
0.07
0.06
0.03
0.01
0.02
0.02
0
0.01
0.01
0.01
0.01
Chlamydia trachomatis infections
236.57
254.10
257.76
278.32
296.55
304.71
319.61
332.51
347.80
370.20
401.34
Cholera
0.01
0
0
0
0
0
0
0
0
0
0
Coccidioidomycosis
0.99
3.58
4.69
6.71
3.03
2.57
4.14
6.24
6.79
14.39
7.76
Cryptosporidiosis
1.61
0.92
1.17
1.34
1.07
1.22
1.23
1.93
2.05
3.73
3.02
Cyclosporiasis
§
0.07
0.03
0.07
0.06
0.03
0.14
0.24
0.06
0.04
0.05
Diphtheria
0
0
0
0
0
0
---
---
---
---
---
Domestic arboviral
California serogroup virus
neuroinvasive
---
---
---
---
---
---
---
0.02
0.02
0.02
0.02
nonneuroinvasive
§
§
§
§
§
§
§
0
0
0
0
Eastern equine encephalitis virus
neuroinvasive
---
---
---
---
---
---
---
0
0
0
0
nonneuroinvasive
§
§
§
§
§
§
§
0
0
0
0
Powassan virus
neuroinvasive
---
---
---
---
---
---
---
0
0
0
0
nonneuroinvasive
§
§
§
§
§
§
§
0
0
0
0
St. Louis encephalitis virus
neuroinvasive
---
---
---
---
---
---
---
0
0
0
0
nonneuroinvasive
§
§
§
§
§
§
§
0
0
0
0
West Nile virus
neuroinvasive
---
---
---
---
---
---
---
0.45
0.50
0.41
0.23
nonneuroinvasive
§
§
§
§
§
§
§
0.58
0.94
0.80
0.22
Western equine encephalitis virus
neuroinvasive
---
---
---
---
---
---
---
---
---
---
---
nonneuroinvasive
§
§
§
§
§
§
§
---
---
---
---
Ehrlichiosis
human granulocytic (HGE)
0.16
0.14
0.15
0.10
0.18
0.13
0.20
0.28
0.23
0.31
¶
human monocytic (HME)
0.03
0.06
0.09
0.05
0.08
0.11
0.12
0.18
0.20
0.30
¶
human (other and unspecified)**
---
---
---
---
---
---
---
0.04
0.08
0.12
¶
Ehrlichiosis/Anaplasmosis
Ehrlichia chaffeensis
§
§
§
§
§
§
§
§
§
§
0.35
Ehrlichia ewingii
§
§
§
§
§
§
§
§
§
§
0
Anaplasma phagocytophilum
§
§
§
§
§
§
§
§
§
§
0.43
Undetermined
§
§
§
§
§
§
§
§
§
§
0.06
Encephalitis/meningitis, arboviral††
California serogroup virus
0.04
0.03
0.04
0.05
0.06
0.06
0
††
††
††
††
Eastern equine virus
0
0
0
0
0
0
0
††
††
††
††
Powassan virus
§
§
§
§
0
0
0
††
††
††
††
St. Louis virus
0.01
0
0
0.03
0.01
0.01
0
††
††
††
††
West Nile virus
§
§
§
§
1.01
1.00
0.43
††
††
††
††
Western equine
0
0
0
0
0
0
---
††
††
††
††
Enterohemorrhagic Escherichia coli
O157:H7
1.28
1.77
1.74
1.22
1.36
0.93
0.87
0.89
§
§
§
non-O157
§
§
§
0.19
0.08
0.09
0.13
0.19
§
§
§
not serogrouped
§
§
§
0.06
0.02
0.05
0.13
0.16
§
§
§
Giardiasis
§
§
§
§
8.06
6.84
8.35
7.82
7.28
7.66
7.41
Gonorrhea
132.88
133.20
131.65
128.53
125.03
116.37
113.52
115.64
120.90
118.90
111.64
Haemophilus influenzae, invasive disease
all ages, serotypes
0.44
0.48
0.51
0.57
0.62
0.70
0.72
0.78
0.82
0.85
0.96
age <5 yrs
serotype b
§
§
§
§
0.18
0.16
0.03
0.04
0.14
0.11
0.14
nonserotype b
§
§
§
§
0.75
0.59
0.04
0.67
0.86
0.97
1.18
unknown serotype
§
§
§
§
0.80
1.15
0.97
1.08
0.88
0.88
0.79
Hansen disease (Leprosy)
0.05
0.04
0.04
0.03
0.04
0.03
0.04
0.03
0.03
0.04
0.03
Hantavirus pulmonary syndrome
§
§
0.02
0
0.01
0.01
0.01
0.01
0.01
0.01
0.01
Hemolytic uremic syndrome postdiarrheal
§
§
0.10
0.08
0.08
0.06
0.07
0.08
0.11
0.10
0.12
Hepatitis, viral, acute
A
8.59
6.25
4.91
3.77
3.13
2.66
1.95
1.53
1.21
1.00
0.86
B
3.80
2.82
2.95
2.79
2.84
2.61
2.14
1.78
1.62
1.51
1.34
C
1.30
1.14
1.17
1.41
0.65
0.38
0.31
0.23
0.26
0.28
0.29
Influenza-associated pediatric mortality
§
§
§
§
§
§
§
0.02
0.07
0.10
0.12
Legionellosis
0.51
0.41
0.42
0.42
0.47
0.78
0.71
0.78
0.96
0.91
1.05
See footnotes on next page.
TABLE 7. (Continued) Reported incidence* of notifiable diseases --- United States, 1998--2008
Disease
1998
1999
2000
2001
2002
2003
2004
2005
2006
2007
2008
Listeriosis
§
0.31
0.29
0.22
0.24
0.24
0.32
0.31
0.30
0.27
0.25
Lyme disease, total§§
6.39
5.99
6.53
6.05
8.44
7.39
6.84
7.94
6.75
9.21
11.67
confirmed
§§
§§
§§
§§
§§
§§
§§
§§
§§
§§
9.59
probable
§§
§§
§§
§§
§§
§§
§§
§§
§§
§§
2.08
Malaria
0.60
0.61
0.57
0.55
0.51
0.49
0.51
0.51
0.50
0.47
0.42
Measles
0.04
0.04
0.03
0.04
0.02
0.02
0.01
0.02
0.02
0.01
0.05
Meningococcal disease, invasive
all serogroups
1.01
0.92
0.83
0.83
0.64
0.61
0.47
0.42
0.40
0.36
0.39
serogroup A,C,Y, and W-135
¶¶
¶¶
¶¶
¶¶
¶¶
¶¶
¶¶
0.10
0.11
0.11
0.11
serogroup B
¶¶
¶¶
¶¶
¶¶
¶¶
¶¶
¶¶
0.05
0.07
0.06
0.06
other serogroup
¶¶
¶¶
¶¶
¶¶
¶¶
¶¶
¶¶
0.01
0.01
0.01
0.01
serogroup unknown
¶¶
¶¶
¶¶
¶¶
¶¶
¶¶
¶¶
0.26
0.22
0.18
0.20
Mumps
0.25
0.14
0.13
0.10
0.10
0.08
0.09
0.11
2.22
0.27
0.15
Novel influenza A virus infections
§
§
§
§
§
§
§
§
§
0
0
Pertussis
2.74
2.67
2.88
2.69
3.47
4.04
8.88
8.72
5.27
3.49
4.40
Plague
0
0
0
0
0
0
0
0
0.01
0
0
Poliomyelitis, paralytic
0.01
0
0
0
0
0
0
0
0
---
---
Poliovirus infection, nonparalytic
§
§
§
§
§
§
§
§
§
---
---
Psittacosis
0.02
0.01
0.01
0.01
0.01
0
0
0.01
0.01
0
0
Q Fever***
§
0
0.01
0.01
0.02
0.02
0.03
0.05
0.06
0.06
0.04
acute
***
***
***
***
***
***
***
***
***
***
0.04
chronic
***
***
***
***
***
***
***
***
***
***
0
Rabies, human
0
0
0
0
0
0
0
0
0
0
0
Rocky Mountain spotted fever, total†††
0.14
0.21
0.18
0.25
0.39
0.38
0.60
0.66
0.80
0.77
0.85
confirmed
†††
†††
†††
†††
†††
†††
†††
†††
†††
†††
0.06
probable
†††
†††
†††
†††
†††
†††
†††
†††
†††
†††
0.78
Rubella
0.13
0.21
0.06
0.01
0.01
0
0
0
0
0
0.01
Rubella, congenital syndrome
0
0
0
0
0
0
0
0
0
---
---
Salmonellosis
16.17
14.89
14.51
14.39
15.73
15.16
14.47
15.43
15.45
16.03
16.92
SARS-CoV§§§
§
§
§
§
§
0
---
---
---
---
---
Shigellosis
8.74
6.43
8.41
7.19
8.37
8.19
4.99
5.51
5.23
6.60
7.50
Shiga toxin-producing E. coli (STEC)
§
§
§
§
§
§
§
§
1.71
1.62
1.76
Smallpox
§
§
§
§
§
§
---
---
---
---
---
Streptococcal disease, invasive, group A
0.83
0.87
1.45
1.60
1.69
2.04
1.82
2.00
2.24
1.89
2.30
Streptococcal, toxic-shock syndrome
0.02
0.02
0.04
0.04
0.05
0.06
0.06
0.07
0.06
0.06
0.07
Streptococcus pneumoniae, invasive disease
drug resistant, all ages
1.44
2.39
2.77
2.11
1.14
0.99
1.49
1.42
2.19
1.49
1.60
age <5 yrs
---
---
---
---
---
---
---
---
---
3.73
3.51
non-drug resistant, age <5 yrs
§
§
§
1.03
3.62
8.86
8.22
8.21
11.93
13.59
13.36
Syphilis, total, all stages
14.19
13.07
11.58
11.45
11.68
11.90
11.94
11.33
12.46
13.67
15.34
congenital (age <1 yr)
21.39
14.62
14.29
12.52
11.44
10.56
9.12
8.24
9.07
10.46
10.12
primary and secondary
2.61
2.50
2.19
2.17
2.44
2.49
2.71
2.97
3.29
3.83
4.48
Tetanus
0.02
0.01
0.01
0.01
0.01
0.01
0.01
0.01
0.01
0.01
0.01
Toxic-shock syndrome
0.06
0.05
0.06
0.05
0.05
0.05
0.04
0.04
0.05
0.04
0.03
Trichinellosis
0.01
0
0.01
0.01
0.01
0
0
0.01
0.01
0
0.01
Tuberculosis
6.79
6.43
6.01
5.68
5.36
5.17
5.09
4.80
4.65
4.44
4.28
Tularemia
§
§
0.06
0.05
0.03
0.04
0.05
0.05
0.03
0.05
0.04
Tyhoid fever
0.14
0.13
0.14
0.13
0.11
0.12
0.11
0.11
0.12
0.14
0.15
Vancomycin-intermediate Staphylococcus aureus
§
§
§
§
§
§
---
0
0
0.02
0.03
Vancomycin-resistant Staphylococcus aureus
§
§
§
§
§
§
0
0
0
0
0
Varicella (chickenpox)¶¶¶
70.28
44.56
26.18
19.51
10.27
7.27
18.41
19.64
28.65
18.68
13.56
Vibriosis
§
§
§
§
§
§
§
§
§
0.25
0.24
Yellow fever
---
0
---
0
0
---
---
---
---
---
---
* Per 100,000 population.
† Acquired immunodeficiency syndrome.
§ Not nationally notifiable.
¶ As of January 1, 2008, these categories were replaced with codes for Anaplasma phagocytophilum. Refer to Ehrlichiosis/Anaplasmosis.
** Data for ehrlichiosis attributable to other or unspecified agents were being withheld from publication pending the outcome of discussions concerning the reclassification of certain Ehrlichia species, which would probably affect how data in this category were reported.
†† See also "Domestic arboviral" disease incidence rates. In 2005, the domestic arboviral disease surveillance case definitions and categories were revised. The nationally notifiable arboviral encephalitis and meningitis conditions continued to be nationally notifiable in 2005 and 2006, but were included under the category of arboviral neuroinvasive disease. In addition, in 2005, nonneuroinvasive domestic arboviral disesases for the six domestic arboviruses listed above were included to the list of nationally notifiable diseases.
§§ National surveillance case definition revised in 2008; probable cases not previously reported.
¶¶ To help public health specialists monitor the impact of the new meningococcal conjugate vaccine (Menactra(r), licensed in the United States in January 2005), the data display for meningococcal disease was modified to differentiate the fraction of the disease that is vaccine preventable (serogroups A,C,Y, and W-135) from the non--preventable fraction of disease (serogroup B and others).
*** In 2008, Q fever acute and chronic reporting categories were recognized as a result of revision to the Q fever case definition. Before that time, case counts were not differentiated relative to acute and chronic Q fever cases.
††† Revision of national surveillance case definition distinguishing between confirmed and probable cases; total counts include six case reports with unknown case status.
§§§ Severe acute respiratory syndrome-associated coronavirus disease.
¶¶¶ Varicella became a nationally notifiable disease in 2003.
TABLE 8. Reported cases of notifiable diseases --- United States, 2001--2008
TABLE 8. (Continued) Reported cases of notifiable diseases --- United States, 2001--2008
Disease
2001
2002
2003
2004
2005
2006
2007
2008
Giardiasis
**
21,206
19,709
20,636
19,733
18,953
19,417
18,908
Gonorrhea§
361,705
351,852
335,104
330,132
339,593
358,366
355,991
336,742
Haemophilus influenzae, invasive disease
all ages, serotypes
1,597
1,743
2,013
2,085
2,304
2,496
2,541
2,886
age <5 yrs
serotype b
**
34
32
19
9
29
22
30
nonserotype b
**
144
117
135
135
175
199
244
unknown serotype
**
153
227
177
217
179
180
163
Hansen disease (Leprosy)
79
96
95
105
87
66
101
80
Hantavirus pulmonary syndrome
8
19
26
24
26
40
32
18
Hemolytic uremic syndrome postdiarrheal
202
216
178
200
221
288
292
330
Hepatitis, viral, acute***
A
10,609
8,795
7,653
5,683
4,488
3,579
2,979
2,585
B
7,843
7,996
7,526
6,212
5,119
4,713
4,519
4,033
C
3,976
1,835
1,102
720
652
766
845
877
Influenza-associated pediatric mortality
**
**
**
**
45
43
77
90
Legionellosis
1,168
1,321
2,232
2,093
2,301
2,834
2,716
3,181
Listeriosis
613
665
696
753
896
884
808
759
Lyme disease, total†††
17,029
23,763
21,273
19,804
23,305
19,931
27,444
35,198
confirmed
†††
†††
†††
†††
†††
†††
†††
28,921
probable
†††
†††
†††
†††
†††
†††
†††
6,277
Malaria
1,544
1,430
1,402
1,458
1,494
1,474
1,408
1,255
Measles
116
44
56
37
66
55
43
140
Meningococcal disease, invasive§§§
all serogroups
2,333
1,814
1,756
1,361
1,245
1,194
1,077
1,172
serogroup A,C,Y, and W-135
---
---
---
---
297
318
325
330
serogroup B
---
---
---
---
156
193
167
188
other serogroup
---
---
---
---
27
32
35
38
serogroup unknown
---
---
---
---
765
651
550
616
Mumps
266
270
231
258
314
6,584
800
454
Novel influenza A virus infections
**
**
**
**
**
**
4
2
Pertussis
7,580
9,771
11,647
25,827
25,616
15,632
10,454
13,278
Plague
2
2
1
3
8
17
7
3
Poliomyelitis, paralytic¶¶¶
---
---
---
---
1
---
---
---
Poliovirus infection, nonparalytic
---
---
---
---
---
---
---
---
Psittacosis
25
18
12
12
16
21
12
8
Q Fever****
26
61
71
70
136
169
171
120
acute
****
****
****
****
****
****
****
106
chronic
****
****
****
****
****
****
****
14
Rabies
animal
7,150
7,609
6,846
6,345
5,915
5,534
5,862
4,196
human
1
3
2
7
2
3
1
2
Rocky Mountain spotted fever, total††††
695
1,104
1,091
1,713
1,936
2,288
2,221
2,563
confirmed
††††
††††
††††
††††
††††
††††
††††
190
probable
††††
††††
††††
††††
††††
††††
††††
2,367
Rubella
23
18
7
10
11
11
12
16
Rubella, congenital syndrome
3
1
1
---
1
1
---
---
Salmonellosis
40,495
44,264
43,657
42,197
45,322
45,808
47,995
51,040
SARS-CoV§§§§
**
**
8
---
---
---
---
---
Shiga toxin-producing Escherichia coli (STEC)
**
**
**
**
**
4,432
4,847
5,309
Shigellosis
20,221
23,541
23,581
14,627
16,168
15,503
19,758
22,625
See footnote on page 83.
TABLE 8. (Continued) Reported cases of notifiable diseases --- United States, 2001--2008
Disease
2001
2002
2003
2004
2005
2006
2007
2008
Streptococcal disease, invasive, group A
3,750
4,720
5,872
4,395
4,715
5,407
5,294
5,674
Streptococcal, toxic-shock syndrome
77
118
161
132
129
125
132
157
Streptococcus pneumoniae, invasive disease
drug resistant, all ages
2,896
2,546
2,356
2,590
2,996
3,308
3,329
3,448
age <5 yrs
---
---
---
---
---
---
563
532
non-drug resistant, age <5 yrs
498
513
845
1,162
1,495
1,861
2,032
1,998
Syphilis, all stages§
32,221
32,871
34,270
33,401
33,278
36,935
40,920
46,277
congenital (age <1 yr)
504
460
432
375
339
382
430
431
primary and secondary
6,103
6,862
7,177
7,980
8,724
9,756
11,466
13,500
Tetanus
37
25
20
34
27
41
28
19
Toxic-shock syndrome
127
109
133
95
90
101
92
71
Trichinellosis
22
14
6
5
16
15
5
39
Tuberculosis¶¶¶¶
15,989
15,075
14,874
14,517
14,097
13,779
13,299
12,904
Tularemia
129
90
129
134
154
95
137
123
Tyhoid fever
368
321
356
322
324
353
434
449
Vancomycin-intermediate Staphylococcus aureus
**
**
**
---
3
6
37
63
Vancomycin-resistant Staphylococcus aureus
**
**
**
1
2
1
2
---
Varicella (chickenpox)*****
22,536
22,841
20,948
32,931
32,242
48,445
40,146
30,386
Varicella (deaths)††††††
**
9
2
9
3
---
6
2
Vibriosis (noncholera Vibrio species infections)
**
**
**
**
**
**
549
588
Yellow fever§§§§§
---
1
---
---
---
---
---
---
* Acquired immunodeficiency syndrome (AIDS)
† The total number of AIDS cases includes all cases reported to the Division of HIV/AIDS Prevention, National Center for HIV/AIDS, Viral Hepatitis, STD, and TB Prevention (NCHHSTP), through December 31, 2008.
§ Cases were reported to the Division of STD Prevention, NCHHSTP, as of May 8, 2009.
¶ Totals reported to the Division of Vector--Borne Diseases, National Center for Emerging and Zoonotic Infectious Diseases (ArboNET Surveillance), as of May 1, 2009.
** Not nationally notifiable.
†† As of January 1, 2008, these categories were replaced with codes for Anaplasma phagocytophilum. Refer to Ehrlichiosis/Anaplasmosis.
§§ Data for ehrlichiosis attributable to other or unspecified agents were being withheld from publication pending the outcome of discussions concerning the reclassification of certain Ehrlichia species, which would probably affect how data in this category were reported.
¶¶ See also "Domestic arboviral" disease incidence rates. In 2005, the domestic arboviral disease surveillance case definitions and categories were revised. The nationally notifiable arboviral encephalitis and meningitis conditions continued to be nationally notifiable in 2005 and 2006, but were included under the category of arboviral neuroinvasive disease. In addition, in 2005, nonneuroinvasive domestic arboviral disesases for the six domestic arboviruses listed above were added to the list of nationally notifiable diseases.
** The anti--hepatitis C virus antibody test became available May 1990. Data on hepatitis B chronic, hepatitis B, perinatal infection, and hepatitis C, virus infection (past or present) are not included because they are undergoing data quality review.
††† National surveillance case definition revised in 2008; probable cases not previously reported.
§§§ To help public health specialists monitor the impact of the new meningococcal conjugate vaccine (Menactra(r), licensed in the United States in January 2005), the data display for meningococcal disease was modified to differentiate the fraction of the disease that is potentially vaccine preventable (serogroups A, C, Y, and W-135) from the nonvaccine-preventable fraction of disease (serogroup B and others).
¶¶¶ Cases of vaccine-associated paralytic poliomyelitis caused by polio vaccine virus. Numbers might not reflect changes based on retrospective case evaluations or late reports (CDC. Poliomyelitis---United States, 1975--1984. MMWR 1986;35:180--2).
**** In 2008, Q fever acute and chronic reporting categories were recognized as a result of revision to the Q fever case definition. Before that time, case counts were not differentiated relative to acute and chronic Q fever cases.
†††† Revision of national surveillance case definition distinguishing between confirmed and probable cases; total counts include six case reports with unknown case status.
§§§§ Severe acute respiratory syndrome (SARS)-associated coronavirus disease. The total number of SARS-CoV cases includes all cases reported to the Division of Viral Diseases, Coordinating Center for Infectious Diseases.
¶¶¶¶ Cases were reported to the Division of TB Elimination, NCHHSTP, as of May 15, 2009.
***** Varicella was taken off the nationally notifiable disease list in 1981. Varicella again became nationally notifiable in 2003.
††††† Death counts provided by the Division of Viral Diseases, National Center for Immunization and Respiratory Diseases, as of June 30, 2009.
§§§§§ The last indigenous case of yellow fever was reported in 1911; all other cases since 1911 have been imported.
TABLE 9. Reported cases of notifiable diseases --- United States, 1993--2000
Disease
1993
1994
1995
1996
1997
1998
1999
2000
AIDS*
103,691
78,279
71,547
66,885
58,492
46,521
45,104
40,758
Amebiasis
2,970
2,983
†
†
†
†
†
†
Anthrax
---
---
---
---
---
---
---
1
Aseptic meningitis
12,848
8,932
†
†
†
†
†
†
Botulism, total (including wound and unspecified)
97
143
97
119
132
116
154
138
foodborne
27
50
24
25
31
22
23
23
infant
65
85
54
80
79
65
92
93
Brucellosis
120
119
98
112
98
79
82
87
Chancroid§
1,399
773
606
386
243
189
143
78
Chlamydia trachomatis infections§
†
†
477,638
498,884
526,671
604,420
656,721
702,093
Cholera
18
39
23
4
6
17
6
5
Coccidioidomycosis
†
†
1,212
1,697
1,749
2,274
2,826
2,867
Cryptosporidiosis
†
†
2,970
2,827
2,566
3,793
2,361
3,128
Diphtheria
---
2
---
2
4
1
1
1
Encephalitis, primary
919
717
†
†
†
†
†
†
Postinfectious
170
143
†
†
†
†
†
†
Encephalitis/Meningitis
California serogroup virus
†
†
11
123
129
97
70
114
Eastern equine virus
†
†
1
5
14
4
5
3
St. Louis virus
†
†
†
2
13
24
4
2
Western equine virus
†
†
---
2
---
---
1
---
Escherichia coli O157:H7
†
1,420
2,139
2,741
2,555
3,161
4,513
4,528
Gonorrhea§
439,673
418,068
392,848
325,883
324,907
355,642
360,076
358,995
Granuloma inguinale
19
3
†
†
†
†
†
†
Haemophilus influenzae, invasive disease all ages, serotypes
1,419
1,174
1,180
1,170
1,162
1,194
1,309
1,398
Hansen disease (Leprosy)
187
136
144
112
122
108
108
91
Hantavirus pulmonary syndrome
†
†
---
NA
NA
NA
33
41
Hemolytic uremic syndrome, postdiarrheal
†
†
72
97
91
119
181
249
Hepatitis, viral, acute
A
24,238
26,796
31,582
31,032
30,021
23,229
17,047
13,397
B
13,361
12,517
10,805
10,637
10,416
10,258
7,694
8,036
C/non-A, non-B¶
4,786
4,470
4,576
3,716
3,816
3,518
3,111
3,197
unspecified
627
444
†
†
†
†
†
†
Legionellosis
1,280
1,615
1,241
1,198
1,163
1,355
1,108
1,127
Leptospirosis
51
38
†
†
†
†
†
†
Listeriosis
†
†
†
†
†
†
†
755
Lyme disease
8,257
13,043
11,700
16,455
12,801
16,801
16,273
17,730
Lymphogranuloma venereum
285
235
†
†
†
†
†
†
Malaria
1,411
1,229
1,419
1,800
2,001
1,611
1,666
1,560
Measles
312
963
309
508
138
100
100
86
See footnote on next page.
TABLE 9. (Continued) Reported cases of notifiable diseases --- United States, 1993--2000
Disease
1993
1994
1995
1996
1997
1998
1999
2000
Meningococcal disease, invasive
2,637
2,886
3,243
3,437
3,308
2,725
2,501
2,256
Mumps
1,692
1,537
906
751
683
666
387
338
Murine typhus fever
25
†
†
†
†
†
†
†
Pertussis
6,586
4,617
5,137
7,796
6,564
7,405
7,288
7,867
Plague
10
17
9
5
4
9
9
6
Poliomyelitis, paralytic
4
8
7
7
6
3
2
---
Psittacosis
60
38
64
42
33
47
16
17
Q Fever
†
†
†
†
†
†
†
21
Rabies
animal
9,377
8,147
7,811
6,982
8,105
7,259
6,730
6,934
human
3
6
5
3
2
1
---
4
Rheumatic fever, acute
112
112
†
†
†
†
†
†
Rocky Mountain spotted fever
456
465
590
831
409
365
579
495
Rubella
192
227
128
238
181
364
267
176
Rubella, congenital syndrome
5
7
6
4
5
7
9
9
Salmonellosis, excluding typhoid fever
41,641
43,323
45,970
45,471
41,901
43,694
40,596
39,574
Shigellosis
32,198
29,769
32,080
25,978
23,117
23,626
17,521
22,922
Streptococcal disease, invasive, Group A
†
†
613
1,445
1,973
2,260
2,667
3,144
Streptococcal toxic-shock syndrome
†
†
10
19
33
58
65
83
Streptococcus pneumoniae, invasive disease drug-resistant, all ages
†
†
309
1,514
1,799
2,823
4,625
4,533
Syphilis, total, all stages§
101,259
81,696
68,953
52,976
46,540
37,977
35,628
31,575
congenital (age <1 yr)
3,420
2,452
1,863
1,282
1,081
843
579
580
primary and secondary
26,498
20,627
16,500
11,387
8,550
6,993
6,657
5,979
Tetanus
48
51
41
36
50
41
40
35
Toxic-shock syndrome
212
192
191
145
157
138
113
135
Trichinellosis
16
32
29
11
13
19
12
16
Tuberculosis**
25,313
24,361
22,860
21,337
19,851
18,361
17,531
16,377
Tularemia
132
96
†
†
†
†
†
142
Typhoid fever
440
441
369
396
365
375
346
377
Varicella††
134,722
151,219
120,624
83,511
98,727
82,455
46,016
27,382
Yellow fever§§
---
---
---
1
---
---
---
---
* Acquired immunodeficiency syndrome.
† Not nationally notifiable.
§ Cases were reported to the Division of STD Prevention, National Center for HIV/AIDS, Viral Hepatitis, STD, and TB Prevention (NCHHSTP).
¶ The ant-hepatitis C virus antibody test became available in May 1990.
** Cases were reported to the Division of TB Elimination, NCHHSTP.
†† Varicella was taken off the nationally notifiable disease list in 1981. Certain states continued to report these cases to CDC.
§§ The last indigenous case of yellow fever was reported in 1911; all other cases since 1911 have been imported.
TABLE 10. Reported cases of notifiable diseases* --- United States, 1985--1992
Disease
1985
1986
1987
1988
1989
1990
1991
1992
AIDS†
8,249
12,932
21,070
31,001
33,722
41,595
43,672
45,472
Amebiasis
4,433
3,532
3,123
2,860
3,217
3,328
2,989
2,942
Anthrax
---
---
1
2
---
---
---
1
Aseptic meningitis
10,619
11,374
11,487
7,234
10,274
11,852
14,526
12,223
Botulism, total (including wound and unspecified)
122
109
82
84
89
92
114
91
foodborne
49
23
17
28
23
23
27
21
infant
70
79
59
50
60
65
81
66
Brucellosis
153
106
129
96
95
82
104
105
Chancroid
2,067
3,756
4,998
5,001
4,692
4,212
3,476
1,886
Cholera
4
23
6
8
---
6
26
103
Diphtheria§
3
---
3
2
3
4
5
4
Encephalitis, primary
1,376
1,302
1,418
882
981
1,341
1,021
774
Postinfectious¶
161
124
121
121
88
105
82
129
Gonorrhea
911,419
900,868
780,905
719,536
733,151
690,169
620,478
501,409
Granuloma inguinale
44
61
22
11
7
97
29
6
Hansen disease (Leprosy)
361
270
238
184
163
198
154
172
Hepatitis, viral, acute
A
23,210
23,430
25,280
28,507
35,821
31,441
24,378
23,112
B
26,611
26,107
25,916
23,177
23,419
21,102
18,003
16,126
C/non-A, non-B**
4,184
3,634
2,999
2,619
2,529
2,553
3,582
6,010
unspecified
5,517
3,940
3,102
2,470
2,306
1,671
1,260
884
Legionellosis
830
980
1,038
1,085
1,190
1,370
1,317
1,339
Leptospirosis
57
41
43
54
93
77
58
54
Lyme disease
††
††
††
††
††
††
††
9,895
Lymphogranuloma venereum
226
396
303
185
189
277
471
302
Malaria
1,049
1,123
944
1,099
1,277
1,292
1,278
1,087
Measles
2,822
6,282
3,655
3,396
18,193
27,786
9,643
2,237
Meningococcal disease, invasive
2,479
2,594
2,930
2,964
2,727
2,451
2,130
2,134
Mumps
2,982
7,790
12,848
4,866
5,712
5,292
4,264
2,572
Murine typhus fever
37
67
49
54
41
50
43
28
Pertussis
3,589
4,195
2,823
3,450
4,157
4,570
2,719
4,083
Plague
17
10
12
15
4
2
11
13
Poliomyelitis, total
8
10
§§
§§
§§
§§
§§
§§
paralytic§§
8
10
9
9
11
6
10
6
Psittacosis
119
224
98
114
116
113
94
92
Rabies
animal
5,565
5,504
4,658
4,651
4,724
4,826
6,910
8,589
human
1
---
1
---
1
1
3
1
Rheumatic fever, acute
90
147
141
158
144
108
127
75
Rocky Mountain spotted fever
714
760
604
609
623
651
628
502
Rubella
630
551
306
225
396
1,125
1,401
160
Rubella, congenital syndrome
---
14
5
6
3
11
47
11
Salmonellosis
65,347
49,984
50,916
48,948
47,812
48,603
48,154
40,912
Shigellosis
17,057
17,138
23,860
30,617
25,010
27,077
23,548
23,931
Syphilis, primary and secondary
27,131
27,883
35,147
40,117
44,540
50,223
42,935
33,973
congenital (age <1 yr)
329
410
480
741
1,837
3,865
4,424
4,067
total, all stages
67,563
68,215
86,545
103,437
110,797
134,255
128,569
112,581
Tetanus
83
64
48
53
53
64
57
45
Toxic-shock syndrome
384
412
372
390
400
322
280
244
Trichinosis
61
39
40
45
30
129
62
41
Tuberculosis
22,201
22,768
22,517
22,436
23,495
25,701
26,283
26,673
Tularemia
177
170
214
201
152
152
193
159
Typhoid fever
402
362
400
436
460
552
501
414
Varicella
178,162
183,243
213,196
192,857
185,441
173,099
147,076
158,364
* No cases of yellow fever were reported during 1985--1992.
† Acquired immunodeficiency syndrome.
§ Cutaneous diphtheria ceased being notifiable nationally after 1979.
¶ Beginning in 1984, data were recorded by date of report to state health departments. Before 1984, data were recorded by onset date.
** The anti-hepatitis C virus antibody test became available in May 1990.
†† Not nationally notifiable.
§§ No cases of paralytic poliomyelitis caused by wild virus have been reported in the United States since 1993.
TABLE 11. Reported cases of notifiable diseases* --- United States, 1977--1984
Disease
1977
1978
1979
1980
1981
1982
1983
1984
AIDS†
§
§
§
§
§
§
§
4,445
Amebiasis
3,044
3,937
4,107
5,271
6,632
7,304
6,658
5,252
Anthrax
--
6
--
1
--
--
--
1
Aseptic meningitis
4,789
6,573
8,754
8,028
9,547
9,680
12,696
8,326
Botulism, total (including wound and unspecified)
129
105
45
89
103
97
133
123
Brucellosis
232
179
215
183
185
173
200
131
Chancroid
455
521
840
788
850
1,392
847
666
Cholera
3
12
1
9
19
--
1
1
Diphtheria
84
76
59
3
5
2
5
1
Encephalitis
primary
1,414
1,351
1,504
1,362
1,492
1,464
1,761
1,257
postinfectious
119
78
84
40
43
36
34
108
Gonorrhea
1,002,219
1,013,436
1,004,058
1,004,029
990,864
960,633
900,435
878,556
Granuloma inguinale
75
72
76
51
66
17
24
30
Hansen disease (Leprosy)
151
168
185
223
256
250
259
290
Hepatitis
A (infectious)
31,153
29,500
30,407
29,087
25,802
23,403
21,532
22,040
B (serum)
16,831
15,016
15,452
19,015
21,152
22,177
24,318
26,115
C/non-A, non-B¶
§
§
§
§
§
§
§
3,871
unspecified
8,639
8,776
10,534
11,894
10,975
8,564
7,149
5,531
Legionellosis
359
761
593
475
408
654
852
750
Leptospirosis
71
110
94
85
82
100
61
40
Lymphogranuloma venereum
348
284
250
199
263
235
335
170
Malaria
547
731
894
2,062
1,388
1,056
813
1,007
Measles
57,345
26,871
13,597
13,506
3,124
1,714
1,497
2,587
Meningococcal disease, invasive
1,828
2,505
2,724
2,840
3,525
3,056
2,736
2,746
Mumps
21,436
16,817
14,225
8,576
4,941
5,270
3,355
3,021
Murine typhus fever
75
46
69
81
61
58
62
53
Pertussis
2,177
2,063
1,623
1,730
1,248
1,895
2,463
2,276
Plague
18
12
13
18
13
19
40
31
Poliomyelitis, total
19
8
22
9
10
12
13
9
paralytic
19
8
22
9
10
12
13
9
Psittacosis
94
140
137
124
136
152
142
172
Rabies
animal
3,130
3,254
5,119
6,421
7,118
6,212
5,878
5,567
human
1
4
4
--
2
--
2
3
Rheumatic fever, acute
1,738
851
629
432
264
137
88
117
Rocky Mountain spotted fever
1,153
1,063
1,070
1,163
1,192
976
1,126
838
Rubella
20,395
18,269
11,795
3,904
2,077
2,325
970
752
Rubella, congenital syndrome
23
30
62
50
19
7
22
5
Salmonellosis
27,850
29,410
33,138
33,715
39,990
40,936
44,250
40,861
Shigellosis
16,052
19,511
20,135
19,041
9,859
18,129
19,719
17,371
Syphilis, total, all stages
64,621
64,875
67,049
68,832
72,799
75,579
74,637
69,888
primary and secondary
20,399
21,656
24,874
27,204
31,266
33,613
32,698
28,607
congenital (age <1 yr)
463
434
332
277
287
259
239
305
Tetanus
87
86
81
95
72
88
91
74
Toxic-shock syndrome
§
§
§
§
§
§
§
482
Trichinosis
143
67
157
131
206
115
45
68
Tuberculosis
30,145
28,521
27,669
27,749
27,373
25,520
23,846
22,255
Tularemia
165
141
196
234
288
275
310
291
Typhoid fever
398
505
528
510
584
425
507
390
Varicella
188,396
154,089
199,081
190,894
200,766
167,423
177,462
221,983
* No cases of yellow fever were reported during 1977--1984.
† Acquired immunodeficiency syndrome.
§ Not nationally notifiable.
¶ The anti--hepatitis C virus antibody test became available in May 1990.
TABLE 12. Number of deaths from selected nationally notifiable infectious diseases --- United States, 2002--2006
ICD-10* cause of death code
No. of deaths
Cause of death
2002
2003
2004
2005
2006
AIDS†
B20-B24
14,095
13,658
13,063
12,543
12,133
Anthrax
A22
0
0
0
0
0
Encephalitis, arboviral
California serogroup virus
A83.5
0
0
0
1
1
Eastern equine encephalitis virus
A83.2
1
1
2
2
2
Powassan virus
A84.8
0
0
0
0
0
St. Louis encephalitis virus
A83.3
3
2
2
1
2
Western equine encephalitis virus
A83.1
0
0
0
0
0
Botulism, foodborne
A05.1
2
6
0
5
3
Brucellosis
A23
1
0
0
2
2
Chancroid
A57
0
0
0
0
0
Chlamydia trachomatis infections
A56
0
0
0
0
0
Cholera
A00
0
0
0
0
0
Coccidioidomycosis
B38
84
73
100
76
110
Cryptosporidiosis
A07.2
1
0
1
2
2
Cyclosporiasis
A07.8
0
0
0
0
0
Diphtheria
A36
0
1
0
0
0
Ehrlichiosis
A79.8
0
1
0
0
0
Giardiasis
A07.1
1
0
1
0
1
Gonoccocal infections
A54
7
6
2
3
3
Haemophilus influenzae
A49.2
7
5
11
4
4
Hansen disease (Leprosy)
A30
2
2
5
1
1
Hantavirus pulmonary syndrome
A98.5
0
0
0
0
8
Hemolytic uremic syndrome, postdiarrheal
D59.3
35
29
27
30
29
Hepatitis A, viral, acute
B15
76
54
58
43
34
Influenza-associated pediatric mortality
J10, J11
25
146
51
61
62
Legionellosis
A48.1
62
98
72
78
91
Listeriosis
A32
32
33
37
31
30
Lyme disease
A69.2, L90.4
6
4
6
7
5
Malaria
B50-B54
12
4
8
6
9
Measles
B05
0
1
0
1
0
Meningococcal disease
A39
161
161
138
123
105
Mumps
B26
1
0
0
0
1
Pertussis
A37
18
11
16
31
9
Plague
A20
0
0
1
1
3
Poliomyelitis
A80
0
0
0
0
0
Psittacosis
A70
0
0
0
0
0
Q fever
A78
0
1
1
2
2
Rabies, human
A82
3
2
3
1
2
Rocky Mountain spotted fever
A77.0
8
9
5
6
4
Rubella
B06
0
0
1
0
0
Rubella congenital syndrome
P35.0
6
4
5
8
2
Salmonellosis
A02
21
43
30
30
34
Shiga toxin-producing Escherichia coli (STEC)
A04.0-A04.4
4
2
4
5
3
Shigellosis
A03
4
2
0
9
3
Smallpox
B03
0
0
0
0
0
Streptococcal disease, invasive, group A
A40.0, A49.1
109
115
121
118
117
Streptococcus pneumoniae, invasive disease (restricted to <5 years of age)
A40.3, B95.3, J13
13
15
13
12
22
Syphilis, total, all stages
A50-A53
41
34
43
47
38
Tetanus
A35
5
4
4
1
4
Toxic-shock syndrome (other than streptococcal)
A48.3
78
71
71
55
57
Trichinellosis
B75
0
0
0
0
1
Tuberculosis
A16-A19
784
711
657
648
652
Tularemia
A21
2
2
1
0
0
Typhoid fever
A01.0
0
0
0
0
0
Varicella
B01
32
16
19
13
18
Yellow fever§
A95
1
0
0
0
0
SOURCE: CDC. CDC WONDER Compressed Mortality files (http://wonder.cdc.gov/mortSQL.html) provided by the National Center for Health Statistics. National Vital Statistics System, 1999-2006. Underlying causes of death are classified according to ICD-10. Data for 2007--2008 are not available. Data are limited by the accuracy of the information regarding the underlying cause of death indicated on death certificates and reported to the National Vital Statistics System.
* World Health Organization. International Statistical Classification of Diseases and Related Health Problems. Tenth Revision, 1992.
† Acquired immunodeficiency syndrome.
§ For one fatality, the cause of death was erroneously reported as yellow fever in the National Center for Health Statistics dataset for 2003. Subsequent investigation has determined that this death did not result from infection with wild-type yellow fever virus, and it is therefore not included in this table.
Use of anthrax vaccine in response to terrorism: supplemental recommendations of the Advisory Committee on Immunization Practices. MMWR 2002;51:1024--6.
Modeling the geographic distribution of Bacillus anthracis, the causative agent of anthrax disease, for the contiguous United States using predictive ecological niche modeling. Am J Trop Med Hyg 2007;77:1103--10.
Anthrax as a biological weapon, 2002: updated recommendations for management. JAMA 2002;287:2236--52.
Conference report on public health and clinical guidelines for anthrax. Emerg Infect Dis 2008;14. Available at http://www.cdc.gov/EID/content/14/4/07-0969.htm.
Botulism
Botulism and Intestinal Botulism. In: DL Heymann, ed. Control of communicable diseases manual, Washington, DC: American Public Health Association Press; 2008.
Clostridial Infections: Botulism and Infant Botulism. In: Pickering LK, Baker CJ, Kimberlin DW, Long SS, eds. The Red Book: 2009 report of the Committee on Infectious Diseases. Elk Grove Village: American Academy of Pediatrics; 2009:259--62. Infant botulism---New York City, 2001--2002. MMWR 2003;52:21--4.
Botulism. Clin Infect Dis 2005;41:1167--73.
Foodborne botulism in the United States, 1999--2000. Emerg Infect Dis 2004;10:1606--12.
Louis ME. Botulism. In: Evans AS, Brachman PS, eds. Bacterial infections of humans. New York, NY: Plenum; 1998:131--53.
Botulism in the United States: a clinical and epidemiologic review. Ann Intern Med 1998;129:221--8.
Botulism surveillance and emergency response: a public health strategy for a global challenge. JAMA 1997;278:433--5.
Chancroid epidemiology in New Orleans men. J Infect Dis 1995;172:446--52.
An investigation of genital ulcers in Jackson, Mississippi, with use of a multiplex polymerase chain reaction assay: high prevalence of chancroid and human immunodeficiency virus infection. J Infect Dis 1998;178:1060--6.
Etiology of genital ulcers and prevalence of human immunodeficiency virus coinfection in 10 US cities. The Genital Ulcer Disease Surveillance Group. J Infect Dis 1998;178:1795
Chlamydia trachomatis, Infection
Sexually transmitted disease surveillance, 2007 Supplement, Chlamydia Prevalence Monitoring Project Annual Report 2007. Atlanta, GA: U.S. Department of Health and Human Services, CDC; 2009. Available at http://www.cdc.gov/std/chlamydia2007.
Gonnorhea and chlamydia in the United States among persons 14 to 39 years of age, 1999 to 2002. Ann Intern Med 2007;147:89--96.
Prevalence of chlamydial and gonococcal infections among young adults in the United States. JAMA 2004;291:2229--36.
Estimates of Chlamydia trachomatis infections among men: United States. Sexually Trans Dis 2007;35: S3--7.
Cholera
Cholera in the United States, 1995--2000: trends at the end of the millennium. J Infect Dis 2001;184:799--802.
Cholera, 2008. Wkly Epidemiol Rec 2009;84:309--24.
Cholera: a new homeland in Africa. Am J Trop Med Hyg 2007;77:705--13.
Severe diarrhea caused by cholera toxin--producing Vibrio cholerae serogroup O75 infections acquired in the southeastern United States. Clin Infect Dis 2008;47:1035--40.
Coccidioidomycosis
Coccidioidomycosis: a review of recent advances. Clin Chest Med 2009;30:241--51.
Approach to the diagnosis of the endemic mycoses. Clin Chest Med 2009;30:379--89.
Coccidioiodal pneumonia, Phoenix, Arizona, USA, 2000--2004. Emerg Infect Dis 2009;15:397--401.
The ongoing saga of U.S. outbreaks of cyclosporiasis associated with imported fresh produce: what Cyclospora cayetanensis has taught us and what we have yet to learn. In: Institute of Medicine. Addressing foodborne threats to health: policies, practices, and global coordination. Washington, DC: The National Academies Press; 2006:85--115, 133--40. Available at http://newton.nap.edu/catalog/11745.html#toc. Cyclospora cayetanensis: a review, focusing on the outbreaks of cyclosporiasis in the 1990s. Clin Infect Dis 2000;31:1040--57.
Diphtheria
Human clinical isolates of Corynebacterium diphtheriae and Corynebacterium ulcerans collected in Canada from 1999 to 2003 but not fitting reporting criteria for cases of diphtheria. Clin Microbiol 2005;43:3447--9.
Domestic Arboviral Diseases, Neuroinvasive and Nonneuroinvasive
Leprosy. Lancet 2004;363:1209--19.
Armadillo exposure and Hansen's disease: an epidemiologic survey in southern Texas. J Am Acad Dermatol 2000;43(2 Pt1):223--8.
Leprosy: a case series and review. South Med J 2004;97:1252--6.
Leprosy. 2nd ed. New York, NY: Churchill Livingstone; 1994.
Leprosy (Hansen's disease). In: Rakel RE, Bope ET, eds. Conn's current therapy 2004: latest approved methods of treatment for the practicing physician. 56th ed. Philadelphia, PA: Saunders; 2004:100--5.
Update on leprosy in immigrants in the United States: status in the year 2000. Clin Infect Dis 2001;32:930--7.
The continuing challenges of leprosy. Clin Microbio Rev, 2006;19: 338--81.
The United States prospective hemolytic uremic syndrome study: microbiologic, serologic, clinical, and epidemiologic findings. J Infect Dis 2001;183:1063--70.
Hemolytic uremic syndrome and death in persons with Escherichia coli O157:H7 infection, Foodborne Diseases Active Surveillance Network Sites, 2000--2006. Clin Infect Dis 2009;49:1480--5.
Shiga-toxin-producing Escherichia coli and haemolytic uraemic syndrome. Lancet 2005;365:1073--86.
Hepatitis A
Hepatitis A virus infections in the United States: model-based estimates and implications for childhood immunization. Pediatrics 2002;109:839--45.
Hepatitis A virus infection in the United States: serologic results from the Third National Health and Nutrition Examination Survey. Vaccine 2005;23:5798--806. Prevention of hepatitis A through active or passive immunization: recommendations of the Advisory Committee on Immunization Practices. MMWR 2006;55(No. RR-7).
Incidence of hepatitis A in the United States in the era of vaccination. JAMA 2005;294:194--201.
Hepatitis A in the era of vaccination. Epidemiol Rev 2006;28:101--11.
The prevalence of hepatitis C virus infection in the United States, 1999 through 2002. Ann Intern Med 2006;144):705--14.
The past incidence of hepatitis C virus infection: implications for the future burden of chronic liver disease in the United States. Hepatology 2000;31:777--82. Recommendations for prevention and control of hepatitis C virus (HCV) infection and HCV-related chronic disease. MMWR 1998;47(No. RR-19).
The global epidemiology of hepatitis C. Lancet Infect Dis 2005;5:558--67.
Nonhospital health-care associated hepatitis B and C transmission ---United States, 1998--2008. Ann Intern Med. 2009;150:33--9.
Population-based surveillance for hepatitis C virus, United States, 2006--2007. Emerg Infect Dis 2009;15:1499--1502.
Surveillance for travel-associated legionnaires' disease-United States, 2005--2006. MMWR 2007;56:1261--3. Legionella and Legionnaires' disease: 25 years of investigation. Clin Microbiol Rev 2002;15:506--26.
European guidelines for control and prevention of travel associated Legionnaires' disease. London, UK: United Kingdom Health Protection Agency; 2005.
Legionnaires' disease in Europe 2000--2002. Epidemiol Infect 2004;132:417--24.
Surveillance for Legionnaires' disease: risk factors for morbidity and mortality. Arch Intern Med 1994;154:2417--22.
Increasing incidence of legionellosis in the United States: changing epidemiological trends. Clin Infect Dis 2008;47:591--9.
Listeriosis
Multistate outbreak of listeriosis linked to turkey deli meat and subsequent changes in US regulatory policy. Clin Infect Dis 2006;42:29--36.
Nationwide outbreak of listeriosis due to contaminated meat. Epidemiol Infect 2006;134:744--51.
Food-related illness and death in the United States. Emerg Infect Dis 1998;5:607--25.
Listeriosis in humans. In: Ryser ET Marth EH, eds. Listeria, listeriosis, and food safety. 2nd ed. New York, NY: Marcel Dekker, Inc.; Little, Brown and Company; 1999:75--95.
Reduction in the incidence of invasive listeriosis in Foodborne Diseases Active Surveillance Network Sites, 1996--2003. Clin Infect Dis 2007;44:513--20.
The emergence of novel swine influenza viruses in North America. Virus Res 2002;85:199--210.
Influenza pandemic periodicity, virus recycling, and the art of risk assessment. Emerg Infect Dis. 2006;12:34--9.
Influenza: pigs, people and public health. Des Moines, IA: National Pork Board; 2004. Available at: http://www.porkboard.org/PorkScience/Documents/PUBLICHEALTH%20influenza.pdf.
Human plague---Four states, 2006. MMWR 2006;55:940--3.
Dog-associated risk factors for human plague. Zoonoses and Public Health 2008;55:448--54.
Modeling relationships between climate and the frequency of human plague cases in the southwestern United States, 1960--1997. Am J. Trop Med Hyg 2002;66:186--96.
Plague as a biological weapon: medical and public health management. Working Group on Civilian Defense. JAMA 2000;283:2281--90.
Plague manual: epidemiology, distribution, surveillance and control. Geneva, Switzerland: World Health Organization; 1999.
Genotyping of Chlamydophila psitttaci by real time PCR and high resolution melt analysis. J Clin Microbiol 2008;47:175--81.
Q Fever
Infect Dis Clin North Am 2008;22:505--14.
Q fever. The Lancet 2006 367;511:679--88.
National surveillance and the epidemiology of Q fever in the United States, 1978--2004. Am J Trop Med Hyg 2006;75:36--40.
Q fever 1985--1998. Clinical and epidemiologic features of 1,383 infections [Review]. Medicine 2000:79:109--25.
Salmonella enterica serotype Enteritidis and eggs: a national epidemic in the United States. Clin Infect Dis 2006;43:512--7.
Salmonellosis outcomes differ substantially by serotype. J Infect Dis 2008;198:109--14.
The changing epidemiology of Salmonella: trends in serotypes isolated from humans in the United States, 1987--1997. J Infect Dis 2001;183:756--61.
FoodNet estimate of burden of illness caused by nontyphoidal Salmonella infections in the United States. Clin Infect Dis 2004;38(Suppl 3):S127--34.
Shiga toxin-producing Escherichia coli
Non-O157 Shiga toxin-producing Escherichia coli infections in the United States, 1983--2002. J Infect Dis 2005;192:1422--9.
An outbreak of Escherichia coli O157:H7 among visitors to a dairy farm. N Engl J Med 2002;347:555--60. Escherichia coli O157:H7 and other enterohemorrhagic E. coli. In: Blaser MJ, Smith PD, Ravdin JI, Greenberg HB, Guerrant RL, eds. Infections of the gastrointestinal tract. Philadelphia, PA: Lippincott Williams & Wilkins; 2002:627--42
Characteristics of O157 versus non-O157 shiga toxin-producing Escherichia coli infections in Minnesota, 2000--2006. Clin Infect Dis 2009;49:358--64. Escherichia coli O157:H7. Lancet 1998;352:1207--12.
Shiga-toxin-producing Escherichia coli and haemolytic uraemic syndrome. Lancet 2005;365:1073--86.
Shigellosis
Sharing Shigella: risk factors and costs of a multi-community outbreak of shigellosis. Arch Pediatr Adolesc Med 2003;157:601--3. Outbreaks of multidrug-resistant Shigella sonnei gastroenteritis associated with day care centers---Kansas, Kentucky, and Missouri, 2005. MMWR 2006;55:1068--71.
Laboratory-confirmed shigellosis in the United States, 1989--2002: epidemiologic trends and patterns. Clin Infect Dis 2004;38:1372--7.
A high prevalence of antimicrobial resistance among Shigella isolates in the United States, 1999--2002. Antimicrob Agents Chemother 2006;50:49--54.
Transmission risk factors and treatment of pediatric shigellosis during a large daycare center-associated outbreak of multidrug resistant Shigellasonnei: Implications for the management of shigellosis outbreaks among children. Pediatr Infect Dis J 2009;976--80.
Smallpox
Smallpox virus plague phenotypes: genetic, geographical and case fatality relationships. J Gen Virol 2009;90(Pt 4):792--8.
In vitro efficacy of ST246 against smallpox and monkeypox. Antimicrob Agents Chemother 2009; 53:1007--12.
Streptococcal Disease, Invasive, Group A
The epidemiology of invasive group A streptococcal infections and potential vaccine implications, United States, 2000--2004. Clin Infect Dis 2007; 45:853--62.
Active Bacterial Core Surveillance report. Emerging Infections Program Network. Group A streptococcus, 2008. Available at http://www.cdc.gov/abcs/reports-findings/survreports/GAS08.html.
Steer AC. Mulholland EK. Weber M. The global burden of group A streptococcal diseases. Lancet Infect Dis 2005;5:685--94.
Group A streptococcal disease in long-term care facilities: descriptive epidemiology and potential control measures. Clin Infect Dis 2007;45:742--52.
Investigating clusters of group A streptococcal disease. Atlanta, GA: US Department of Health and Human Services, CDC; 2005. Available at http://www.cdc.gov/strepAcalculator.
Prevention of invasive group A streptococcal disease among household contacts of case patients and among postpartum and postsurgical patients: recommendations from the Centers for Disease Control and Prevention. Clin Infect Dis 2002;35:950--9.
Streptococcal Toxic-Shock Syndrome
Brito MO. Collins CM. Molecular basis of group A streptococcal virulence. Lancet Infect Dis 2003;3:191--200.
The epidemiology of invasive group A streptococcal infections and potential vaccine implications, United States, 2000-2004. Clin Infect Dis 2007; 45:853--62.
Streptococcal toxic-shock syndrome associated with necrotizing fasciitis. Annu Rev Med 2000;51:271--88.
Prevention of invasive group A streptococcal disease among household contacts of case patients and among postpartum and postsurgical patients: recommendations from the Centers for Disease Control and Prevention. Clin Infect Dis 2002;35:950--9.
Preventing pneumococcal disease among infants and young children: recommendations of the Advisory Committee on Immunization Practices (ACIP). MMWR 2000;49(No. RR-9).
Performance standards for antimicrobial susceptibility testing: 15th informational supplement [No. M100-S15]. Wayne, PA: National Committee for Clinical Laboratory Standards; 2005.
Impact of childhood vaccination on racial disparities in invasive Streptococcus pneumoniae infections. JAMA 2004;291:2197--203.
Effect of introduction of the pneumococcal conjugate vaccine on drug-resistant Streptococcus pneumoniae. N Engl J Med 2006;354:1455--63.
Invasive pneumococcal disease among infants before and after introduction of pneumococcal conjugate vaccine. JAMA 2006;295:1668--74.
Cost-effectiveness of pneumococcal conjugate vaccine: evidence from the first 5 years of use in the United States incorporating herd effects. Pediatr Infect Dis J 2006;25:494--501.
The National Plan to Eliminate Syphilis from the United States. Atlanta, GA: US Department of Health and Human Services, CDC; 1999.
Trends in primary and secondary syphilis among men who have sex with men in the United States. Am J Public Health 2007;97:1076--83.
Sexually Transmitted Disease Surveillance, 2008. Atlanta, GA: U.S. Department of Health and Human Services, CDC; 2009. Available at http://www.cdc.gov/std/stats. Primary and secondary syphilis--- Jefferson County, Alabama, 2002--2007. MMWR 2009;58:463--7.
Reported tuberculosis in the United States, 2003. Atlanta, GA: US Department of Health and Human Services, CDC; 2004. Available at http://www.cdc.gov/nchstp/tb. Trends in tuberculosis---United States, 2004. MMWR 2005;54:245--9.
Tuberculosis screening among foreign-born persons applying for permanent US residence. Am J Public Health 2002;92:826--9.
Tuberculosis among foreign-born persons in the United States, 1993--1998. JAMA 2000;284:2894--900.
Laboratory-based surveillance for paratyphoid fever in the United States: travel and antimicrobial resistance. Clin Infect Dis; 2008;46:1656-63.
Analysis of Salmonella serotype Typhi pulsed-field gel electrophoresis patterns associated with international travel. J Clin Micro 2005;43:1205--9.
Outbreaks of typhoid fever in the United States, 1960--1999. Epidemiol Infect 2003;130:13--21.
Typhoid fever in travelers: who should be targeted for prevention? Clin Infect Dis 2004;39:186--91.
Typhoid fever in the United States, 1999--2006. JAMA 2009;302:898--9
Vancomycin-Intermediate Staphylococcus aureus Epidemiology Study Group. Epidemiological and microbiological characterization of infections caused by Staphylococcus aureus with reduced susceptibility to vancomycin, United States, 1997--2001. Clin Infect Dis 2003;36:429--39.
Vancomycin-Resistant Staphylococcus aureus Investigative Team. Infection with vancomycin-resistant Staphylococcus aureus containing the vanA resistance gene. N Engl J Med 2003;348:1342--7.
Vancomycin-resistant Staphylococcus aureus in the absence of vancomycin exposure. Clin Infect Dis 2004;38:1049--55.
Genetic analysis of a high-level vancomycin-resistant isolate of Staphylococcus aureus. Science 2003;302:1569--71.
Vancomycin intermediate and resistant Staphylococcus aureus: what the nephrologist needs to know. Nephrol News Issues 2004;8:63--4, 66--7, 71--2.
Vibriosis
Vibrio parahaemolyticus infections in the United States, 1973-1998. J Infect Dis 2000;181:1661--6.
Nonfoodborne vibrio infections: an important cause of morbidity and mortality in the United States, 1997--2006. Clin Infect Dis;46:970--6.
Outbreak of Vibrio parahaemolyticus gastroenteritis associated with Alaskan oysters. N Engl J Med 2005;353:1463--70.
The role of Gulf Coast oysters in warmer months in Vibrio vulnificus infections in the United States, 1998--1996. J Infect Dis 1998;178:752--9.
Use of trade names and commercial sources is for identification only and does not imply endorsement by the U.S. Department of
Health and Human Services.
References to non-CDC sites on the Internet are
provided as a service to MMWR readers and do not constitute or imply
endorsement of these organizations or their programs by CDC or the U.S.
Department of Health and Human Services. CDC is not responsible for the content
of pages found at these sites. URL addresses listed in MMWR were current as of
the date of publication.
All MMWR HTML versions of articles are electronic conversions from typeset documents.
This conversion might result in character translation or format errors in the HTML version.
Users are referred to the electronic PDF version (http://www.cdc.gov/mmwr)
and/or the original MMWR paper copy for printable versions of official text, figures, and tables.
An original paper copy of this issue can be obtained from the Superintendent of Documents, U.S.
Government Printing Office (GPO), Washington, DC 20402-9371;
telephone: (202) 512-1800. Contact GPO for current prices.
**Questions or messages regarding errors in formatting should be addressed to
mmwrq@cdc.gov.
Centers for Disease Control and Prevention 1600 Clifton Road Atlanta, GA 30329-4027, USA
800-CDC-INFO (800-232-4636) TTY: (888) 232-6348 - Contact CDC–INFO