Viral Hepatitis Surveillance Report 2018 — Hepatitis A
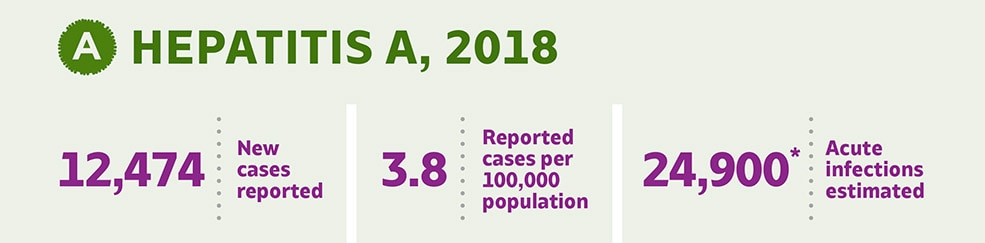
AT A GLANCE: Hepatitis A in 2018
Hepatitis A incidence increased 850% from 2014 to 2018. The increase in 2018 was primarily due to unprecedented person-to-person outbreaks reported in 24 states among people who use drugs and people experiencing homelessness.
Groups Most Affected by Hepatitis A in 2018
By Age†
20–29 years: 6.1 cases per 100,000 people
30–39 years: 9.8 cases per 100,000 people
40–49 years: 6.6 cases per 100,000 people
By Sex†
Males: 4.7 cases per 100,000 people
By Race/ Ethnicity†
White, Non-Hispanic: 4.3 cases per 100,000 people
By Risk
Injection Drug Use (IDU): Among the 8,471 reported cases with IDU information available, 4,247 (50%) report IDU
- Figure 1.1. Number of reported hepatitis A cases and estimated infections — United States, 2011–2018
- Table 1.1. Number and rate of reported cases of hepatitis A, by state or jurisdiction ― United States, 2014–2018
- Figure 1.2. Rates of reported hepatitis A, by state — United States, 2017–2018
- Figure 1.3. Rates of reported hepatitis A, by state or jurisdiction — United States, 2018
- Figure 1.4. Rates of reported hepatitis A, by age group — United States, 2003–2018
- Figure 1.5. Rates of reported hepatitis A, by sex — United States, 2003–2018
- Figure 1.6. Rates of reported hepatitis A, by race/ethnicity — United States, 2003–2018
- Table 1.2. Number and rate* of reported cases† of hepatitis A, by demographic characteristics — United States 2014–2018
- Figure 1.7. Availability of information on risk behaviors/exposures associated with reported cases of hepatitis A — United States, 2018
- Table 1.3. Reported risk behaviors/exposure among reported cases of hepatitis A — United States, 2018
- Table 1.4. Number and rate of deaths with hepatitis A listed as a cause of death among U.S. residents, by demographic characteristic and year — United States, 2014–2018
Figure 1.1. Number of reported hepatitis A cases and estimated infections* — United States, 2011–2018

| Hepatitis A | 2011 | 2012 | 2013 | 2014 | 2015 | 2016 | 2017 | 2018 |
|---|---|---|---|---|---|---|---|---|
| Reported acute cases | 1,398 | 1,562 | 1,781 | 1,239 | 1,390 | 2,007 | 3,366 | 12,474 |
| Estimated acute infections | 2,800 | 3,100 | 3,500 | 2,500 | 2,800 | 4,000 | 6,700 | 24,900 |
* The number of estimated viral hepatitis infections was determined by multiplying the number of reported cases by a factor that adjusted for under-ascertainment and under-reporting(7). The 95% bootstrap confidence intervals for the estimated number of infections are shown in the Appendix.
Downloads of this figure/table: PDFpdf icon PPTppt icon
Table 1.1. Number and rate* of reported cases† of hepatitis A, by state or jurisdiction ― United States, 2014–2018
| State | 2014 No. |
2014 Rate* |
2015 No. |
2015 Rate* |
2016 No. |
2016 Rate* |
2017 No. |
2017 Rate* |
2018 No. |
2018 Rate* |
|---|---|---|---|---|---|---|---|---|---|---|
| Alabama | 15 | 0.3 | 23 | 0.5 | 19 | 0.4 | 23 | 0.5 | 38 | 0.8 |
| Alaska | 1 | 0.1 | 4 | 0.5 | 2 | 0.3 | — | — | 1 | 0.1 |
| Arizona | 29 | 0.4 | 54 | 0.8 | 32 | 0.5 | 59 | 0.8 | 77 | 1.1 |
| Arkansas | 2 | 0.1 | 10 | 0.3 | 13 | 0.4 | 7 | 0.2 | 254 | 8.4 |
| California | 142 | 0.4 | 179 | 0.5 | 229 | 0.6 | 947 | 2.4 | 189 | 0.5 |
| Colorado | 23 | 0.4 | 25 | 0.5 | 22 | 0.4 | 65 | 1.2 | 31 | 0.5 |
| Connecticut | 23 | 0.6 | 9 | 0.3 | 16 | 0.4 | 17 | 0.5 | 15 | 0.4 |
| Delaware | 1 | 0.1 | 2 | 0.2 | 1 | 0.1 | 6 | 0.6 | 7 | 0.7 |
| District of Columbia | U | U | U | U | 4 | 0.6 | 3 | 0.4 | 11 | 1.6 |
| Florida | 90 | 0.5 | 108 | 0.5 | 115 | 0.6 | 261 | 1.2 | 548 | 2.6 |
| Georgia | 24 | 0.2 | 30 | 0.3 | 44 | 0.4 | 24 | 0.2 | 84 | 0.8 |
| Hawaii | 5 | 0.4 | 6 | 0.4 | 285 | 20.0 | 8 | 0.6 | 4 | 0.3 |
| Idaho | 7 | 0.4 | 9 | 0.5 | 7 | 0.4 | 4 | 0.2 | 5 | 0.3 |
| Illinois | 82 | 0.6 | 57 | 0.4 | 71 | 0.6 | 73 | 0.6 | 93 | 0.7 |
| Indiana | 20 | 0.3 | 19 | 0.3 | 18 | 0.3 | 21 | 0.3 | 964 | 14.4 |
| Iowa | 12 | 0.4 | 16 | 0.5 | 16 | 0.5 | 9 | 0.3 | 10 | 0.3 |
| Kansas | 7 | 0.2 | 7 | 0.2 | 5 | 0.2 | 6 | 0.2 | 14 | 0.5 |
| Kentucky | 19 | 0.4 | 16 | 0.4 | 9 | 0.2 | 71 | 1.6 | 3,560 | 79.7 |
| Louisiana | 5 | 0.1 | 5 | 0.1 | 12 | 0.3 | 8 | 0.2 | 37 | 0.8 |
| Maine | 8 | 0.6 | 8 | 0.6 | 8 | 0.6 | 7 | 0.5 | 9 | 0.7 |
| Maryland | 27 | 0.5 | 19 | 0.3 | 37 | 0.6 | 29 | 0.5 | 52 | 0.9 |
| Massachusetts | 43 | 0.6 | 34 | 0.5 | 64 | 0.9 | 52 | 0.8 | 364 | 5.3 |
| Michigan | 45 | 0.5 | 51 | 0.5 | 112 | 1.1 | 670 | 6.7 | 299 | 3.0 |
| Minnesota | 19 | 0.3 | 21 | 0.4 | 15 | 0.3 | 30 | 0.5 | 16 | 0.3 |
| Mississippi | 3 | 0.1 | 2 | 0.1 | 2 | 0.1 | 3 | 0.1 | 13 | 0.4 |
| Missouri | 20 | 0.3 | 9 | 0.1 | 16 | 0.3 | 27 | 0.4 | 243 | 4.0 |
| Montana | 5 | 0.5 | 2 | 0.2 | 3 | 0.3 | 3 | 0.3 | — | — |
| Nebraska | 9 | 0.5 | 6 | 0.3 | 21 | 1.1 | 4 | 0.2 | 6 | 0.3 |
| Nevada | 5 | 0.2 | 11 | 0.4 | 14 | 0.5 | 19 | 0.6 | 41 | 1.4 |
| New Hampshire | 5 | 0.4 | 2 | 0.2 | 8 | 0.6 | 7 | 0.5 | 12 | 0.9 |
| New Jersey | 59 | 0.7 | 59 | 0.7 | 74 | 0.8 | 71 | 0.8 | 70 | 0.8 |
| New Mexico | 8 | 0.4 | 6 | 0.3 | 4 | 0.2 | 4 | 0.2 | 23 | 1.1 |
| New York | 84 | 0.4 | 123 | 0.6 | 99 | 0.5 | 218 | 1.1 | 165 | 0.8 |
| North Carolina | 38 | 0.4 | 45 | 0.4 | 52 | 0.5 | 29 | 0.3 | 103 | 1.0 |
| North Dakota | 9 | 1.2 | 5 | 0.7 | 2 | 0.3 | — | — | — | — |
| Ohio | 32 | 0.3 | 36 | 0.3 | 36 | 0.3 | 45 | 0.4 | 1,687 | 14.4 |
| Oklahoma | 17 | 0.4 | 11 | 0.3 | 11 | 0.3 | 9 | 0.2 | 5 | 0.1 |
| Oregon | 13 | 0.3 | 28 | 0.7 | 15 | 0.4 | 20 | 0.5 | 23 | 0.5 |
| Pennsylvania | 48 | 0.4 | 43 | 0.3 | 62 | 0.5 | 69 | 0.5 | 99 | 0.8 |
| Rhode Island | 8 | 0.8 | 4 | 0.4 | 4 | 0.4 | 6 | 0.6 | 7 | 0.7 |
| South Carolina | 6 | 0.1 | 16 | 0.3 | 21 | 0.4 | 21 | 0.4 | 30 | 0.6 |
| South Dakota | 3 | 0.4 | 2 | 0.2 | 1 | 0.1 | 1 | 0.1 | 1 | 0.1 |
| Tennessee | 12 | 0.2 | 14 | 0.2 | 7 | 0.1 | 6 | 0.1 | 654 | 9.7 |
| Texas | 124 | 0.5 | 147 | 0.5 | 139 | 0.5 | 129 | 0.5 | 88 | 0.3 |
| Utah | 8 | 0.3 | 8 | 0.3 | 12 | 0.4 | 159 | 5.1 | 135 | 4.3 |
| Vermont | 1 | 0.2 | 3 | 0.5 | 5 | 0.8 | 2 | 0.3 | 3 | 0.5 |
| Virginia | 27 | 0.3 | 50 | 0.6 | 190 | 2.3 | 46 | 0.5 | 82 | 1.0 |
| Washington | 26 | 0.4 | 26 | 0.4 | 31 | 0.4 | 28 | 0.4 | 35 | 0.5 |
| West Virginia | 12 | 0.6 | 8 | 0.4 | 15 | 0.8 | 6 | 0.3 | 2247 | 124.4 |
| Wisconsin | 7 | 0.1 | 9 | 0.2 | 7 | 0.1 | 16 | 0.3 | 15 | 0.3 |
| Wyoming | 1 | 0.2 | 3 | 0.5 | — | — | 18 | 3.1 | 5 | 0.9 |
| Total | 1,239 | 0.4 | 1,390 | 0.4 | 2,007 | 0.6 | 3,366 | 1.0 | 12,474 | 3.8 |
* Rate per 100,000 population.
—: No reported cases. The reporting jurisdiction did not submit any cases to CDC.
N: Not reportable. The disease or condition was not reportable by law, statue, or regulation in the reporting jurisdiction.
U: Unavailable. The data are unavailable.
Downloads of this table: PDFpdf icon PPTppt icon
Figure 1.2. Rates of reported hepatitis A, by state — United States, 2017–2018

Downloads of this figure: PDFpdf icon PPTppt icon
Figure 1.3. Rates of reported hepatitis A, by state or jurisdiction — United States, 2018

| Color Key |
Cases/100,000 Population |
States |
|---|---|---|
| 0-0.3 | AK, HI, ID, IA, MN, NE, OK, SD, TX, WI | |
| >0.3-0.7 | CA, CO, CT, DE, IL, KS, ME, MS, OR, RI, SC, VT, WA | |
| >0.7-0.9 | AL, GA, LA, MD, NH, NJ, NY, PA, WY | |
| >0.9-3.9 | AZ, DC, FL, MI, NV, NM, NC, VA | |
| >3.9-9.7 | AR, MA, MO, TN, UT | |
| >9.7-124.4 | IN, KY, OH, WV | |
| No reported cases | MT, ND |
Source: CDC, National Notifiable Diseases Surveillance System.
Downloads of this figure: PDFpdf icon PPTppt icon
Figure 1.4. Rates of reported hepatitis A, by age group — United States, 2003–2018

| Age (years) | 2003 | 2004 | 2005 | 2006 | 2007 | 2008 | 2009 | 2010 | 2011 | 2012 | 2013 | 2014 | 2015 | 2016 | 2017 | 2018 |
|---|---|---|---|---|---|---|---|---|---|---|---|---|---|---|---|---|
| 0-9 | 1.8 | 1.9 | 1.4 | 1.1 | 0.7 | 0.5 | 0.3 | 0.3 | 0.2 | 0.2 | 0.1 | 0.1 | 0.1 | 0.1 | 0.1 | 0.1 |
| 10-19 | 2.2 | 2.0 | 1.6 | 1.3 | 0.9 | 0.8 | 0.6 | 0.5 | 0.4 | 0.4 | 0.3 | 0.3 | 0.2 | 0.3 | 0.2 | 0.6 |
| 20-29 | 3.5 | 2.3 | 2.0 | 1.6 | 1.4 | 1.0 | 1.0 | 0.8 | 0.6 | 0.7 | 0.7 | 0.5 | 0.6 | 0.9 | 1.4 | 6.1 |
| 30-39 | 2.8 | 1.8 | 1.5 | 1.2 | 1.2 | 0.9 | 0.8 | 0.6 | 0.5 | 0.5 | 0.7 | 0.5 | 0.6 | 0.9 | 2.1 | 9.8 |
| 40-49 | 2.7 | 1.6 | 1.3 | 1.2 | 1.0 | 0.9 | 0.6 | 0.5 | 0.4 | 0.5 | 0.6 | 0.3 | 0.4 | 0.8 | 1.5 | 6.6 |
| 50-59 | 2.6 | 1.7 | 1.4 | 1.1 | 0.9 | 0.9 | 0.6 | 0.5 | 0.4 | 0.6 | 0.6 | 0.4 | 0.5 | 0.7 | 1.3 | 3.5 |
| 60+ | 2.6 | 2.1 | 1.4 | 1.0 | 0.9 | 0.9 | 0.7 | 0.6 | 0.5 | 0.6 | 0.7 | 0.5 | 0.5 | 0.6 | 0.7 | 1.4 |
Downloads of this figure: PDFpdf icon PPTppt icon
Figure 1.5. Rates of reported hepatitis A, by sex — United States, 2003–2018

| Sex | 2003 | 2004 | 2005 | 2006 | 2007 | 2008 | 2009 | 2010 | 2011 | 2012 | 2013 | 2014 | 2015 | 2016 | 2017 | 2018 |
|---|---|---|---|---|---|---|---|---|---|---|---|---|---|---|---|---|
| Male | 2.8 | 2.1 | 1.7 | 1.3 | 1.1 | 0.9 | 0.7 | 0.6 | 0.5 | 0.5 | 0.6 | 0.4 | 0.5 | 0.7 | 1.4 | 4.7 |
| Female | 2.4 | 1.8 | 1.3 | 1.1 | 0.9 | 0.8 | 0.6 | 0.5 | 0.4 | 0.5 | 0.6 | 0.4 | 0.4 | 0.5 | 0.7 | 3.0 |
Downloads of this figure: PDFpdf icon PPTppt icon
Figure 1.6. Rates of reported hepatitis A, by race/ethnicity — United States, 2003–2018

| Race/ Ethnicity |
2003 | 2004 | 2005 | 2006 | 2007 | 2008 | 2009 | 2010 | 2011 | 2012 | 2013 | 2014 | 2015 | 2016 | 2017 | 2018 |
|---|---|---|---|---|---|---|---|---|---|---|---|---|---|---|---|---|
| American Indian/ Alaska Native | 1.5 | 0.8 | 0.6 | 0.5 | 0.7 | 0.8 | 0.3 | 0.2 | 0.7 | 0.2 | 0.3 | 0.2 | 0.2 | 0.1 | 0.5 | 0.5 |
| Asian/Pacific Islander | 1.9 | 2.9 | 1.7 | 1.5 | 1.1 | 1.3 | 1.1 | 1.0 | 0.9 | 0.6 | 0.6 | 0.7 | 0.6 | 1.5 | 0.6 | 0.5 |
| Black, Non-Hispanic | 1.5 | 1.0 | 0.8 | 0.6 | 0.4 | 0.4 | 0.4 | 0.3 | 0.3 | 0.2 | 0.2 | 0.2 | 0.2 | 0.3 | 0.7 | 1.2 |
| White, Non-Hispanic | 1.5 | 1.1 | 0.9 | 0.7 | 0.7 | 0.6 | 0.4 | 0.4 | 0.3 | 0.4 | 0.5 | 0.3 | 0.3 | 0.4 | 1.0 | 4.3 |
| Hispanic | 2.7 | 2.7 | 2.7 | 2.3 | 1.4 | 1.0 | 0.8 | 0.7 | 0.5 | 0.5 | 0.5 | 0.4 | 0.4 | 0.5 | 0.8 | 0.7 |
Downloads of this figure: PDFpdf icon PPTppt icon
Table 1.2. Number and rate* of reported cases† of hepatitis A, by demographic characteristics — United States 2014–2018
| State | 2014 No. |
2014 Rate* |
2015 No. |
2015 Rate* |
2016 No. |
2016 Rate* |
2017 No. |
2017 Rate* |
2018 No. |
2018 Rate* |
|---|---|---|---|---|---|---|---|---|---|---|
| Total§ | 1,239 | 0.4 | 1,390 | 0.4 | 2,007 | 0.6 | 3,366 | 1.0 | 12,474 | 3.8 |
| Age group (years) | ||||||||||
| 0–9 | 41 | 0.1 | 48 | 0.1 | 47 | 0.1 | 40 | 0.1 | 54 | 0.1 |
| 10–19 | 114 | 0.3 | 97 | 0.2 | 131 | 0.3 | 86 | 0.2 | 231 | 0.6 |
| 20–29 | 246 | 0.5 | 287 | 0.6 | 392 | 0.9 | 659 | 1.4 | 2,763 | 6.1 |
| 30–39 | 207 | 0.5 | 233 | 0.6 | 391 | 0.9 | 893 | 2.1 | 4,268 | 9.8 |
| 40–49 | 139 | 0.3 | 164 | 0.4 | 333 | 0.8 | 621 | 1.5 | 2,658 | 6.6 |
| 50–59 | 182 | 0.4 | 205 | 0.5 | 297 | 0.7 | 554 | 1.3 | 1,509 | 3.5 |
| 60+ | 304 | 0.5 | 353 | 0.5 | 409 | 0.6 | 509 | 0.7 | 987 | 1.4 |
| Sex | ||||||||||
| Male | 645 | 0.4 | 726 | 0.5 | 1,107 | 0.7 | 2,209 | 1.4 | 7,497 | 4.7 |
| Female | 591 | 0.4 | 662 | 0.4 | 897 | 0.5 | 1,149 | 0.7 | 4,952 | 3.0 |
| Race/ethnicity | ||||||||||
| American Indian/Alaskan Native | 4 | 0.2 | 5 | 0.2 | 3 | 0.1 | 13 | 0.5 | 15 | 0.5 |
| Asian/Pacific Islander | 135 | 0.7 | 114 | 0.6 | 299 | 1.5 | 124 | 0.6 | 104 | 0.5 |
| Black, Non-Hispanic | 82 | 0.2 | 71 | 0.2 | 137 | 0.3 | 303 | 0.7 | 508 | 1.2 |
| White, Non-Hispanic | 566 | 0.3 | 701 | 0.3 | 865 | 0.4 | 1,979 | 1.0 | 8670 | 4.3 |
| Hispanic | 211 | 0.4 | 219 | 0.4 | 293 | 0.5 | 471 | 0.8 | 413 | 0.7 |
| HHS Region¶ | ||||||||||
| Region 1 | 88 | 0.6 | 60 | 0.4 | 105 | 0.7 | 91 | 0.6 | 410 | 2.8 |
| Region 2 | 143 | 0.5 | 182 | 0.6 | 173 | 0.6 | 289 | 1.0 | 235 | 0.8 |
| Region 3 | 115 | 0.4 | 122 | 0.4 | 309 | 1.0 | 159 | 0.5 | 2,498 | 8.1 |
| Region 4 | 207 | 0.3 | 254 | 0.4 | 269 | 0.4 | 438 | 0.7 | 5,030 | 7.6 |
| Region 5 | 205 | 0.4 | 193 | 0.4 | 259 | 0.5 | 855 | 1.6 | 3,074 | 5.9 |
| Region 6 | 156 | 0.4 | 179 | 0.4 | 179 | 0.4 | 157 | 0.4 | 407 | 1.0 |
| Region 7 | 48 | 0.3 | 38 | 0.3 | 58 | 0.4 | 46 | 0.3 | 273 | 1.9 |
| Region 8 | 49 | 0.4 | 45 | 0.4 | 40 | 0.3 | 246 | 2.1 | 172 | 1.4 |
| Region 9 | 181 | 0.4 | 250 | 0.5 | 560 | 1.1 | 1,033 | 2.0 | 311 | 0.6 |
| Region 10 | 47 | 0.4 | 67 | 0.5 | 55 | 0.4 | 52 | 0.4 | 64 | 0.5 |
* Rate per 100,000 population.
† For the case definition, see https://wwwn.cdc.gov/nndss/conditions/hepatitis-a-acute/.
§ Numbers reported in each category may not add up to the total number of reported cases in a year due to cases with missing data or, in the case of race/ethnicity, cases categorized as “Other”.
¶ Health and Human Services Regions were categorized according to the grouping of states and U.S. Territories assigned under each of the ten Department of Health and Human Services regional offices (https://www.hhs.gov/about/agencies/iea/regional-offices/index.htmlexternal icon). For the purposes of this report, regions with U.S. territories (Region 2 and Region 9) contain data from states only.
Downloads of this table: PDFpdf icon PPTppt icon
Figure 1.7. Availability of information on risk behaviors/exposures* associated with reported cases of hepatitis A — United States, 2018


Downloads of this figure: PDFpdf icon PPTppt icon
Table 1.3. Reported risk behaviors/exposures† among reported cases of hepatitis A — United States, 2018
| Risk behaviors/exposures | Risk identified* | No risk identified | Risk data missing |
|---|---|---|---|
| Injection drug use | 4,247 | 4,224 | 4,003 |
| Sexual contact § | 299 | 4,728 | 7,447 |
| Household contact (non-sexual) § | 260 | 4,767 | 7,447 |
| Other contact § | 312 | 4,715 | 7,447 |
| Men who have sex with men ¶ | 194 | 1,362 | 5,941 |
| International travel | 114 | 6,896 | 5,464 |
* Case reports with at least one of the following risk behaviors/ exposures reported 2–6 weeks prior to symptom onset: 1) injection drug use; 2) sexual, household, or other contact; 3) men who have sex with men; 4) travel to hepatitis A-endemic region.
† Reported cases may include more than one risk behavior/exposure.
§ Cases with more than one type of contact reported were categorized according to a hierarchy: 1) sexual contact; 2) household contact (non-sexual); and 3) other contact with hepatitis A case
¶ A total of 7,497 hepatitis A cases were reported among males in 2018.
Downloads of this table: PDFpdf icon PPTppt icon
Table 1.4. Number and rate* of deaths with hepatitis A listed as a cause of death† among U.S. residents, by demographic characteristic and year — United States, 2014–2018
| Demographic characteristic |
2014 No. |
2014 (95% CI) |
2015 No. |
2015 (95% CI) |
2016 No. |
2016 (95% CI) |
2017 No. |
2017 (95% CI) |
2018 No. |
2018 (95% CI) |
|---|---|---|---|---|---|---|---|---|---|---|
| Age group (years) | ||||||||||
| 0–44 | 4 | UR§ | 5 | UR§ | 6 | UR§ | 9 | UR§ | 33 | 0.02 (0.01-0.02) |
| 45–64 | 35 | 0.04 (0.03-0.06) |
25 | 0.03 (0.02-0.04) |
33 | 0.04 (0.03-0.06) |
35 | 0.04 (0.03-0.06) |
72 | 0.09 (0.07-0.11) |
| 65+ | 37 | 0.08 (0.06-0.11) |
37 | 0.08 (0.05-0.11) |
31 | 0.06 (0.04-0.09) |
47 | 0.09 (0.07-0.12) |
66 | 0.13 (0.10-0.16) |
| Race/ethnicity | ||||||||||
| White, Non-Hispanic |
51 | 0.02 (0.02-0.03) |
45 | 0.01 (0.00-0.01) |
50 | 0.02 (0.01-0.02) |
69 | 0.02 (0.02-0.03) |
150 | 0.06 (0.05-0.07) |
| Other | 25 | S¶ | 22 | S¶ | 20 | S¶ | 22 | S¶ | 21 | S¶ |
| Sex | ||||||||||
| Male | 42 | 0.02 (0.01-0.03) |
38 | 0.02 (0.01-0.03) |
38 | 0.01 (0.01-0.02) |
63 | 0.03 (0.02-0.03) |
115 | 0.07 (0.06-0.08) |
| Female | 34 | 0.01 (0.01-0.02) |
29 | 0.01 (0.00-0.01) |
32 | 0.01 (0.01-0.02) |
28 | 0.00 (0.00-0.00) |
56 | 0.02 (0.02-0.03) |
| Overall | 76 | 0.02 (0.02-0.03) |
67 | 0.01 (0.01-0.02) |
70 | 0.01 (0.00-0.02) |
91 | 0.02 (0.02-0.03) |
171 | 0.05 (0.04-0.06) |
† Cause of death is defined as one of the multiple causes of death and is based on the International Classification of Diseases, 10th Revision (ICD-10) codes B15 (hepatitis A).
UR§ Unreliable rate: Rates where death counts were less than 20 were not displayed due to the instability associated with those rates.
S¶ Suppressed: CDC WONDER did not have the functionality to calculate rates for the “Other” race/ethnicity group.
Downloads of this table: PDFpdf icon PPTppt icon