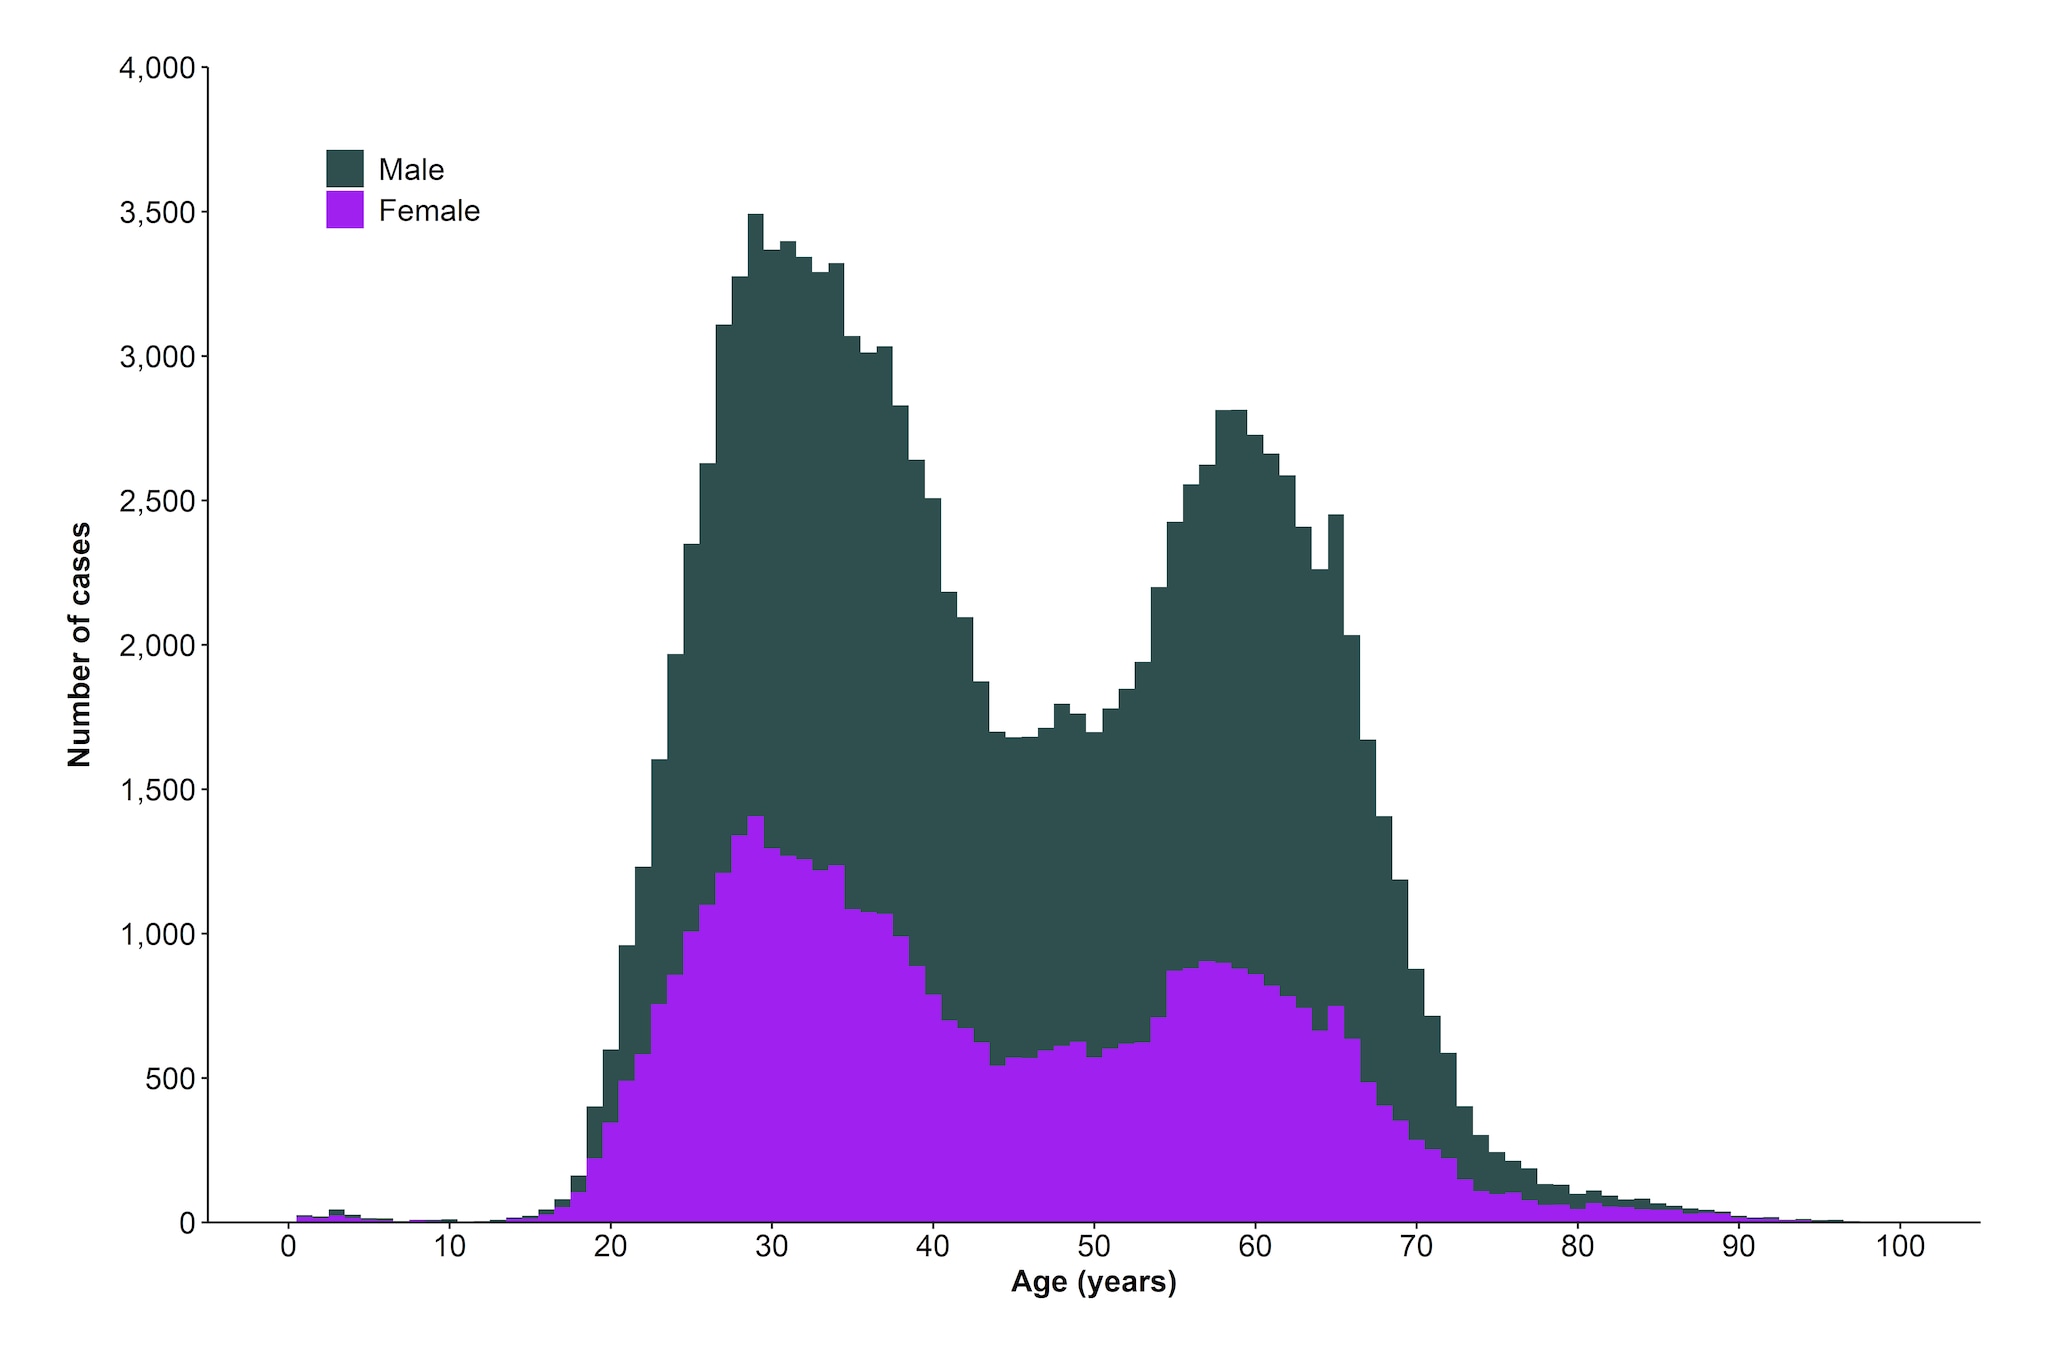
Figure 3.8. Number of newly reported* chronic hepatitis C virus infection cases,† by sex and age — United States, 2019

Source: CDC, National Notifiable Diseases Surveillance System.
* During 2019, cases of chronic hepatitis C were either not reportable by law, statute, or regulation; not reported; or otherwise unavailable to CDC from Arizona, Arkansas, California, Delaware, District of Columbia, Hawaii, Indiana, Kentucky, Mississippi, Nevada, North Carolina, Rhode Island, and Texas.
† Only confirmed, newly reported, chronic hepatitis C cases are included. For the complete case definition, see https://ndc.services.cdc.gov/conditions/hepatitis-c-chronic/.
Downloads of this figure: PDFpdf icon PPTppt icon
A total of 123,312 new chronic hepatitis C cases were reported during 2019. A higher number of newly reported cases of chronic hepatitis C were observed among males, compared with females across all age groups. Among both males and females, a bimodal age distribution was observed with infections highest among persons aged 20–39 years (peak: 29 years) and a second apex around 55–70 years (peak: 59 years).
Hepatitis C Figures and Tables
- Figure 3.1. Number of reported acute hepatitis C virus infection cases and estimated infections — United States, 2012–2019
- Figure 3.2. Rates of reported acute hepatitis C virus infections, by state — United States, 2018–2019
- Figure 3.3. Rates of reported acute hepatitis C virus infection, by state or jurisdiction — United States, 2019
- Figure 3.4. Rates of reported acute hepatitis C virus infection, by age group — United States, 2004–2019
- Figure 3.5. Rates of reported acute hepatitis C virus infection, by sex — United States, 2004–2019
- Figure 3.6. Rates of reported acute hepatitis C virus infection, by race/ethnicity — United States, 2004–2019
- Figure 3.7. Availability of information regarding risk behaviors or exposures associated with reported cases of acute hepatitis C virus infection — United States, 2019
- Figure 3.8. Number of newly reported chronic hepatitis C virus infection cases, by sex and age — United States, 2019
- Figure 3.9. Rates of death with hepatitis C virus infection listed as a cause of death among residents, by jurisdiction — United States, 2019
- Table 3.1. Number and rates of reported cases of acute hepatitis C, by state or jurisdiction — United States, 2015–2019
- Table 3.2. Number and rates of reported cases of acute hepatitis C, by demographic characteristics — United States 2015–2019
- Table 3.3. Reported risk behaviors or exposures among reported cases of acute hepatitis C virus infection — United States, 2019
- Table 3.4. Number of newly reported cases of perinatal hepatitis C virus infection, by state or jurisdiction — United States, 2019
- Table 3.5. Number and rates of newly reported cases of chronic hepatitis C virus infection, by state or jurisdiction — United States, 2019
- Table 3.6. Number and rates of newly reported cases of chronic hepatitis C virus infection, by demographic characteristics — United States, 2019
- Table 3.7. Number and rates of deaths with hepatitis C listed as a cause of death among residents, by state or jurisdiction — United States, 2015–2019
- Table 3.8. Number and rates of deaths with hepatitis C virus infection listed as a cause of death among residents, by demographic characteristics — United States, 2015–2019
Page last reviewed: May 14, 2021