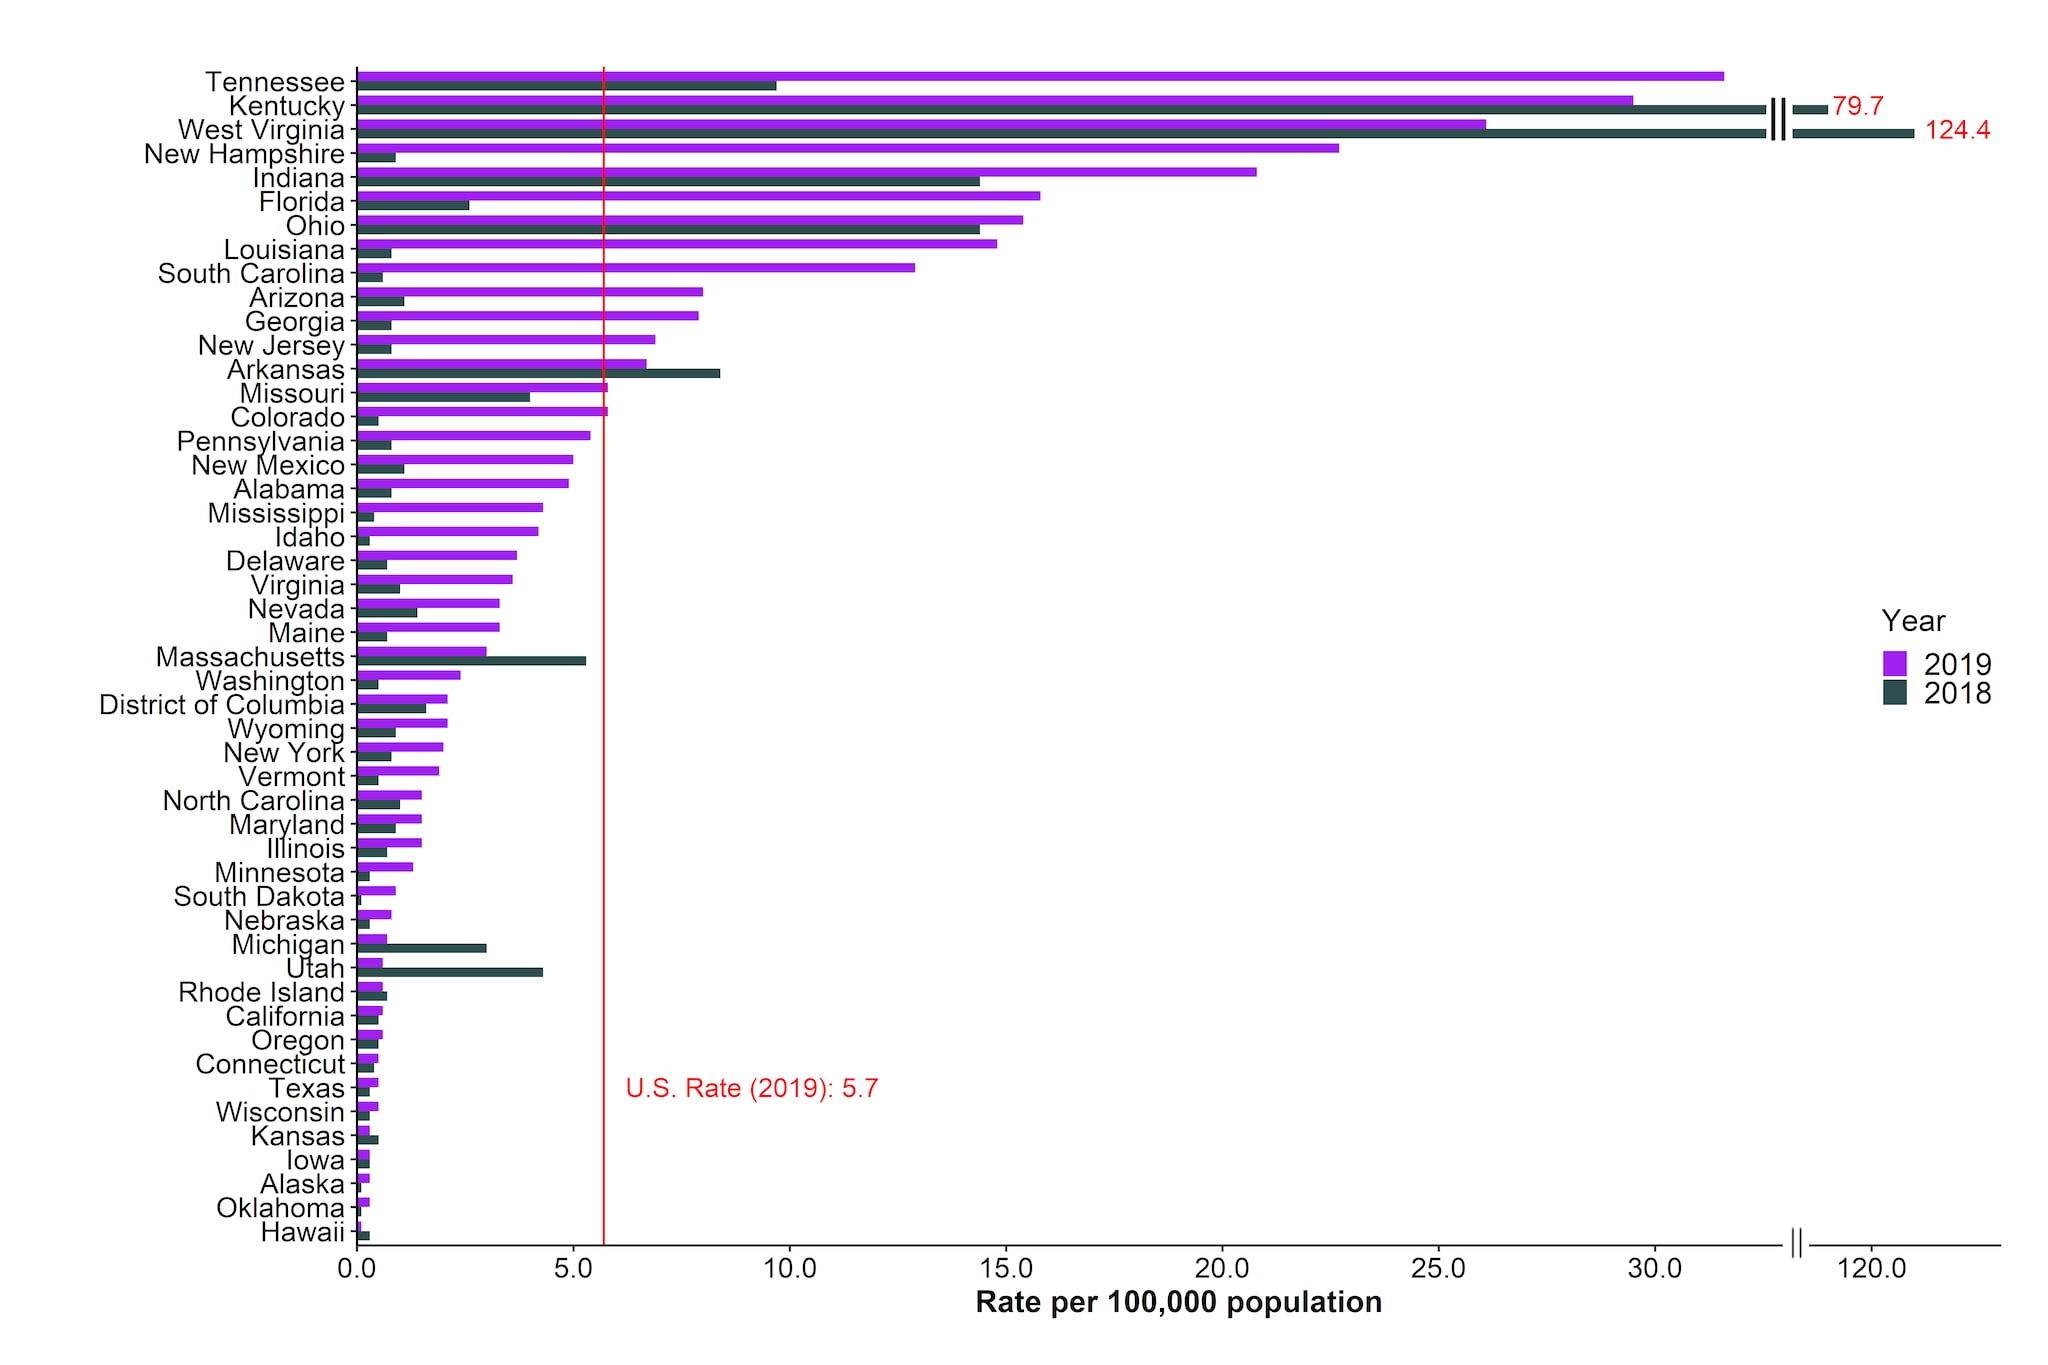
Figure 1.2. Rates* of reported hepatitis A†virus infection, by state or jurisdiction — United States, 2018–2019

Source: CDC, National Notifiable Diseases Surveillance System.
* Rates per 100,000 population.
† Reported cases that met the classification criteria for a confirmed case. For the case definition, see https://ndc.services.cdc.gov/conditions/hepatitis-a-acute/. Only states with rates for 2018 and 2019 are shown. No hepatitis A cases were reported from Montana and North Dakota in 2018
Downloads of this figure: PDFpdf icon PPTppt icon
During 2019, the rates of reported hepatitis A ranged from a high of 31.6 cases per 100,000 population in Tennessee to a low of 0.1 case per 100,000 population in Hawaii. Changes in rates during 2018 and 2019 were influenced by the time that person-to-person outbreaks occurred within jurisdictions. The largest increase in rates was observed in New Hampshire, with a rate during 2019 (22.7 cases per 100,000 population), 25 times the rate reported during 2018 (0.9 cases per 100,000 population). In contrast, the largest decrease in a rate was observed in Utah, where the 2019 rate decreased by 86%, as the person-to-person outbreak was resolving.
Hepatitis A Figures and Tables
- Figure 1.1. Number of reported hepatitis A virus infection cases and estimated infections — United States, 2012–2019
- Figure 1.2. Rates of reported hepatitis A virus infection, by state or jurisdiction — United States, 2018–2019
- Figure 1.3. Rates of reported hepatitis A virus infection, by state or jurisdiction — United States, 2019
- Figure 1.4. Rates of reported hepatitis A virus infection, by age group — United States, 2004–2019
- Figure 1.5. Rates of reported hepatitis A virus infection, by sex — United States, 2004–2019
- Figure 1.6. Rates of reported hepatitis A virus infection, by race/ethnicity — United States, 2004–2019
- Figure 1.7. Availability of information regarding risk behaviors or exposures associated with reported cases of hepatitis A virus infection — United States, 2019
- Table 1.1. Number and rates of reported cases of hepatitis A virus infection, by state or jurisdiction — United States, 2015–2019
- Table 1.2. Number and rates of reported cases of hepatitis A virus infection, by demographic characteristics — United States 2015–2019
- Table 1.3. Reported risk behaviors or exposures among reported cases of hepatitis A virus infection — United States, 2019
- Table 1.4. Number and rates of deaths with hepatitis A virus infection listed as a cause of death among residents, by demographic characteristics — United States, 2015–2019
Page last reviewed: May 14, 2021