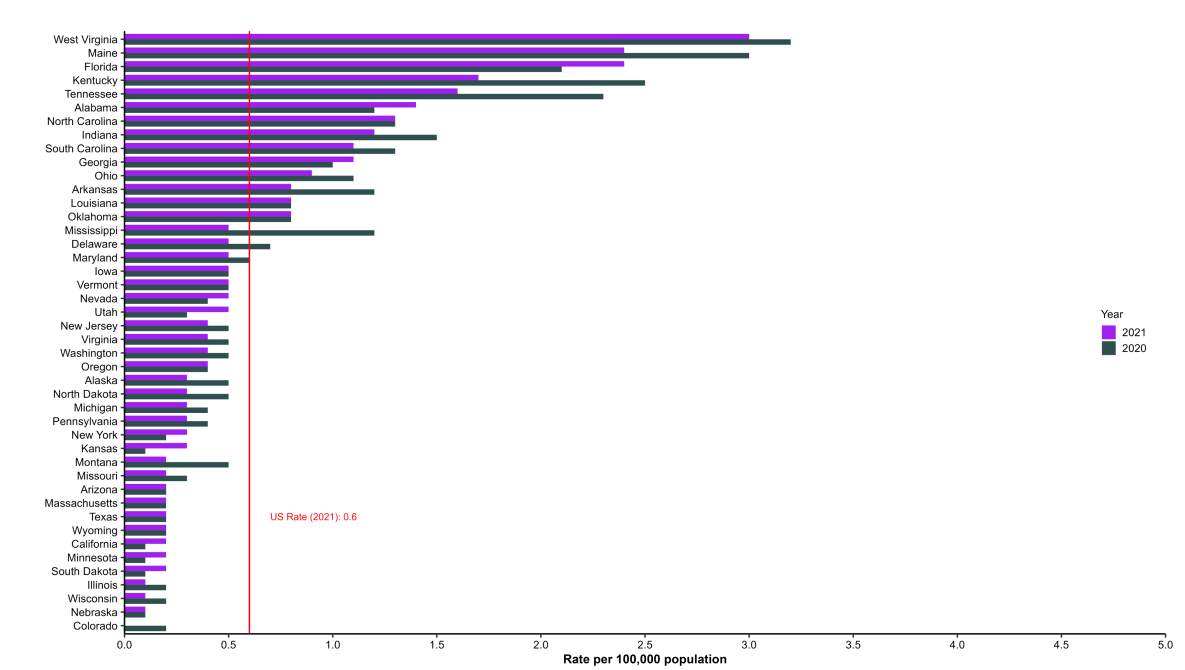
Rates* of reported cases† of acute Hepatitis B virus infection, by state or jurisdiction — United States, 2020–2021
Source: CDC, National Notifiable Diseases Surveillance System.
* Rates per 100,000 population. Rate calculations used bridged-race population estimates in 2020 and single-race estimates in 2021.
† Reported confirmed cases. For the case definition, see Acute Hepatitis B.
Only states with rates for 2020 and 2021 are shown. State/jurisdiction and year for no reported cases: Connecticut (2021, 2020), Hawaii (2021, 2020), New Hampshire (2020), New Mexico (2020), Idaho (2020); for unavailable data: District of Columbia (2021, 2020), Rhode Island (2021, 2020).
State or jurisdiction ranked in decreasing order by the 2021 rate, 2020 rate, and then alphabetical order by name.
During 2021, the rates of reported acute hepatitis B ranged from a high of 3.0 cases per 100,000 population in West Virginia to a low of 0.0 in Colorado and New Mexico (not included in Figure 2.2). The largest absolute decrease in rates from 2020–2021 was observed in Kentucky (decrease of 0.8 cases per 100,000 population), whereas the largest absolute increase was observed in Florida (increase of 0.3 per 100,000 population). Because of varying resources to conduct viral hepatitis surveillance and the relatively smaller number of acute hepatitis B virus cases reported in certain jurisdictions, wide fluctuations in annual rates occur.
Hepatitis B Figures and Tables
- Figure 2.1. Number of reported cases of acute hepatitis B virus infection and estimated infections — United States, 2014–2021
- Figure 2.2. Rates of reported acute hepatitis B virus infection, by state or jurisdiction — United States, 2020–2021
- Figure 2.3. Rates of reported cases of acute hepatitis B virus infection, by state or jurisdiction — United States, 2021
- Figure 2.4. Rates of reported cases of acute hepatitis B virus infection, by age group — United States, 2006–2021
- Figure 2.5. Rates of reported cases of acute hepatitis B virus infection, by sex — United States, 2006–2021
- Figure 2.6. Rates of reported cases of acute hepatitis B virus infection, by race/ethnicity — United States, 2006–2021
- Figure 2.7. Availability of information on risk behaviors or exposures associated with reported cases of acute hepatitis B virus infection — United States, 2021
- Figure 2.8. Rates of deaths with hepatitis B virus infection listed as a cause of death among residents, by state or jurisdiction — United States, 2021
- Table 2.1. Numbers and rates of reported cases of acute hepatitis B virus infection, by state or jurisdiction — United States, 2017–2021
- Table 2.2. Numbers and rates of reported cases of acute hepatitis B virus infection, by demographic characteristics — United States, 2017–2021
- Table 2.3. Reported risk behaviors or exposures among reported cases of acute hepatitis B virus infection — United States, 2021
- Table 2.4. Number of newly reported cases of perinatal hepatitis B virus infection, by state or jurisdiction — United States, 2021
- Table 2.5. Number and rate of newly reported cases of chronic hepatitis B virus infection, by state or jurisdiction — United States, 2021
- Table 2.6. Number and rate of newly reported cases of chronic hepatitis B virus infection, by demographic characteristics — United States, 2021
- Table 2.7. Numbers and rates of deaths with hepatitis B virus infection listed as a cause of death among residents, by state or jurisdiction — United States, 2017–2021
- Table 2.8. Numbers and rates of deaths with hepatitis B virus infections listed as a cause of death among residents, by demographic characteristics — United States, 2017–2021
