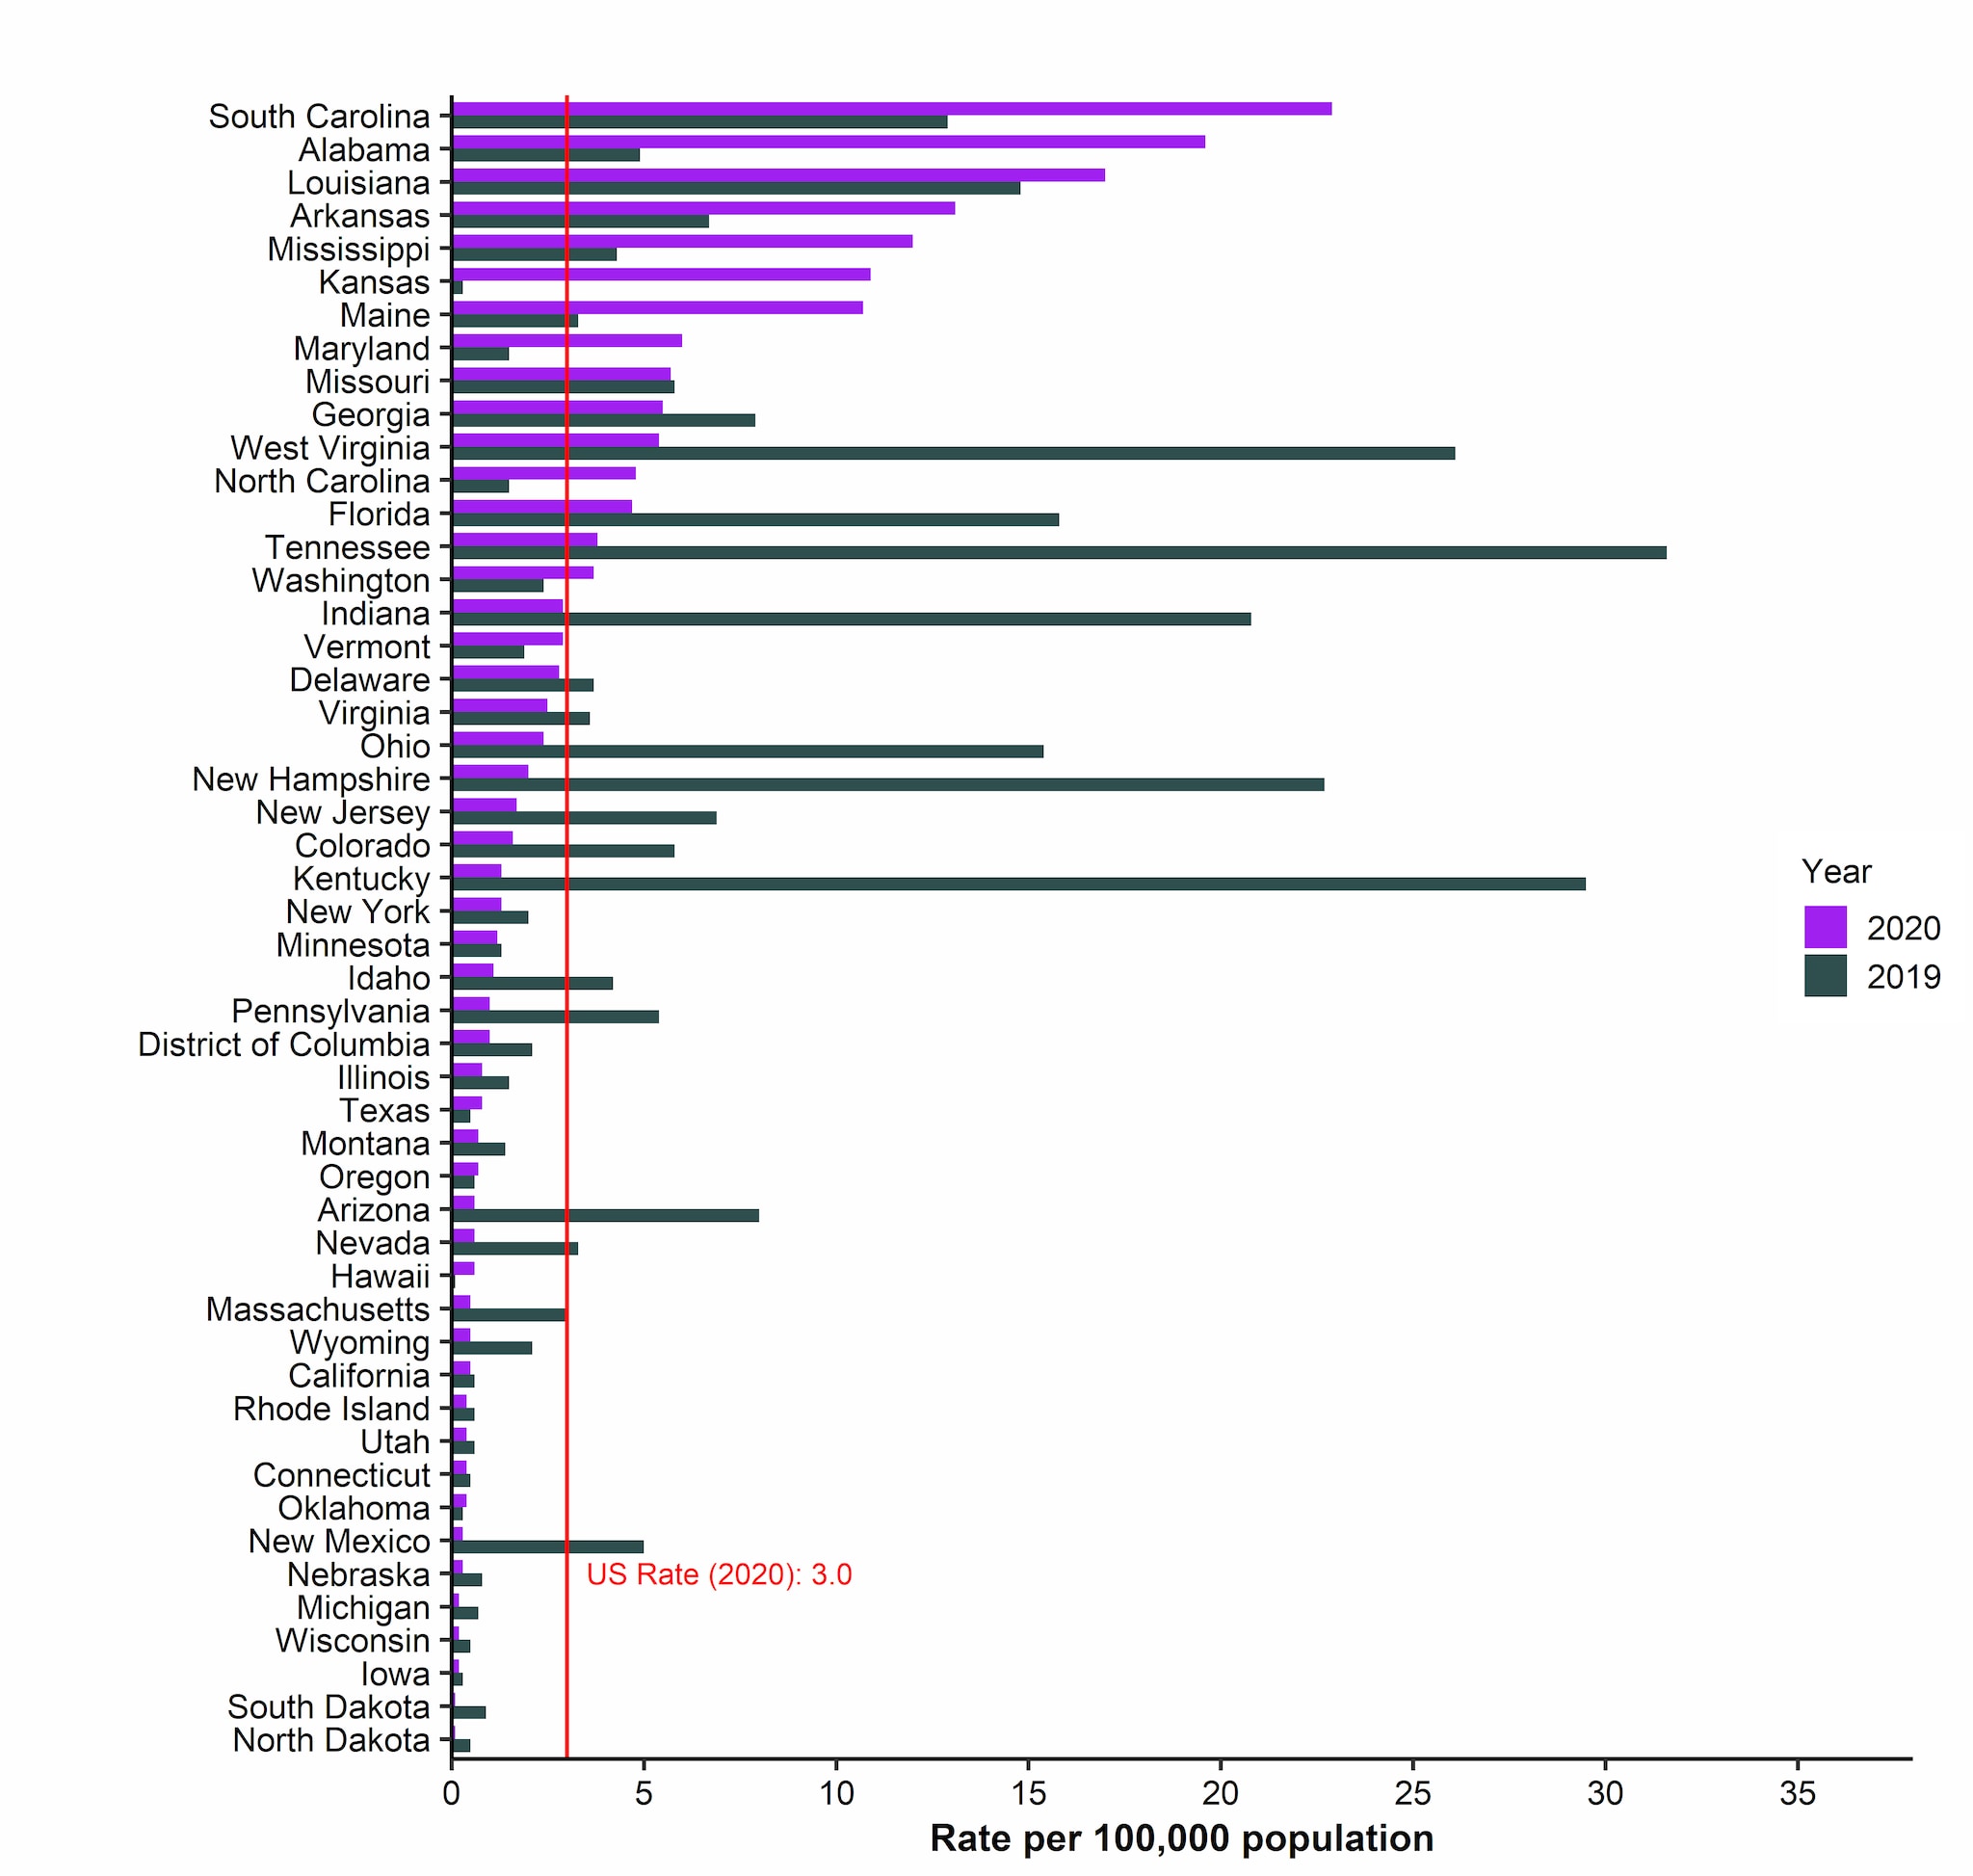
Rates* of reported cases† of hepatitis A virus infection, by state or jurisdiction — United States, 2019-2020
Downloads of this figure: PDF PPT
Source: CDC, National Notifiable Diseases Surveillance System.
* Rates per 100,000 population.
† Reported confirmed cases. For the case definition, see Acute Hepatitis A.
Alaska was not included as no hepatitis A cases were reported in 2020.
State or jurisdiction ranked in decreasing order by the 2020 rate, 2019 rate, and then alphabetical order by name.
During 2020, the rates of reported hepatitis A ranged from a high of 22.9 cases per 100,000 population in South Carolina to a low of 0.1 cases per 100,000 population in South Dakota and North Dakota. Changes in rates during 2019 and 2020 were influenced by timing of outbreaks within jurisdictions.
The largest absolute increase in rates was observed in Kansas, with a rate during 2020 of 10.9 cases per 100,000 population, 36 times the rate reported during 2019 (0.3 cases per 100,000 population).
In contrast, the largest absolute decrease in rates was observed in Kentucky, where the 2020 rate (1.3 cases per 100,00 population) decreased by 96% from the rate reported during 2019 (29.5 cases per 100,000 population), as an outbreak associated with person-to-person transmission in Kentucky was resolving.
- Figure 1.1. Number of reported cases of hepatitis A virus infection and estimated infections — United States, 2013-2020
- Figure 1.2. Rates of reported cases of hepatitis A virus infection, by state or jurisdiction — United States, 2019-2020
- Figure 1.3. Rates of reported cases of hepatitis A virus infection, by state or jurisdiction — United States, 2020
- Figure 1.4. Rates of reported cases of hepatitis A virus infection, by age group — United States, 2005-2020
- Figure 1.5. Rates of reported cases of hepatitis A virus infection, by sex — United States, 2005-2020
- Figure 1.6. Rates of reported cases of hepatitis A virus infection, by race/ethnicity — United States, 2005-2020
- Figure 1.7. Availability of information regarding risk behaviors or exposures associated with reported cases of hepatitis A virus infection — United States, 2020
- Table 1.1. Numbers and rates of reported cases of hepatitis A virus infection, by state or jurisdiction — United States, 2016-2020
- Table 1.2. Numbers and rates of reported cases of hepatitis A virus infection, by demographic characteristics — United States 2016-2020
- Table 1.3. Reported risk behaviors or exposures among reported cases of hepatitis A virus infection — United States, 2020
- Table 1.4. Numbers and rates of deaths with hepatitis A virus infection listed as a cause of death among residents, by demographic characteristics — United States, 2016-2020
