 An official website of the United States government



Physical Activity and Perceptions of the Community Walking Environment Among Cancer Survivors, National Health Interview Survey, 2024
ORIGINAL RESEARCH — Volume 23 — October 22, 2026
Jonathan Bryant-Genevier, PhD1; Michael Boring, MS1; Elizabeth A. Rohan, PhD, MSW1; Dawn M. Holman, MPH1; Anne K. Julian, PhD1; Yamisha Bermudez, PhD1; Mary Puckett, PhD1; Shixiu Ricardo, MS, CHES1; Jasmine Y. Nakayama, PhD2 (View author affiliations)
Suggested citation for this article: Bryant-Genevier J, Boring M, Rohan EA, Holman DM, Julian AK, Bermudez Y, et al. Physical Activity and Perceptions of the Community Walking Environment Among Cancer Survivors, National Health Interview Survey, 2024. Prev Chronic Dis 2026;23:260220. DOI: http://dx.doi.org/10.5888/pcd23.260220.
PEER REVIEWED
What is already known on this topic?
Physical activity can reduce cancer-specific mortality, all-cause mortality, and recurrence risk among cancer survivors. The built environment can influence the convenience and feasibility of integrating physical activity into daily activities.
What is added by this report?
The prevalence of physical inactivity among cancer survivors in the US was higher among those with multiple comorbid chronic conditions, those reporting fair or poor overall health, and those living in communities without features that support walking.
What are the implications for public health practice?
Built environment features may increase aerobic physical activity among cancer survivors. Public health practitioners and interdisciplinary partners may consider evidence-based strategies incorporating land use, environmental design, and community engagement to enhance aerobic physical activity opportunities.
Abstract
Introduction
Cancer survivors are a growing population in the US. Physical activity can reduce cancer-specific and all-cause mortality and decrease cancer recurrence risk among survivors. However, estimates of physical activity among cancer survivors by sociodemographic and health factors are not up to date.
Methods
We used data from the 2024 National Health Interview Survey of civilian, noninstitutionalized US adults to calculate the proportions of cancer survivors who were inactive, insufficiently active, and sufficiently active through meeting leisure-time aerobic physical activity guidelines (0, 1–149, and ≥150 minutes/week of moderate-intensity equivalent physical activity, respectively) by sociodemographic and health factors and examined associations between physical activity and perceptions of the local walking environment.
Results
In 2024, based on our sample (N = 3,486), an estimated 21.1 million US adults reported a history of cancer. Among cancer survivors, 33.9% (95% CI, 31.9%–35.9%) were inactive, 28.1% (95% CI, 26.3%–30.1%) were insufficiently active, and 38.0% (95% CI, 36.0%–40.0%) were sufficiently active. Cancer survivors living in communities with features that support walking reported lower levels of inactivity compared with survivors living in communities without such supports. Physical inactivity was higher among those with multiple comorbid chronic conditions and those reporting fair or poor overall health.
Conclusion
Levels of physical activity among cancer survivors are low, especially for survivors with additional comorbid chronic conditions or who report fair or poor overall health. Evidence-based physical activity interventions that address land use and environmental design alongside community engagement to promote walking may increase physical activity among cancer survivors.
Introduction
Cancer survivorship is an expanding public health concern. The number of people alive in the US who have ever been diagnosed with cancer (cancer survivors) is projected to increase from 18 million in 2022 to 26 million by 2040 (1–3). This growth reflects an aging population and improvements in cancer prognosis driven by increased screening, earlier detection, and advances in treatment (4,5). Nearly half of survivors have lived 10 years or more since diagnosis, and almost 1 in 5 have lived 20 years or more (1). An increasing proportion of survivors also live with multiple chronic comorbid conditions, which complicate clinical management, increases burdens on care teams and caregivers, and are associated with more days of poor mental and physical health and elevated mortality risk (6–8).
Regular physical activity can provide numerous health benefits for cancer survivors, including reduced cancer-specific and all-cause mortality, lower risk of recurrence, fewer comorbidities, mitigation of treatment-related side effects, and improved emotional and psychosocial health (9–12). Increasing physical activity among adults with low physical activity has substantial health benefits (13). In addition, most comprehensive cancer control plans incorporate some planning to improve physical activity in their populations, indicating a desire to support survivors in this area (14). However, many cancer survivors do not achieve recommended activity levels. In 2020, 55% of cancer survivors reported (9) not meeting the federal aerobic physical activity guidelines described in Physical Activity Guidelines for Americans (10,12) (ie, ≥150 minutes/week of moderate-intensity activity, 75 minutes/week of vigorous-intensity activity, or an equivalent combination of moderate- and vigorous-intensity activity) (9). The American Cancer Society Physical Activity Guideline for Cancer Survivors recommends the same levels of physical activity and additionally recommends that physical activity assessment and counseling begin as soon as possible after a cancer diagnosis and that survivors consult their treatment team before starting or changing their physical activity plan (10).
Community environments can be designed to promote many forms of aerobic physical activity, including running, biking, and walking, which is a common and accessible form of physical activity among people with disabilities who walk or use assistive devices (15–22). For example, adults living in more walkable neighborhoods are more likely to engage in walking (20,23). Built environment features, such as proximity to everyday destinations, land-use patterns, and access to public transit, influence the convenience and feasibility of integrating walking and other forms of physical activity into daily activities.
Previous research has studied self-reported and accelerometer-measured physical activity, including walking behaviors, among cancer survivors (22,24–26). However, estimates of the prevalence of physical activity and built environment features among all cancer survivors are not current (9,27). We analyzed data from a sample of US cancer survivors from nationally representative data to update estimates of the prevalence of leisure-time aerobic physical activity levels among cancer survivors by sociodemographic and health factors. We also examined associations with features of the local community walking environment individually.
Methods
We used adult interview data from the 2024 National Health Interview Survey (NHIS). The NHIS is a continuous cross-sectional household survey designed to generate a nationally representative sample of the noninstitutionalized US civilian population and is described elsewhere (28). We measured self-reported history of cancer (ie, cancer survivor) as a response of yes to the question, “Have you ever been told by a doctor or other health professional that you had cancer or a malignancy of any kind?” This survey question identified 4,434 cancer survivors among 32,629 respondents. We excluded respondents if their only reported cancer diagnosis was nonmelanoma skin cancer or unknown skin cancer (n = 948), resulting in an analytic sample of 3,486 respondents. As part of NHIS interviews, respondents self-reported their age, sex, race and ethnicity, education level, marital status, height and weight (used to determine body mass index), health status, smoking status, and disability status (29). We used the 2023 National Center for Health Statistics Urban–Rural Classification Scheme for Counties to categorize respondents’ county of residence according to urbanization levels (29). The survey also collects data on the number of chronic conditions reported by respondents. These were measured according to affirmative responses to the following conditions: arthritis, chronic obstructive pulmonary disease, cirrhosis or hepatitis, dementia, diabetes, heart disease, hypertension, stroke, and weak or failing kidneys.
Leisure-time physical activity levels were assigned according to aerobic physical activity guidelines as inactive (0 minutes/week of activity), insufficiently active (1–149 minutes/week), or sufficiently active (≥150 minutes/week, ie, meeting federal guidelines) using self-reported frequency and duration of moderate-intensity equivalent aerobic activity (in which 1 minute of vigorous-intensity activity is equivalent to 2 minutes of moderate-intensity activity) (12). The NHIS assesses perceptions of the local walking environment by determining the presence of 9 features (6 supports and 3 barriers) of the environment, asking participants, “Where you live, are there . . . that you can walk to?” The 6 supports are 1) roads, sidewalks, paths, or trails (walking routes), 2) shops, stores, or markets (shopping), 3) bus or transit stops (transit), 4) places that help you relax, clear your mind, and reduce stress (relaxing), 5) places like movies, libraries, or places of worship (other), and 6) sidewalks. The 3 barriers were assessed similarly by asking participants, “Where you live, does . . . make it unsafe for you to walk?” These were traffic, crime, and dogs or other animals (animals). To assess weather-related barriers to walking, a Likert-type item asked, “How often does the weather make you less likely to walk?” Possible responses were almost always, most of the time, some of the time, and never.
We used the survey package in R version 4.5.0 (R Foundation for Statistical Computing) for all analyses (30,31). We stratified sample characteristics by sex due to differences in cancer type and prevalence by sex, although subsequent analyses of physical activity outcomes were unstratified (sex was included along with other characteristics as a variable). We calculated weighted prevalences and 95% CIs and estimated population counts, accounting for the complex survey design and adjusting for nonresponse (29). We used Rao–Scott χ2 tests to assess differences in physical activity levels among groups. To account for multiple comparisons, we conducted pairwise Bonferroni-corrected t tests separately for each physical activity level. All results were unadjusted, and significance was defined at P < .05. Estimates that did not meet reliability criteria of minimum effective sample size (≥30) and absolute and relative CI width were suppressed in accordance with National Center for Health Statistics data presentation standards for proportions (32).
Results
In 2024, an estimated 21.1 million US adults (unweighted N = 3,486) reported a history of cancer other than nonmelanoma skin cancer or unknown skin cancer (55.4% female, 44.6% male) (Table 1). Of these, 40.0% were younger than 65 years (46.8% female, 31.5% male). Approximately one-third (34.0% overall, 35.2% female, 32.4% male) reported their health status as excellent or very good. Approximately one-quarter of cancer survivors (25.8% overall, 28.6% female, 22.4% male) reported no other chronic comorbid conditions beyond their cancer diagnosis, whereas nearly half (47.7% overall, 43.1% female, 53.3% male) reported 2 or more additional chronic conditions. An estimated 3 million cancer survivors reported a lot of difficulty walking or climbing steps or being unable to perform these activities at all (mobility disability) (14.3% overall, 15.2% female, 13.3% male).
Among cancer survivors, 33.9% (34.9% female, 32.7% male) were inactive, 28.1% (29.7% female, 26.2% male) were insufficiently active, and 38.0% (35.5% female, 41.2% male) were sufficiently active during leisure time in 2024 (Table 2). The prevalence of inactivity differed by age overall, with prevalence highest among cancer survivors aged 75 years or older (43.1%). Males were more likely than females (41.2% vs 35.5%) and non-Hispanic White adults (40.2%) were more likely than non-Hispanic Black (27.6%) or Hispanic adults (29.8%) to be sufficiently active. The prevalence of inactivity was higher among cancer survivors who reported having lower education levels (vs higher education levels), being widowed (vs being married/partnered or single/separated), living in rural areas (vs living in large central metropolitan areas), having obesity (vs being underweight/having a healthy weight or being overweight), and currently smoking (vs formerly or never smoking). Half of cancer survivors who described their health status as excellent or very good (57.8%) or reported no additional comorbid chronic conditions (51.7%) were sufficiently active. Generally, inactivity was more common among cancer survivors reporting poorer self-reported health status and more chronic diseases compared with those reporting better health factors. Cancer survivors who reported mobility disability were more likely to be inactive (64.6%) relative to both survivors who reported any other disability (45.9%) and those who reported no disability (27.7%).
Cancer survivors living in communities with walking supports were less likely to report being physically inactive and more likely to report being sufficiently active relative to cancer survivors living in communities without those walking supports (Figure 1). Differences for inactive and sufficiently active categories were significant for all 6 types of support (P < .001 for t tests). Physical inactivity was highest among cancer survivors who reported no access to walking routes (49.3%; 95% CI, 43.7%–55.0%) and no access to relaxing places (48.2%; 95% CI, 44.3%–52.1%) in their local walking environment.
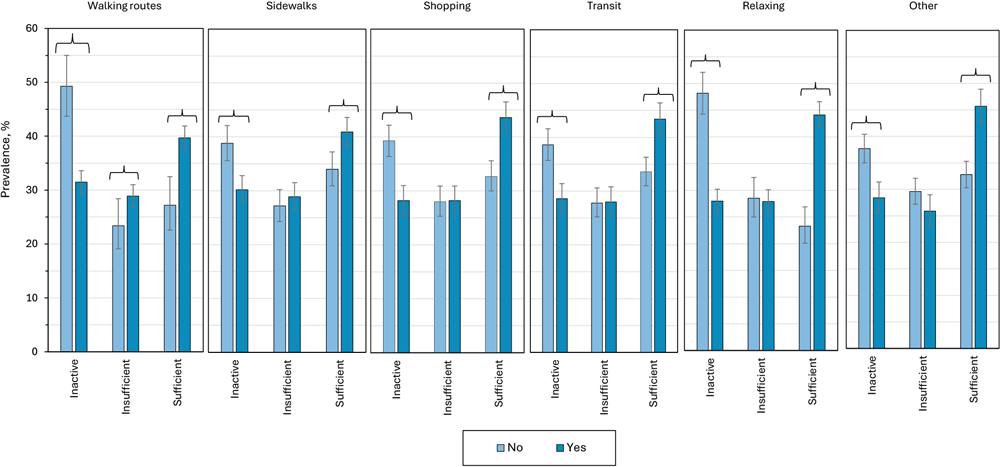

Figure 1.
Unadjusted prevalence of leisure-time aerobic physical activity levels among self-reported cancer survivors by presence of community walking environment features that support walking in the local community. Physical activity levels are defined as inactive (0 minutes/week of aerobic activity), insufficiently active (1–149 minutes/week), or sufficiently active (≥150 minutes/week, ie, meeting federal guidelines). “Yes” indicates the presence of the support, and “No” indicates the absence of the support. Brackets indicate significant differences. Data source: National Health Interview Survey, 2024. [A tabular version of this figure is available.]
Cancer survivors who reported crime as a barrier to walking safely in their community (10.5%; n = 351) were more likely to be physically inactive (44.6%; 95% CI, 38.3%–51.0%) and less likely to be sufficiently active (29.0%; 95% CI, 23.2%–35.5%) relative to cancer survivors reporting no crime (32.7% inactive; 95% CI, 30.6%–34.9% and 39.0% sufficiently active; 95% CI, 36.9%–41.2%) (Figure 2).
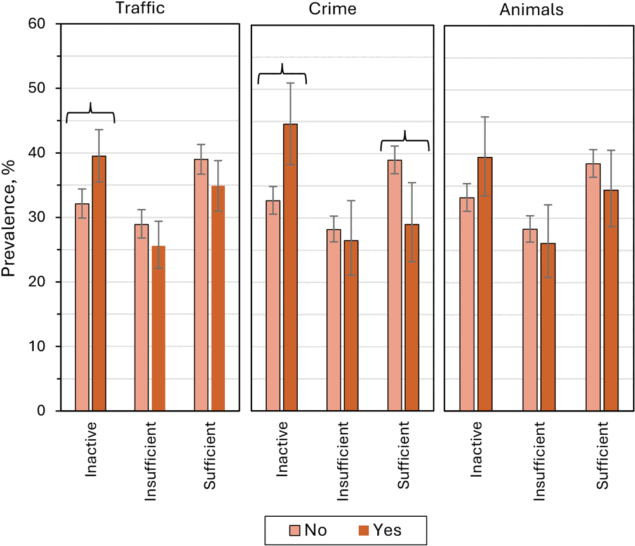
Figure 2.
Unadjusted prevalence of leisure-time aerobic physical activity levels among self-reported cancer survivors by presence of community walking environment features that make it unsafe to walk (barriers) in the local community. Physical activity levels are defined as inactive (0 minutes/week of aerobic activity), insufficiently active (1–149 minutes/week), or sufficiently active (≥150 minutes/week, ie, meeting federal guidelines). “Yes” indicates the presence of the barrier, and “No” indicates the absence of the barrier. Brackets indicate significant differences. Data source: National Health Interview Survey, 2024. [A tabular version of this figure is available.]
Nearly half of inactive cancer survivors (49.5%; 95% CI, 45.1%–53.9%) reported that weather-related barriers to walking almost always made them less likely to walk, whereas among sufficiently active survivors, 23.0% (95% CI, 19.5–26.8%) reported that weather-related barriers to walking almost always made them less likely to walk (Figure 3).
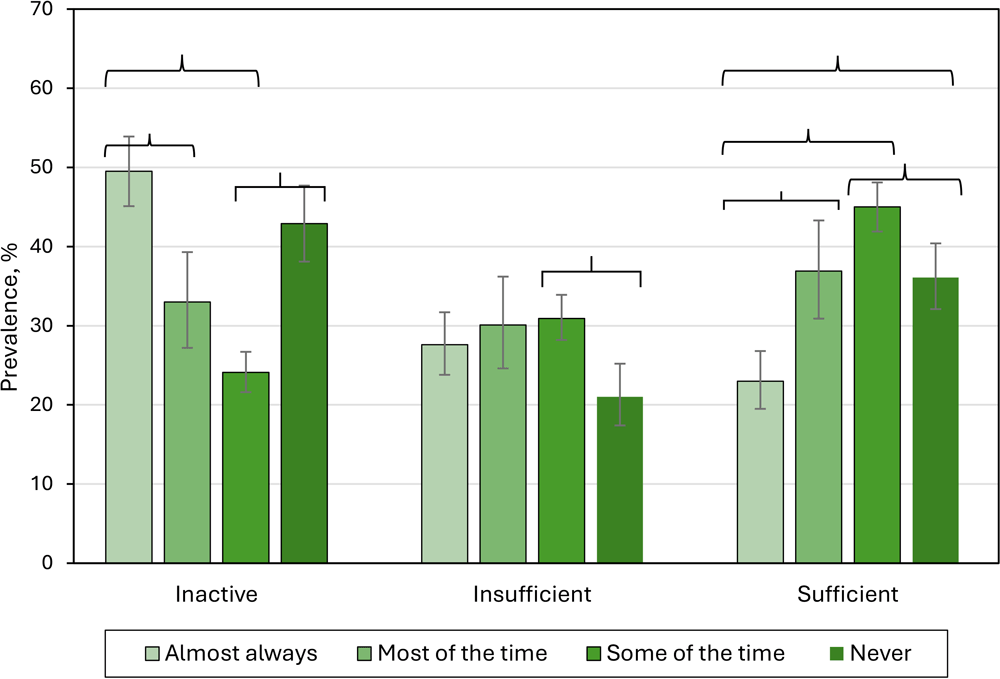
Figure 3.
Unadjusted prevalence of leisure-time aerobic physical activity levels among self-reported cancer survivors by frequency of weather-related barriers to walking. Physical activity levels are defined as inactive (0 minutes/week of aerobic activity), insufficiently active (1–149 minutes/week), or sufficiently active (≥150 minutes/week, ie, meeting federal guidelines). The survey question asked, “How often does the weather make you less likely to walk?” Brackets indicate significant differences. Data source: National Health Interview Survey, 2024. [A tabular version of this figure is available.]
Discussion
Our study indicates that among cancer survivors, roughly one-third each were inactive, insufficiently active, and sufficiently active in 2024, and that associations exist between physical activity and sociodemographic factors, health factors, and perceptions of the local walking environment. Overall, 62% of cancer survivors did not meet federal aerobic physical activity guidelines (were either inactive or insufficiently active). The prevalence of inactivity was higher among survivors with multiple chronic conditions or those reporting fair or poor health status, consistent with prior research (6,7,25,33). Cancer survivors reporting mobility disability were more likely to be inactive, as were those living in counties classified as rural compared with survivors living in large central metropolitan counties. These findings are also consistent with prior work highlighting mobility limitations and geographic disparities in built environment features as factors affecting regular movement (9). Interventions to increase activity and decrease sedentary lifestyles among cancer survivors, particularly for survivors with multiple chronic conditions (7), are an important health promotion objective because the benefits of physical activity are greatest among those who are least active.
The Community Preventive Services Task Force (Community Guide) recommends built environment approaches as one way to increase physical activity. Examples include combining transportation system interventions with land use and environmental design and combining park, trail, and greenway infrastructure interventions with community engagement strategies, such as structured physical activity programs and social interaction opportunities (18,34,35). Our study suggests that these approaches may also apply to cancer survivors because survivors living in communities with access to features that support walking had higher levels of physical activity compared with survivors without such access. Interventions designed to increase physical activity among cancer survivors, such as community engagement and programs promoting structured physical activity and social interaction, can be paired with efforts to increase access to built and natural environment features that promote physical activity, especially among survivors more likely to be inactive, such as survivors managing multiple chronic conditions (36). By improving access to safe public spaces designed for physical activity, relaxation, and social interaction, these combined interventions may increase the number of survivors engaging in physical activity. For example, walking groups among widowed survivors may promote physical activity along with social cohesion.
Strengths and limitations
Study strengths include analysis of a large sample of US cancer survivors using nationally representative data. Limitations include self-reported data subject to social desirability and recall bias and a cross-sectional survey design that limits inferences of causality and directionality of observed associations. The study population included cancer survivors reporting mobility and other disabilities, limiting direct comparison with previous reports that excluded these groups. The analysis did not consider cancer type, severity of disease, or time since cancer diagnosis, each of which may affect access to and ability to engage in physical activity. Built environment features that influence walking in rural areas may be different from those in urban areas and may not have been fully captured in the survey. The aerobic physical activity outcome captures all leisure-time activities that elevate heart rate to moderate or vigorous levels regardless of activity type or location and may not reflect use of near-home built environment features. This study did not account for muscle-strengthening activity, which is recommended by the Physical Activity Guidelines for Americans and American Cancer Society Physical Activity Guideline for Cancer Survivors (10,12). Our study results were not adjusted for confounding, which was beyond the scope of this descriptive report; observed differences between groups should be interpreted with caution because they do not account for other factors that may influence the relationship between physical activity and a variable. Furthermore, the sample adult response rate for NHIS 2024 was 47.9%; however, base weights were adjusted for nonresponse (28).
Conclusion
In 2024, most cancer survivors did not meet the federal guidelines for aerobic physical activity during leisure time, with 1 in 3 reporting inactivity. Among built environment features, we observed the largest differences in physical activity for survivors reporting access to relaxing destinations and walking routes within walking distance relative to those without access. Our findings support previous research that showed that environmental features supporting walking were positively associated with increased physical activity among cancer survivors (9) and expand this area of research by describing associations with various physical activity levels and examining associations with supports individually. Built environment features that encourage walking may increase physical activity among cancer survivors. To enhance opportunities for active transportation and leisure-time physical activity among cancer survivors, public health practitioners and other partners across a wide range of sectors may consider working together to implement and evaluate evidence-based strategies that include land use, environmental design, and community engagement.
Acknowledgments
The findings and conclusions in this report are those of the authors and do not necessarily represent the official position of the Centers for Disease Control and Prevention (CDC). NHIS was funded by the US government. All authors are federal government employees. The authors declare no potential conflicts of interest with respect to the research, authorship, or publication of this article. No copyrighted material, surveys, instruments, or tools were used in the research described in this article. This activity was reviewed by CDC, deemed not research, and was conducted according to applicable federal law and CDC policy.
Author Information
Corresponding Author: Jonathan Bryant-Genevier, PhD, Division of Cancer Prevention and Control, National Center for Chronic Disease Prevention and Health Promotion, Centers for Disease Control and Prevention, 4770 Buford Hwy, Atlanta, GA 30341-3717 (phv4@cdc.gov).
Author Affiliations: 1Division of Cancer Prevention and Control, National Center for Chronic Disease Prevention and Health Promotion, Centers for Disease Control and Prevention, Atlanta, Georgia. 2Division of Nutrition, Physical Activity, and Obesity, National Center for Chronic Disease Prevention and Health Promotion, Centers for Disease Control and Prevention, Atlanta, Georgia.
References
- Tonorezos E, Devasia T, Mariotto AB, Mollica MA, Gallicchio L, Green P, et al. . Prevalence of cancer survivors in the United States. J Natl Cancer Inst. 2024;116(11):1784–1790. PubMed doi:10.1093/jnci/djae135
- Sherman RL, Firth AU, Henley SJ, Siegel RL, Negoita S, Sung H, et al. . Annual report to the nation on the status of cancer, featuring state-level statistics after the onset of the COVID-19 pandemic. Cancer. 2025;131(9):e35833. PubMed doi:10.1002/cncr.35833
- Surveillance Research Program, National Cancer Institute. SEER*Explorer: an interactive website for SEER cancer statistics. Accessed December 8, 2025. https://seer.cancer.gov/statistics-network/explorer
- Weir HK, Thompson TD, Stewart SL, White MC. Cancer incidence projections in the United States between 2015 and 2050. Prev Chronic Dis. 2021;18:E59. PubMed doi:10.5888/pcd18.210006
- Ma ZQ, Richardson LC. Cancer screening prevalence and associated factors among US adults. Prev Chronic Dis. 2022;19:E22. PubMed doi:10.5888/pcd19.220063
- Jiang C, Deng L, Karr MA, Wen Y, Wang Q, Perimbeti S, et al. . Chronic comorbid conditions among adult cancer survivors in the United States: results from the National Health Interview Survey, 2002–2018. Cancer. 2022;128(4):828–838. PubMed doi:10.1002/cncr.33981
- Tsai MH, Wu YH, Bevel MS. The relationship of chronic disease conditions to mental and physical health among cancer survivors. Support Care Cancer. 2023;31(6):364. PubMed doi:10.1007/s00520-023-07841-0
- Nunes BP, Flores TR, Mielke GI, Thumé E, Facchini LA. Multimorbidity and mortality in older adults: a systematic review and meta-analysis. Arch Gerontol Geriatr. 2016;67:130–138. PubMed doi:10.1016/j.archger.2016.07.008
- Narcisse M-RW, Wang ML, Schootman M, DelNero P, Schwarz AG, McElfish PA. Physical activity among cancer survivors: do neighborhood walkability and metropolitan size play a role? J Cancer Surviv. 2025;19(5):1726–1738. PubMed doi:10.1007/s11764-024-01584-5
- Rock CL, Thomson CA, Sullivan KR, Howe CL, Kushi LH, Caan BJ, et al. . American Cancer Society nutrition and physical activity guideline for cancer survivors. CA Cancer J Clin. 2022;72(3):230–262. PubMed doi:10.3322/caac.21719
- McTiernan A, Friedenreich CM, Katzmarzyk PT, Powell KE, Macko R, Buchner D, et al. ; 2018 Physical Activity Guidelines Advisory Committee. Physical activity in cancer prevention and survival: a systematic review. Med Sci Sports Exerc. 2019;51(6):1252–1261. PubMed doi:10.1249/MSS.0000000000001937
- US Department of Health and Human Services. Physical activity guidelines for Americans, 2nd edition. US Department of Health and Human Services; 2018. Accessed August 4, 2026. https://health.gov/sites/default/files/2019-09/Physical_Activity_Guidelines_2nd_edition.pdf
- Ekelund U, Tarp J, Steene-Johannessen J, Hansen BH, Jefferis B, Fagerland MW, et al. . Dose-response associations between accelerometry measured physical activity and sedentary time and all cause mortality: systematic review and harmonised meta-analysis. BMJ. 2019;366:l4570. PubMed doi:10.1136/bmj.l4570
- Puckett M, Neri A, Underwood JM, Stewart SL. Nutrition and physical activity strategies for cancer prevention in current national comprehensive cancer control program plans. J Community Health. 2016;41(5):1013–1020. PubMed doi:10.1007/s10900-016-0184-8
- Kärmeniemi M, Lankila T, Ikäheimo T, Koivumaa-Honkanen H, Korpelainen R. The built environment as a determinant of physical activity: a systematic review of longitudinal studies and natural experiments. Ann Behav Med. 2018;52(3):239–251. PubMed doi:10.1093/abm/kax043
- Omura JD, Carlson SA, Brown DR, Hopkins DP, Kraus WE, Staffileno BA, et al. ; American Heart Association Physical Activity Committee of the Council on Lifestyle and Cardiometabolic Health; Council on Cardiovascular and Stroke Nursing; Council on Clinical Cardiology. Built environment approaches to increase physical activity: a science advisory from the American Heart Association. Circulation. 2020;142(11):e160–e166. PubMed doi:10.1161/CIR.0000000000000884
- Sallis JF, Floyd MF, Rodríguez DA, Saelens BE. Role of built environments in physical activity, obesity, and cardiovascular disease. Circulation. 2012;125(5):729–737. PubMed doi:10.1161/CIRCULATIONAHA.110.969022
- The Community Preventive Services Task Force (CPSTF). Physical Activity: Built Environment Approaches Combining Transportation System Interventions with Land Use and Environmental Design. The Community Preventive Services Task Force; 2016.
- Hajna S, Ross NA, Brazeau AS, Bélisle P, Joseph L, Dasgupta K. Associations between neighbourhood walkability and daily steps in adults: a systematic review and meta-analysis. BMC Public Health. 2015;15(1):768. PubMed doi:10.1186/s12889-015-2082-x
- Clevenger KA, Berrigan D, Patel S, Saint-Maurice PF, Matthews CE. Relationship between neighborhood walkability and the prevalence, type, timing, and temporal characteristics of walking. Health Place. 2023;80:102983. PubMed doi:10.1016/j.healthplace.2023.102983
- Watson KB, Whitfield GP, Thomas JV, Berrigan D, Fulton JE, Carlson SA. Associations between the National Walkability Index and walking among US Adults — National Health Interview Survey, 2015. Prev Med. 2020;137:106122. PubMed doi:10.1016/j.ypmed.2020.106122
- Tribby CP, Alismail S, Nukavarapu N, Yang JA, Jankowska MM. Estimates of walking prevalence and volume for U.S. cancer survivors and those without cancer: overall, by sex, and by race and ethnicity. J Cancer Surviv. 2026;20(1):347–359. PubMed doi:10.1007/s11764-024-01729-6
- Office of the Surgeon General (US). Step it up! The Surgeon General’s call to action to promote walking and walkable communities. US Department of Health and Human Services; 2015. Accessed August 4, 2026. https://www.ncbi.nlm.nih.gov/pubmed/30860691
- Tarasenko Y, Chen C, Schoenberg N. Self-reported physical activity levels of older cancer survivors: results from the 2014 National Health Interview Survey. J Am Geriatr Soc. 2017;65(2):e39–e44. PubMed doi:10.1111/jgs.14589
- Smith WA, Nolan VG, Robison LL, Hudson MM, Ness KK. Physical activity among cancer survivors and those with no history of cancer — a report from the National Health and Nutrition Examination Survey 2003–2006. Am J Transl Res. 2011;3(4):342–350. PubMed
- Boyd P, Lowry M, Morris KL, Land SR, Agurs-Collins T, Hall K, et al. . Health behaviors of cancer survivors and population controls from the National Health Interview Survey (2005–2015). JNCI Cancer Spectr. 2020;4(5):pkaa043. PubMed doi:10.1093/jncics/pkaa043
- Wojcik KM, Wilson OWA, Shiels MS, Sheppard VB, Jayasekera J. Racial, ethnic, and socioeconomic disparities in meeting physical activity guidelines among female breast cancer survivors in the United States. Cancer Epidemiol Biomarkers Prev. 2024;33(12):1610–1622. PubMed doi:10.1158/1055-9965.EPI-24-0650
- National Center for Health Statistics. National Health Interview Survey: 2024 survey description. National Center for Health Statistics; 2024. Accessed August 4, 2026. https://ftp.cdc.gov/pub/Health_Statistics/NCHS/Dataset_Documentation/NHIS/2024/srvydesc-508.pdf
- National Center for Health Statistics. 2024 NHIS questionnaires, datasets, and documentation: public-use data file and documentation. National Center for Health Statistics; 2024. Accessed August 4, 2026. https://www.cdc.gov/nchs/nhis/documentation/2024-nhis.html
- R Core Team. R: A Language and Environment for Statistical Computing. R Foundation for Statistical Computing; 2025.
- Lumley T. Analysis of complex survey samples. J Stat Softw. 2004;9(1):1–19.
- Parker JD, Talih M, Malec DJ, Beresovsky V, Carroll M, Gonzalez JF, et al. . National Center for Health Statistics data presentation standards for proportions. Vital Health Stat 2. 2017;(175):1–22. PubMed doi:10.18637/jss.v009.i08
- Albini A, La Vecchia C, Magnoni F, Garrone O, Morelli D, Janssens JP, et al. . Physical activity and exercise health benefits: cancer prevention, interception, and survival. Eur J Cancer Prev. 2025;34(1):24–39. PubMed doi:10.1097/CEJ.0000000000000898
- Community Preventive Services Task Force (CPSTF). Physical Activity: Park, Trail, and Greenway Infrastructure Interventions to Increase Physical Activity. The Community Preventive Service Task Force; 2021.
- Jacob V, Reynolds JA, Chattopadhyay SK, Hopkins DP, Brown DR, Devlin HM, et al. . Parks, trails, and greenways for physical activity: a Community Guide systematic economic review. Am J Prev Med. 2024;66(6):1089–1099. PubMed doi:10.1016/j.amepre.2024.01.021
- Covington KR, Hidde MC, Pergolotti M, Leach HJ. Community-based exercise programs for cancer survivors: a scoping review of practice-based evidence. Support Care Cancer. 2019;27(12):4435–4450. PubMed doi:10.1007/s00520-019-05022-6
Tables
| Characteristic | Total | Male | Female | ||||
|---|---|---|---|---|---|---|---|
| No. | Population (millions) | % (95% CI) | No. | % (95% CI) | No. | % (95% CI) | |
| Overall | 3,486 | 21.1 | — | 1,478 | 44.6 (42.5–46.7) | 2,008 | 55.4 (53.3–57.5) |
| Age group, yb | |||||||
| 18–39 | 133 | 1.2 | 5.6 (4.4–6.7) | 41 | 4.2 (2.8–5.5) | 92 | 6.7 (5.1–8.3) |
| 40–64 | 965 | 7.2 | 34.4 (32.4–36.4) | 325 | 27.3 (24.3–30.2) | 640 | 40.1 (37.3–42.8) |
| 65–74 | 1,088 | 5.7 | 27.1 (25.5–28.8) | 494 | 28.8 (26.1–31.4) | 594 | 25.8 (23.6–28.0) |
| ≥75 | 1,292 | 6.9 | 32.9 (31.1–34.8) | 615 | 39.8 (37.0–42.7) | 677 | 27.4 (25.1–29.7) |
| Race and ethnicity | |||||||
| Hispanic | 229 | 1.7 | 8.1 (6.8–9.4) | 87 | 7.8 (5.8–9.7) | 142 | 8.4 (6.7–10.0) |
| Non-Hispanic Black | 279 | 2.0 | 9.3 (7.8–10.8) | 123 | 9.5 (7.5–11.5) | 156 | 9.1 (7.2–11.0) |
| Non-Hispanic White | 2,803 | 16.2 | 76.5 (74.4–78.6) | 1,211 | 78.2 (75.3–81.1) | 1,592 | 75.2 (72.5–77.9) |
| Non-Hispanic Other | 175 | 1.3 | 6.1 (4.9–7.2) | 57 | 4.5 (3.0–6.1) | 118 | 7.3 (5.6–9.0) |
| Education level | |||||||
| Less than high school | 277 | 2.0 | 9.3 (8.0–10.6) | 121 | 10.5 (8.4–12.7) | 156 | 8.4 (6.7–10.0) |
| High school or equivalent | 893 | 5.5 | 26.1 (24.2–27.9) | 372 | 26.9 (24.1–29.7) | 521 | 25.4 (23.0–27.8) |
| Some college | 984 | 5.9 | 28.2 (26.2–30.1) | 375 | 24.4 (21.7–27.1) | 609 | 31.2 (28.7–33.7) |
| College | 1,325 | 7.7 | 36.4 (34.4–38.5) | 607 | 38.1 (35.2–41.1) | 718 | 35.0 (32.5–37.6) |
| Marital status | |||||||
| Married/partnered | 1,697 | 13.1 | 64.5 (62.6–66.5) | 851 | 72.7 (70.1–75.3) | 846 | 58.0 (55.3–60.7) |
| Widowed | 707 | 2.9 | 14.0 (12.7–15.3) | 188 | 8.8 (7.2–10.3) | 519 | 18.2 (16.3–20.1) |
| Single/separated | 963 | 4.4 | 21.5 (19.9–23.1) | 382 | 18.5 (16.3–20.7) | 581 | 23.8 (21.6–26.0) |
| Urban–rural classification | |||||||
| Large central metropolitan | 837 | 5.7 | 26.9 (24.4–29.5) | 341 | 25.3 (21.9–28.7) | 496 | 28.3 (25.2–31.3) |
| Large fringe metropolitan | 711 | 5.3 | 24.9 (22.2–27.6) | 325 | 26.0 (22.4–29.5) | 386 | 24.0 (20.9–27.1) |
| Medium and small metropolitan | 1,034 | 6.7 | 31.6 (28.3–34.8) | 454 | 33.7 (29.5–37.9) | 580 | 29.9 (26.5–33.3) |
| Rural | 904 | 3.5 | 16.6 (14.9–18.3) | 358 | 15.0 (12.8–17.3) | 546 | 17.8 (15.7–20.0) |
| BMI category | |||||||
| Underweight/healthy weight (<25 kg/m2) | 1,129 | 6.7 | 32.4 (30.5–34.3) | 427 | 27.5 (25.0–30.1) | 702 | 36.4 (33.8–39.0) |
| Overweight (≥25 to <30 kg/m2) | 1,184 | 7.2 | 34.8 (32.8–36.8) | 621 | 42.5 (39.5–45.5) | 563 | 28.5 (26.0–31.0) |
| Obesity (≥30 kg/m2) | 1,115 | 6.8 | 32.8 (30.8–34.7) | 424 | 30.0 (27.2–32.8) | 691 | 35.1 (32.5–37.6) |
| Health status | |||||||
| Excellent/very good | 1,235 | 7.2 | 34.0 (32.1–35.9) | 509 | 32.4 (29.7–35.2) | 726 | 35.2 (32.5–37.8) |
| Good | 1,205 | 7.5 | 35.4 (33.4–37.4) | 517 | 36.8 (33.9–39.8) | 688 | 34.3 (31.7–36.8) |
| Fair/poor | 1,044 | 6.5 | 30.6 (28.6–32.6) | 451 | 30.7 (27.7–33.7) | 593 | 30.5 (28.0–33.1) |
| Smoking status | |||||||
| Current | 340 | 1.9 | 9.3 (8.1–10.5) | 140 | 8.4 (6.7–10.1) | 200 | 10.1 (8.4–11.7) |
| Former | 1,264 | 7.4 | 35.8 (33.9–37.8) | 598 | 40.7 (37.7–43.7) | 666 | 32.0 (29.5–34.4) |
| Never | 1,808 | 11.3 | 54.8 (52.8–56.9) | 700 | 50.8 (47.7–54.0) | 1,108 | 58.0 (55.3–60.7) |
| No. of chronic comorbid conditions (beyond cancer diagnosis)c | |||||||
| 0 | 803 | 5.5 | 25.8 (23.9–27.7) | 305 | 22.4 (19.7–25.1) | 498 | 28.6 (26.0–31.1) |
| 1 | 945 | 5.6 | 26.6 (24.8–28.3) | 369 | 24.4 (21.7–27.0) | 576 | 28.3 (25.9–30.8) |
| 2 | 812 | 4.8 | 22.6 (20.8–24.3) | 361 | 24.6 (21.9–27.3) | 451 | 20.9 (18.8–23.1) |
| ≥3 | 926 | 5.3 | 25.1 (23.3–26.9) | 443 | 28.7 (25.9–31.4) | 483 | 22.2 (19.9–24.5) |
| Disabilityd | |||||||
| Mobility disability | 527 | 3.0 | 14.3 (12.9–15.8) | 197 | 13.3 (11.2–15.4) | 330 | 15.2 (13.2–17.2) |
| Other disability | 185 | 1.2 | 5.5 (4.6–6.5) | 86 | 6.1 (4.6–7.5) | 99 | 5.1 (3.8–6.3) |
| No disability | 2,774 | 16.9 | 80.1 (78.5–81.8) | 1,195 | 80.7 (78.2–83.1) | 1,579 | 79.7 (77.4–82.1) |
Abbreviation: BMI, body mass index.
a Numbers are unweighted; percentages and 95% CIs are weighted; percentages may not add to 100 because of rounding.
b Eight respondents with missing data on age were excluded.
c The number of chronic comorbid conditions is based on affirmative responses to having ever been told by a doctor or health professional that respondent has the condition. Conditions included arthritis, chronic obstructive pulmonary disease, cirrhosis or hepatitis, dementia, diabetes, heart disease, hypertension, stroke, and weak or failing kidneys.
d Disability is based on responses of “a lot” or “cannot do at all” to the 6 disability types (mobility, vision, hearing, self-care, cognitive, communication). All respondents reporting a mobility disability were categorized as “mobility disability,” respondents reporting any other non–mobility disability were categorized “other disability,” and respondents reporting no disability were categorized as “no disability.”

| Characteristic | Total | Inactive | Insufficiently active | Sufficiently active | P valued | |||
|---|---|---|---|---|---|---|---|---|
| No. | % (95% CI) | No. | % (95% CI) | No. | % (95% CI) | |||
| Overall | 3,365 | 1,143 | 33.9 (31.9–35.9) | 919 | 28.1 (26.3–30.1) | 1,303 | 38.0 (36.0–40.0) | NA |
| Age group, y | ||||||||
| 18–39 | 127 | 22 | 19.2 (11.4–30.4)e | 38 | 32.2 (22.5–43.6) | 67 | 48.7 (38.4–59.0)e | <.001 |
| 40–64 | 932 | 273 | 29.4 (25.9–33.1)f | 270 | 30.0 (26.6–33.7) | 389 | 40.6 (36.9–44.4)f | |
| 65–74 | 1,049 | 340 | 31.2 (27.8–34.9)g | 274 | 27.6 (24.4–31.0) | 435 | 41.2 (37.6–44.8)g | |
| ≥75 | 1,250 | 504 | 43.1 (39.9–46.4)e,f,g | 336 | 26.1 (23.3–29.0) | 410 | 30.8 (27.9–33.9)e,f,g | |
| Sex | ||||||||
| Male | 1,417 | 448 | 32.7 (29.7–35.8) | 360 | 26.2 (23.4–29.2) | 609 | 41.2 (38.0–44.4)e | .02 |
| Female | 1,948 | 695 | 34.9 (32.2–37.6) | 559 | 29.7 (27.3–32.2) | 694 | 35.5 (32.8–38.2)e | |
| Race and ethnicity | ||||||||
| Hispanic | 220 | 86 | 40.1 (32.6–48.0) | 65 | 30.1 (23.3–38.0) | 69 | 29.8 (23.2–37.4)e | .02 |
| Non-Hispanic Black | 260 | 109 | 38.6 (31.3–46.4) | 83 | 33.8 (26.6–41.9) | 68 | 27.6 (21.5–34.6)f | |
| Non-Hispanic White | 2,717 | 894 | 32.7 (30.6–34.9) | 728 | 27.1 (25.1–29.2) | 1,095 | 40.2 (37.9–42.4)e,f | |
| Non-Hispanic Other | 168 | 54 | 33.8 (25.0–43.9) | 43 | 29.6 (21.2–39.6) | 71 | 36.6 (28.2–46.0) | |
| Education level | ||||||||
| Less than high school | 263 | 137 | 52.2 (44.4–59.9)e,f | 63 | 22.8 (17.2–29.5) | 63 | 25.0 (18.8–32.5)e,f | <.001 |
| High school or equivalent | 854 | 390 | 45.5 (41.3–49.8)g,h | 233 | 28.5 (24.7–32.7) | 231 | 26.0 (22.6–29.7)g,h | |
| Some college | 949 | 329 | 33.5 (29.9–37.2)e,g,i | 275 | 29.0 (25.6–32.6) | 345 | 37.5 (33.7–41.4)e,g,i | |
| College | 1,295 | 285 | 21.4 (18.9–24.2)f,h,i | 348 | 28.7 (25.9–31.6) | 662 | 49.9 (46.7–53.1)f,h,i | |
| Marital status | ||||||||
| Married/partnered | 1,674 | 487 | 29.9 (27.5–32.5)e,f | 463 | 28.4 (26.0–31.0) | 724 | 41.6 (39.0–44.3)e,f | <.001 |
| Widowed | 694 | 291 | 47.0 (42.3–51.7)e,g | 187 | 25.6 (22.0–29.6) | 216 | 27.4 (23.7–31.4)e,g | |
| Single/separated | 957 | 350 | 37.3 (33.2–41.6)f,g | 258 | 29.0 (25.1–33.1) | 349 | 33.7 (30.1–37.6)f,g | |
| Urban–rural classification | ||||||||
| Large central metropolitan | 806 | 235 | 29.2 (25.4–33.2)e | 232 | 30.3 (26.5–34.5) | 339 | 40.5 (36.6–44.5) | .009 |
| Large fringe metropolitan | 693 | 224 | 34.5 (30.5–38.8) | 178 | 25.8 (22.0–29.9) | 291 | 39.7 (35.6–43.9) | |
| Medium and small metropolitan | 999 | 326 | 33.6 (30.0–37.4) | 290 | 29.9 (26.6–33.4) | 383 | 36.6 (33.1–40.2) | |
| Rural | 867 | 358 | 41.2 (36.5–46.2)e | 219 | 24.9 (21.3–28.9) | 290 | 33.9 (29.5–38.5) | |
| BMI category | ||||||||
| Underweight/healthy weight (<25 kg/m2) | 1,080 | 295 | 29.3 (25.9–32.9)e | 261 | 24.7 (21.7–28.0)e | 524 | 46.0 (42.3–49.7)e | <.001 |
| Overweight (≥25 to <30 kg/m2) | 1,156 | 370 | 32.3 (29.1–35.6)f | 312 | 27.5 (24.5–30.8) | 474 | 40.2 (36.9–43.6)f | |
| Obesity (≥30 kg/m2) | 1,074 | 446 | 39.1 (35.7–42.5)e,f | 334 | 32.2 (28.8–35.9)e | 294 | 28.7 (25.4–32.2)e,f | |
| Health status | ||||||||
| Excellent/very good | 1,196 | 207 | 16.2 (13.8–18.9)e,f | 294 | 26.0 (23.0–29.2) | 695 | 57.8 (54.3–61.3)e,f | <.001 |
| Good | 1,171 | 413 | 35.0 (31.7–38.5)e,g | 369 | 30.3 (27.3–33.5) | 389 | 34.6 (31.4–38.0)e,g | |
| Fair/poor | 996 | 523 | 52.5 (48.6–56.3)f,g | 256 | 28.0 (24.6–31.6) | 217 | 19.5 (16.9–22.5)f,g | |
| Smoking status | ||||||||
| Current | 332 | 161 | 49.1 (42.2–56.1)e,f | 87 | 26.5 (20.7–33.3) | 84 | 24.4 (19.2–30.4)e,f | <.001 |
| Former | 1,242 | 437 | 36.3 (33.1–39.6)e,g | 336 | 27.1 (24.3–30.1) | 469 | 36.6 (33.4–40.0)e | |
| Never | 1,785 | 542 | 29.7 (27.1–32.4)f,g | 495 | 29.2 (26.6–31.9) | 748 | 41.1 (38.4–43.9)f | |
| No. of chronic comorbid conditionsk | ||||||||
| 0 | 779 | 146 | 20.1 (16.9–23.9)e,f,g | 209 | 28.1 (24.5–32.0) | 424 | 51.7 (47.7–55.8)e,f,g | <.001 |
| 1 | 913 | 262 | 27.9 (24.4–31.6)e,h,i | 241 | 28.6 (25.0–32.6) | 410 | 43.5 (39.6–47.4)e,h,i | |
| 2 | 782 | 282 | 37.1 (33.2–41.1)f,h,j | 234 | 30.3 (26.6–34.2) | 266 | 32.6 (28.9–36.5)f,h,j | |
| ≥3 | 891 | 453 | 51.6 (47.5–55.7)g,i,j | 235 | 25.7 (22.3–29.4) | 203 | 22.7 (19.6–26.1)g,i,j | |
| Disabilityl | ||||||||
| Mobility disability | 502 | 318 | 64.6 (59.4–69.5)e,f | 121 | 23.2 (18.8–28.2) | 63 | 12.2 (9.3–15.9)e,f | <.001 |
| Other disability | 178 | 76 | 45.9 (36.5–55.7)e,g | 53 | 26.6 (19.0–35.9) | 49 | 27.4 (19.8–36.7)e,g | |
| No disability | 2,685 | 749 | 27.7 (25.6–29.8)f,g | 745 | 29.1 (27.1–31.3) | 1,191 | 43.2 (40.9–45.5)f,g | |
Abbreviation: BMI, body mass index; NA, not applicable.
a Physical activity levels are defined as inactive (0 min/week of aerobic activity), insufficiently active (1–149 min/week), or sufficiently active (≥150 min/week, ie, meeting federal guidelines).
b Numbers are unweighted; percentages and 95% CIs are weighted; percentages may not add to 100 because of rounding.
c Respondents missing physical activity data (n = 121) were excluded from analysis.
d Determined by χ2 test for association.
e-j Within a characteristic and physical activity outcome, subgroup pairs with the same superscripted letters are significantly different (P < .05, determined by Bonferroni corrected pairwise t tests).
k The number of chronic comorbid conditions is based on affirmative responses to having ever been told by a doctor or health professional that respondent has the condition. Conditions included arthritis, chronic obstructive pulmonary disease, cirrhosis or hepatitis, dementia, diabetes, heart disease, hypertension, stroke, and weak or failing kidneys.
l Disability is based on responses of “a lot” or “cannot do at all” to the 6 disability types (mobility, vision, hearing, self-care, cognitive, communication). All respondents reporting a mobility disability were categorized as “mobility disability,” respondents reporting any other non–mobility disability were categorized “other disability,” and respondents reporting no disability were categorized as “no disability.”
The opinions expressed by authors contributing to this journal do not necessarily reflect the opinions of the U.S. Department of Health and Human Services, the Public Health Service, the Centers for Disease Control and Prevention, or the authors’ affiliated institutions.