Jurisdiction Data Reporting
Access Jurisdiction Data Reporting Dashboards
VAMS uses Einstein Analytics dashboards and reports for jurisdiction data exploration, customization, and visualization. From your VAMS Jurisdiction Portal home page, navigate to the Jurisdiction Data tab. Click View All Dashboards at the bottom of the page to view all the dashboards and reports that are available for your jurisdiction.
NOTE: Only jurisdiction POCs with an Einstein Analytics license will have access to the dashboards and reports described in this document. If you would like to learn more, contact your jurisdiction liaison.
Doses Administered Dashboard
The Doses Administered dashboard includes the following reports:
- Total number of doses administered
- Total number of initial doses administered
- Total number of follow-up doses administered
- Total number of additional doses administered
- Proportion of vaccine series completion
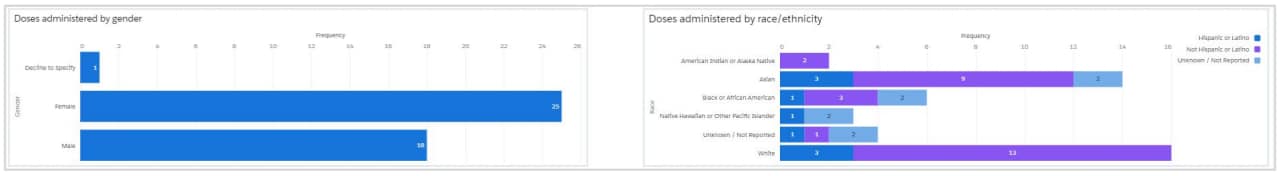
- Doses administered by gender
- Doses administered by race/ethnicity
- Doses administered by age group
- Doses administered by clinic type
- Doses administered by priority group
- Doses administered by state
- Initial Doses, follow-up doses, and total doses administered by clinic
Doses Administered reports can befiltered by:
- Vaccination dose date (e.g., all, before/after/between dates, relative dates)
- Vaccine type (e.g., all, Pfizer-BioNTech (COMIRNATY), Moderna, Johnson & Johnson/Janssen)
- Clinic (e.g., all, Jefferson Clinic, Main St. Clinic)
Registration Dashboard
Registration reports cannot be filtered.
The Registration dashboard includes the following reports:
- Total number of recipients notified through Organizations
- Total number of recipients that were notified
- Total number of recipients registered
- Total number of organizations with enrollments
- Total number of activated clinics
- Total number of deactivated clinics
- Total number of recipients registered through each registration pathway: Organizations, Flexible (Open) Registration, Contact Center, Standard and Mobile Clinics, Third-Party Clinics, and Guest Registration
Inventory Dashboard
The Inventory dashboard includes the following reports:
- Total number of doses delivered
- Total number of requested vaccine doses
- Total number of vaccine doses successfully administered
- Total number of doses removed
- Total number of vaccine doses part of inventory
- Percentage of available vaccines administered
- Number of doses wasted
- Total number of doses logged in error
- Number of vaccine doses removed by reason
Inventory reports can be filtered by:
- Clinic (e.g., all, Jefferson Clinic, Main St. Clinic)
- Vaccine type (e.g., all, Pfizer-BioNTech (COMIRNATY), Moderna, Johnson & Johnson/Janssen)
Appointments Dashboard
The Appointments dashboard includes the following reports:
- Average appointment duration
- Total number of scheduled appointments
- Number of cancelled appointments
- Number of completed appointments
- Number of cancelled appointments by cancellation reason
Appointment reports can be filtered by:
- Timeframe (e.g., between 2/1 and 3/17)
- Vaccine type (e.g., all, Pfizer-BioNTech, Moderna, Johnson & Johnson/Janssen)
- Clinic (e.g., all, Jefferson Clinic, Main St. Clinic.)
- COVID-19 Test Type
Admin Reports Dashboard
The Admin Reports dashboard includes the following dashboards:
- Clinics
- Organizations
- Clinic Capacity
- Recipient Vaccinations
- COVID-19 Tests
The Clinics dashboard includes the following reports:
- Total number of active clinics
- Total number of third-party clinics
- Total number of pending clinics
- Total number of inactive clinics
- Total number of COVID-19 Testing Clinics
Clinic Admin reports cannot be filtered.
The Organizations dashboard includes the following reports:
- Total organizations
- Total number of active organizations
- Total number of pending organizations
- Total number of inactive organizations
- # of recipients notified
- # of recipients registered
Organization reports can be filtered by:
- Organization name (e.g., all, ASPR Employees, Delaware Health Department)
The Clinic Capacity dashboard includes the following reports:
- Total capacity
- Total number of booked appointments
- Total available appointments
- Total completed appointments
- Total canceled appointments
- Total checked-in appointments
- Total past checked-in appointments
Clinic Capacity reports can be filtered by:
- Clinic name (e.g., all, Jefferson Clinic, Main St. Clinic)
The Recipient Vaccinations dashboard includes the following reports:
- Number of 1st dose recipients
- Number of 2nd dose recipients
- Recipients with a 2nd dose needed
- Number of additional dose recipients
- Recipients who have completed their vaccination
Recipient Vaccinations reports can be filtered by:
- Clinic name (e.g., all, Jefferson Clinic, Main St. Clinic)
- Vaccination date
The COVID-19 Tests dashboard includes the following reports:
- Number of Diagnostic Lab Test- PCR (Molecular-PCR SARS CoV2)
- Number of Rapid Diagnostic Test (IDNow Rapid COVID-19 PCR)
- Number of Rapid Antigen Test (BinaxNOW Rapid COVID-19 Antigen)
- Number of COVID-19 Antibody (SST)
Number of COVID-19 Antibody (SST) COVID-19 Tests reports can be filtered by:
- Clinic name (e.g., all, Jefferson Clinic, Main St. Clinic
- Vaccination date
To view a detailed report within any of these dashboards, click the Tile Header.
Modify Dashboards
You can modify select dashboards by clicking on data within certain reports. For example, from the Doses Administered dashboard, clicking on the Female bar in the Doses Administered by Gender report will update the rest of the reports on the dashboard to only show information for females in your jurisdiction.
View before:
View after clicking the Female bar (highlighted):
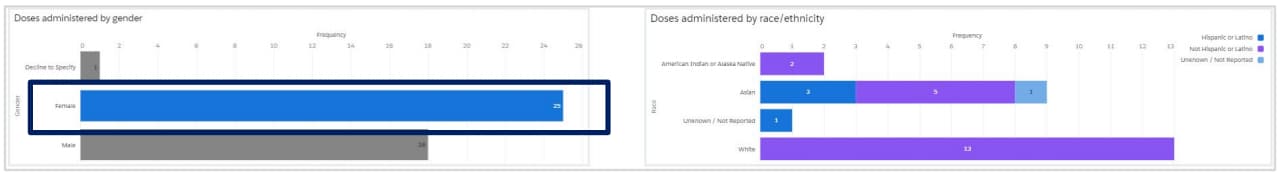
To revert to your original view, click the circular arrow next to the Modified button in the top left corner of the screen.
Download Reports from a Dashboard
You can download select VAMS reports as images, Excel workbooks, or CSV files. To determine if a report can be downloaded, hover your mouse over a report. If a small drop-down arrow appears in the bottom right corner of the report, it can be downloaded.
- To download a report, click the Drop-Down Arrow, then click Share.
- Click the Download tab in the pop-up window and select a download format (image, Excel, or CSV).
- Once downloaded to your device, you can print reports using your internet browser’s print options.
Customize Reports
You can customize reports by using the Explore feature.
- In any dashboard, hover over a dataset until you see the Drop-Down Arrow. Click the Arrow, then select Explore.
- Once inside the Explore lens, you can sort and filter the data by selecting your desired criteria from the options available on the left side of your screen.
-
- NOTE: The lens defaults to a limit of 100 records. To increase this count, increase the Query Limit by scrolling down in the left-hand section of the lens and select Edit under Query Limit Default. Enter 10,000 and click Apply.
- The sort and filter options available will change based on which mode is being used to display the data: Chart, Table, or Query Mode.
-
- The default mode upon clicking Explore is Chart Mode. From here, you can visualize your data by clicking the Chart icon on the right side of your screen and selecting from a variety of charts available. You can also customize charts by clicking the Formatting icon below the chart icon.
- In Table Mode, you can also use the Formatting feature to customize tables.
- In Query mode, both the Chart and Formatting features are available.
Download Reports in Explore Lens
- You can download a report at any time by clicking the Share Icon in the upper right corner of the page.
- In the pop-up window, click the Download tab and select a Download Format (image, Excel, or CSV).
For additional support, complete the contact form for the VAMS Help Desk.
Toll-Free Number | +1 833-748-1979
Email: CARS_HelpDesk@cdc.gov
Hours of Operation | 8:00 AM – 8:00 PM EST | Monday – Friday