Reported Tuberculosis in the United States, 2020
‹View Table of Contents
Demographics
Because of the substantially greater risk of exposure to TB bacteria outside of the United States, origin of birth is the most prominent risk factor for TB in the United States.
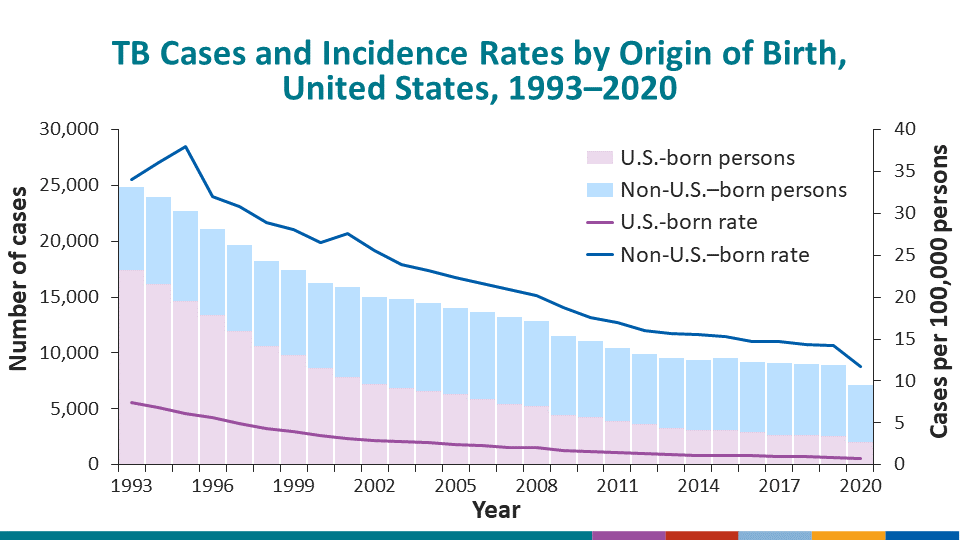
Consistent with previous years, the majority of reported TB cases occurred among non-U.S.–born persons (71.5%) (TB by Origin of Birth: 1993–2020).
- Between 1993 and 2020
- Cases of TB disease have declined by 88.4% among U.S.-born persons and by 30.8% among non-U.S.–born persons.
-
- Incidence rates (per 100,000 persons) of TB disease
have declined by 90.3% among U.S.-born persons and by 65.7% among non-U.S.–born persons.
- Incidence rates (per 100,000 persons) of TB disease
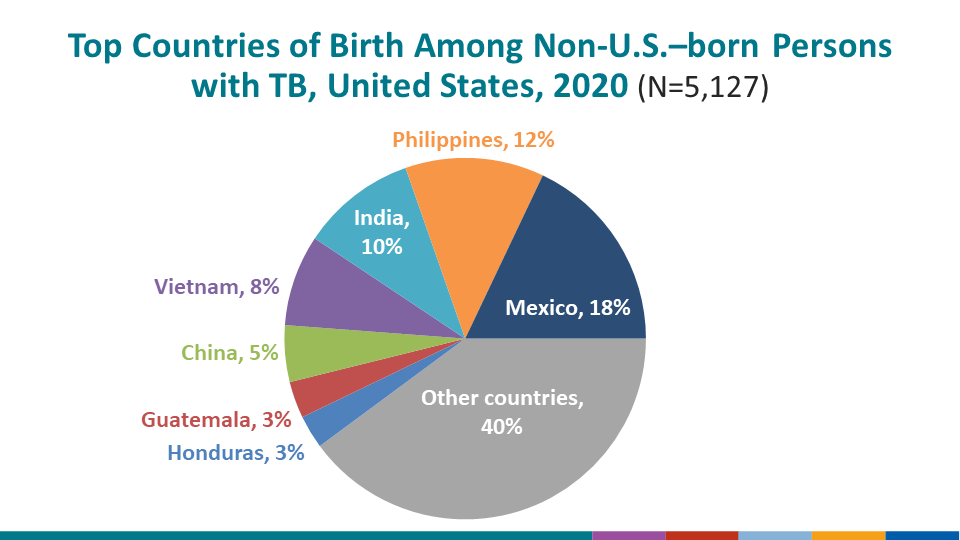
Among non-U.S.–born persons with TB disease, the most common countries of birth continue to include
- Mexico; 18.0%,
- the Philippines; 12.5%,
- India; 10.4%,
- Vietnam; 8.2%, and
- China; 5.1%.
Source: TB Among Non-U.S.–Born Persons by the Top 30 Countries of Birth: 2016–2020
These countries of birth also represent substantial proportions of the non-U.S.–born population living in the United States.
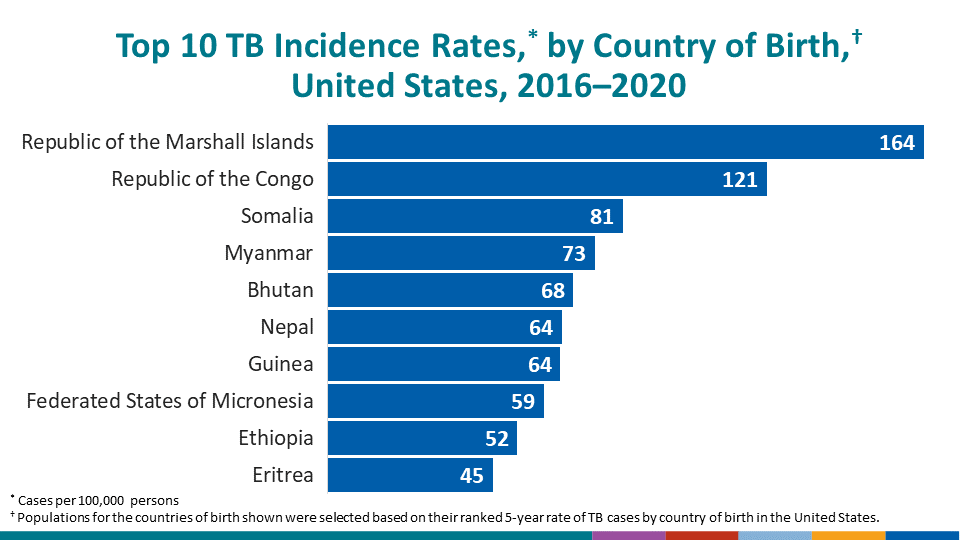
Groups with relatively small populations in the United States can have high incidence rates despite constituting a relatively small proportion of the total number of TB cases reported because incidence rates accounts for the size of the underlying population.
Among non-U.S.–born persons, the countries of birth with the highest incidence rates (per 100,000 persons) of TB disease were
- the Republic of the Marshall Islands; 164.2,
- the Republic of the Congo; 120.8,
- Somalia; 81.2, and
- Myanmar; 73.5.
Source: TB Rates by the Top 10 Countries of Birth in the United States: 2016–2020
Anyone can get TB disease, but some groups are at increased risk for TB.
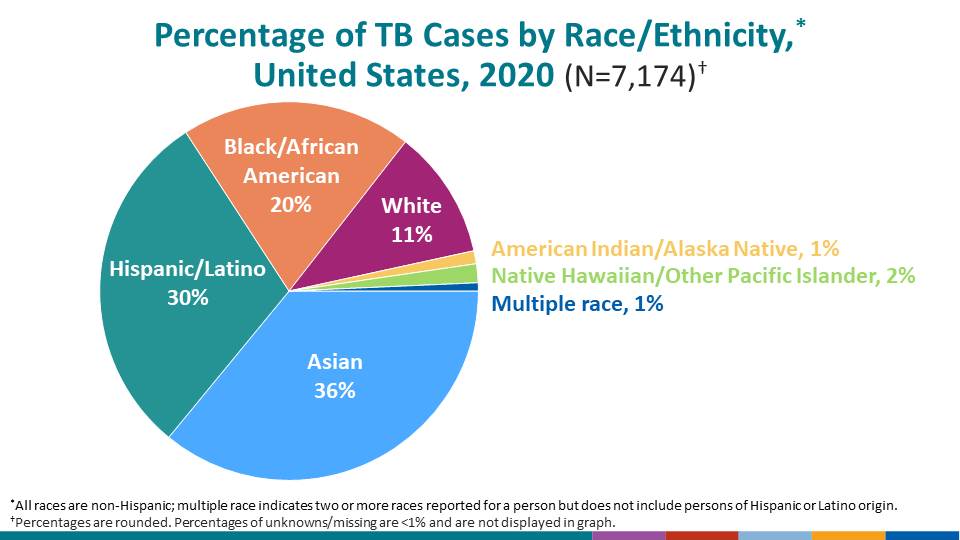
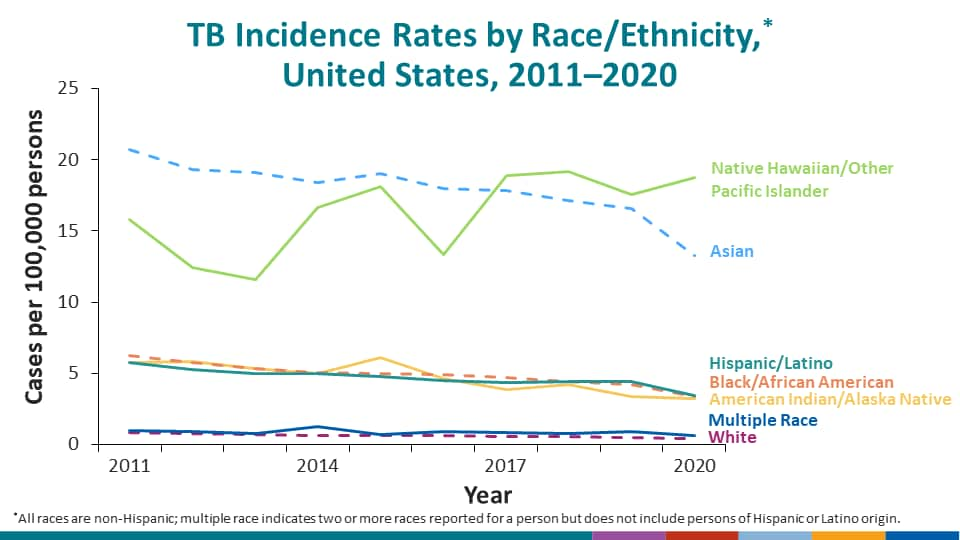
In 2020, the majority of persons with TB disease in the United States identified as
- Non-Hispanic Asian persons (35.8%),
- Hispanic or Latino persons (29.7%),
- Non-Hispanic Black or African American persons (19.6%), or
- Non-Hispanic White persons (11.0%).
Source: TB by Race/Ethnicity: 1993–2020
The incidence rate (per 100,000 persons) remained highest among non-Hispanic Native Hawaiian or Other Pacific Islander persons in 2020 (18.7 per 100,000 persons), and this is the only race/ethnicity group in which the rate did not decrease compared with 2019 (17.5 per 100,000 persons).
As in past years, the distribution of persons with TB disease and the incidence rates by race/ethnicity differ markedly in 2020 by origin of birth (TB by Race/Ethnicity Among U.S.–Born Persons: 1993–2020, TB by Race/Ethnicity Among Non-U.S.–Born Persons: 1993–2020, and TB by Race/Ethnicity and Origin of Birth: 1993–2020).
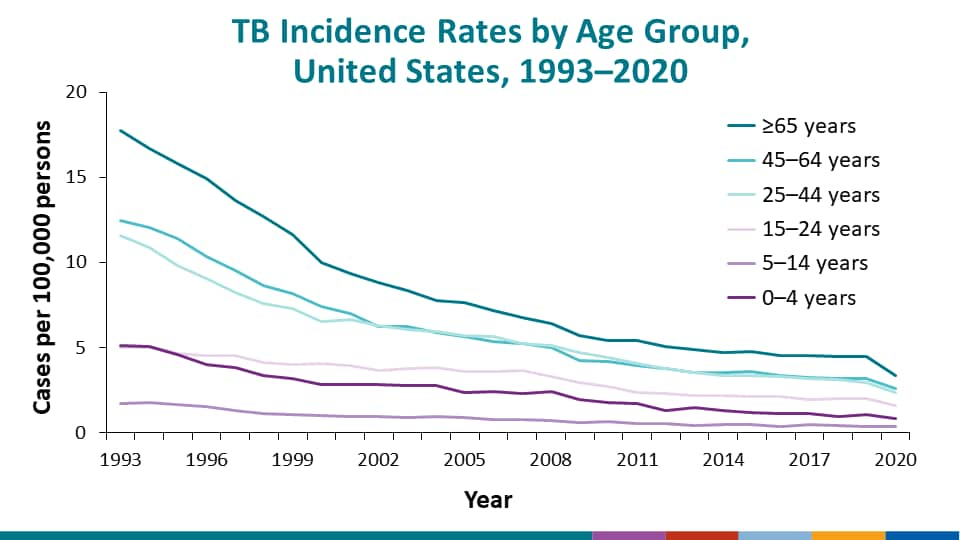
The age distribution among persons with TB disease has remained relatively steady over time; similar to past years, the majority (95.5%) of persons with TB disease in 2020 occurred in persons 15 years of age or older (TB by Age Group: 1993–2020).
- Children ages 5–14 years had the lowest TB incidence rate (0.4 cases per 100,000 persons) and were the only age group whose incidence rate did not decrease in 2020.
- Adults 65 years of age or older had the highest TB incidence rate in 2020 (3.4 per 100,000 persons) and experienced the largest percentage decrease (24.3%) compared with 2019 (4.5 per 100,000).
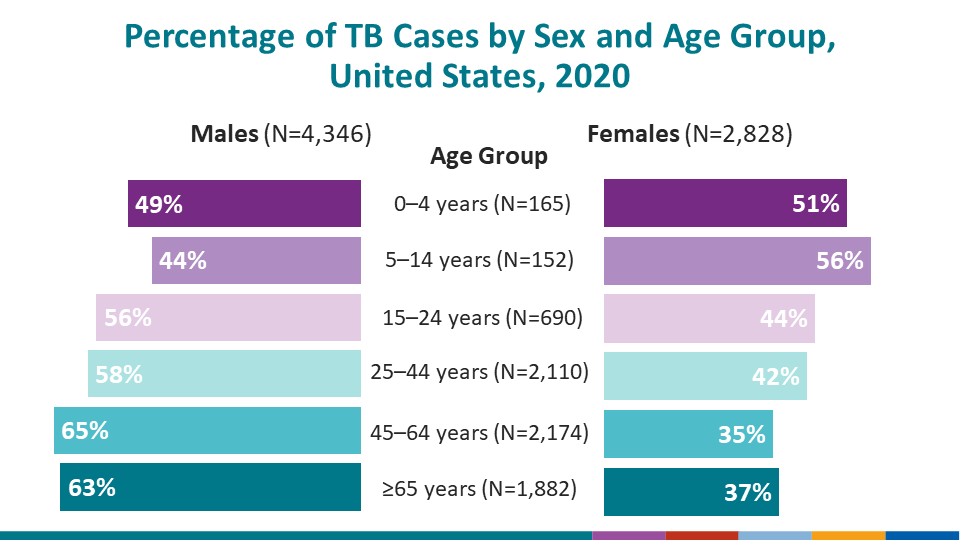
Males accounted for 60.6% of TB cases in the United States in 2020 and had a higher incidence rate (2.7 per 100,000 persons) compared with females (1.7 per 100,000 persons).
Among persons 15 years of age and older, males accounted for more than half (61.2%) of cases; however, among children 0–14 years of age, less than half (46.7%) of TB cases occurred in male persons (TB by Race/Ethnicity, Sex, and Age: 2020).
This might indicate that factors associated with increased risk for TB disease (such as homelessness, incarceration, and substance use) disproportionately affect adult men or that migration patterns to the United States differ by sex and age.
Learn more in the Executive Commentary.
- TB by Race/Ethnicity Among Non-U.S.–Born Persons: 1993–2020
- TB by Race/Ethnicity and Origin of Birth: 1993–2020
- TB by Origin of Birth: 1993–2020
- TB Among Non-U.S.–Born Persons by the Top 30 Countries of Birth: 2016–2020
- TB Rates by the Top 10 Countries of Birth in the United States: 2016–2020
- TB Among Non-U.S.–Born Persons by Years in the United States: 1993–2020
- TB by Resistance to Isoniazid (INH): 1993–2020
- TB by Multidrug Resistance (MDR): 1993–2020
- Mycobacterium bovis by Origin of Birth: 2004–2020
- TB Among Non-U.S.–Born Persons, by Top Countries of Birth and Years in the United States: 2020
- TB Among U.S.-Born Persons, by Race/Ethnicity, Sex, and Age: 2020
- TB Among Non-U.S.–Born Persons, by Race/Ethnicity, Sex, and Age: 2020
- TB Risk Factors, by Origin of Birth and Race/Ethnicity: 2020
- TB by Origin of Birth: United States and the District of Columbia, 2020
- TB by Origin of Birth: Metropolitan Statistical Areas with ≥500,000 Population, 2020

