Reported Tuberculosis in the United States, 2022
Molecular Surveillance

TB genotyping is a laboratory-based approach used to analyze genetic material (e.g., DNA) of Mycobacterium tuberculosis; characterizing distinct genetic patterns facilitates distinguishing certain M. tuberculosis strains from others.
This is the first year CDC is reporting genotyping results using wgMLSType (whole-genome multilocus sequence type), a typing method based on whole-genome sequencing, instead of conventional genotyping methods (e.g., spoligotyping). Genotype surveillance coverage, defined as the percentage of culture-positive TB cases with a genotyped isolate, was 96.0% in 2022.
This report considers a TB case clustered if the wgMLSType of the case’s isolate matched one or more other cases’ isolate in the same county or county-equivalent area during the 3-year period of 2020–2022. CDC generates cluster alerts (i.e., medium alert and high alert) based on the degree of geospatial concentration of cases with matching wgMLSType within the same county or county-equivalent area compared with the concentration of the wgMLSType outside of the given county or county-equivalent. CDC reviews medium and high alerts weekly for possible programmatic follow-up.
The percentage of clustered genotyped cases during 2019–2021 (19.2%) based on conventional genotyping methods in last year’s report compares with 16.9% clustering during 2020–2022 based on whole-genome sequencing methods.
- Clustering percentages were higher among U.S.-born persons during 2020–2022 compared with 2019–2021 (37.1% and 34.6%, respectively) and lower among non-U.S.–born persons (10.0% and 13.5%, respectively).
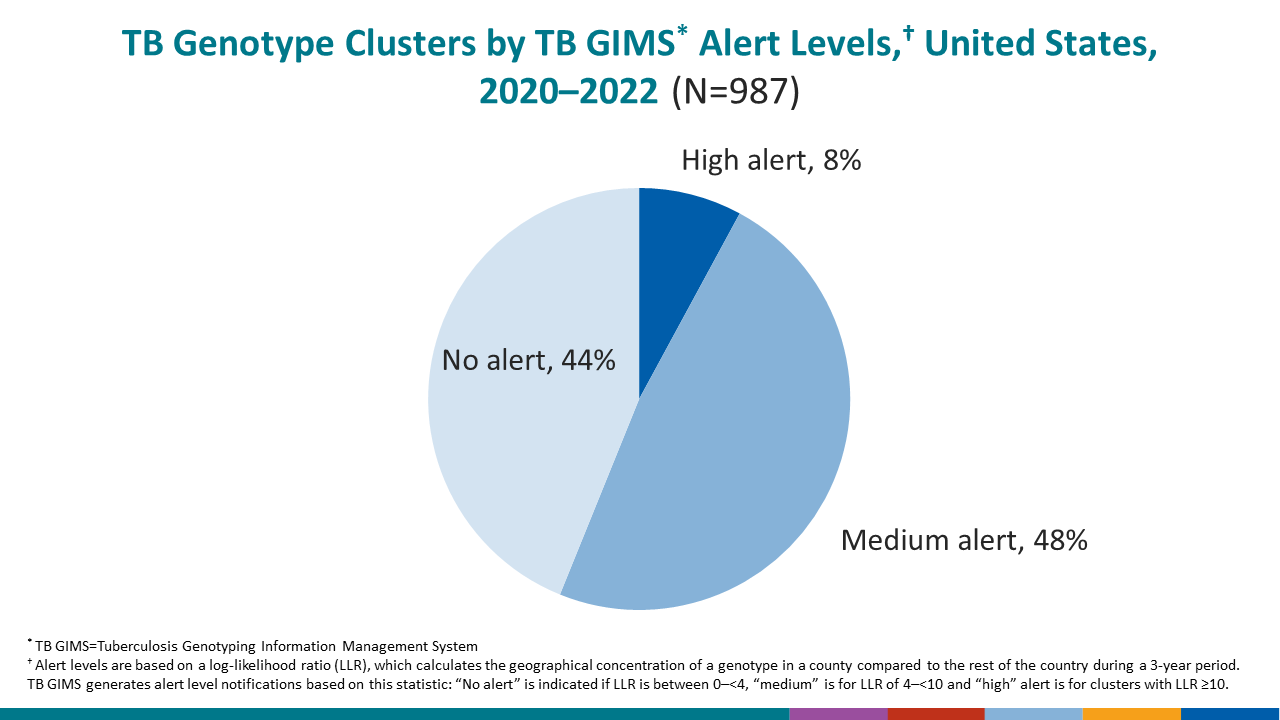
- The number of clusters reported nationally declined in 2020–2022 (987) compared with 2019–2021 (1,241), a 20.5% reduction from last year’s report.
CDC identifies genotype-matched clusters, which can represent TB outbreaks, using geospatial analysis to identify unexpected clustering of TB cases within a defined time period. TB control programs can use this cluster detection information to help allocate and prioritize resources for investigation and intervention for specific cases.
CDC’s primary outbreak detection method identifies higher than expected geospatial concentrations of a TB genotype in a specific county, compared with the national distribution of that genotype. A log-likelihood ratio calculation characterizes genotype clusters into one of three alert levels: no-alert, medium-level alert, or high-level alert.
Among clustered cases the percentage that were in medium- or high-level alert clusters increased during 2020–2022 compared with 2019–2021 (65.7% and 38.3%, respectively).
Percentages of clustered cases in alerted clusters varied across population subgroups during 2020–2022.
- By origin of birth, percentages of clustered cases in alerted clusters were higher among U.S.-born persons (72.8%) compared with non-U.S.–born persons (56.9%).
- By race/ethnicity, percentages were highest among American Indian or Alaska Native persons (96.1%) and lowest among Hispanic or Latino persons (54.2%).
- By age group, percentages were highest among persons aged 0–4 years (79.2%) and lowest among persons aged 65 years or older (60.5%).
- Among risk factors for TB disease, persons residing in correctional facilities at diagnosis had the highest percentage in alerted clusters (75.0%).
Learn more in the Executive Commentary.

