Reported Tuberculosis in the United States, 2022
Table 23. Characteristics of Tuberculosis Cases in wgMLSType Clusters1 by Alert Levels Based on Log-Likelihood Ratio (LLR):2 United States, 2020–2022
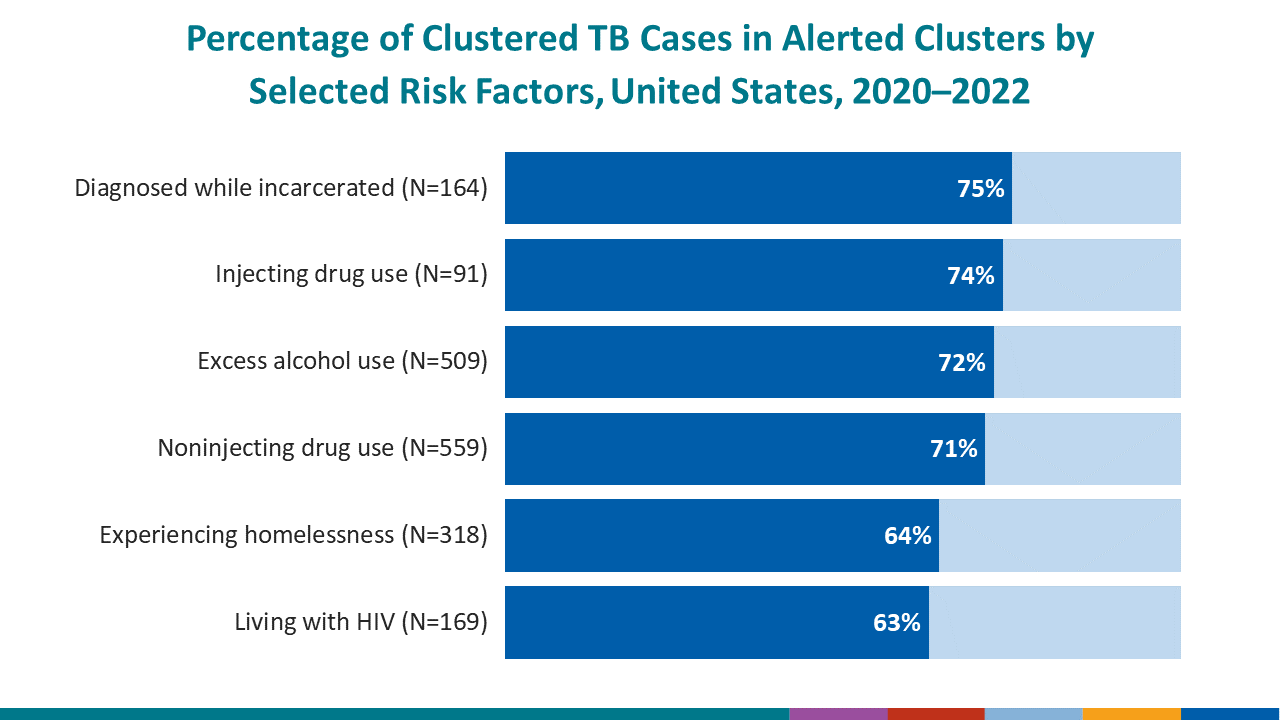
See surveillance slides #50, #51, #52, #53, and #54.
| Characteristics | Unique | Clustered | Alert levels for clustered cases3 | |||||||
|---|---|---|---|---|---|---|---|---|---|---|
| Non-alerted | Medium | High | ||||||||
| (LLR <4) | (LLR 4 – <10) | (LLR ≥10) | ||||||||
| No. | (%) | No. | (%) | No. | (%) | No. | (%) | No. | (%) | |
| Total | 14,695 | (83.1) | 2,999 | (16.9) | 1,029 | (34.3) | 1,238 | (41.3) | 732 | (24.4) |
| Origin of birth4 | ||||||||||
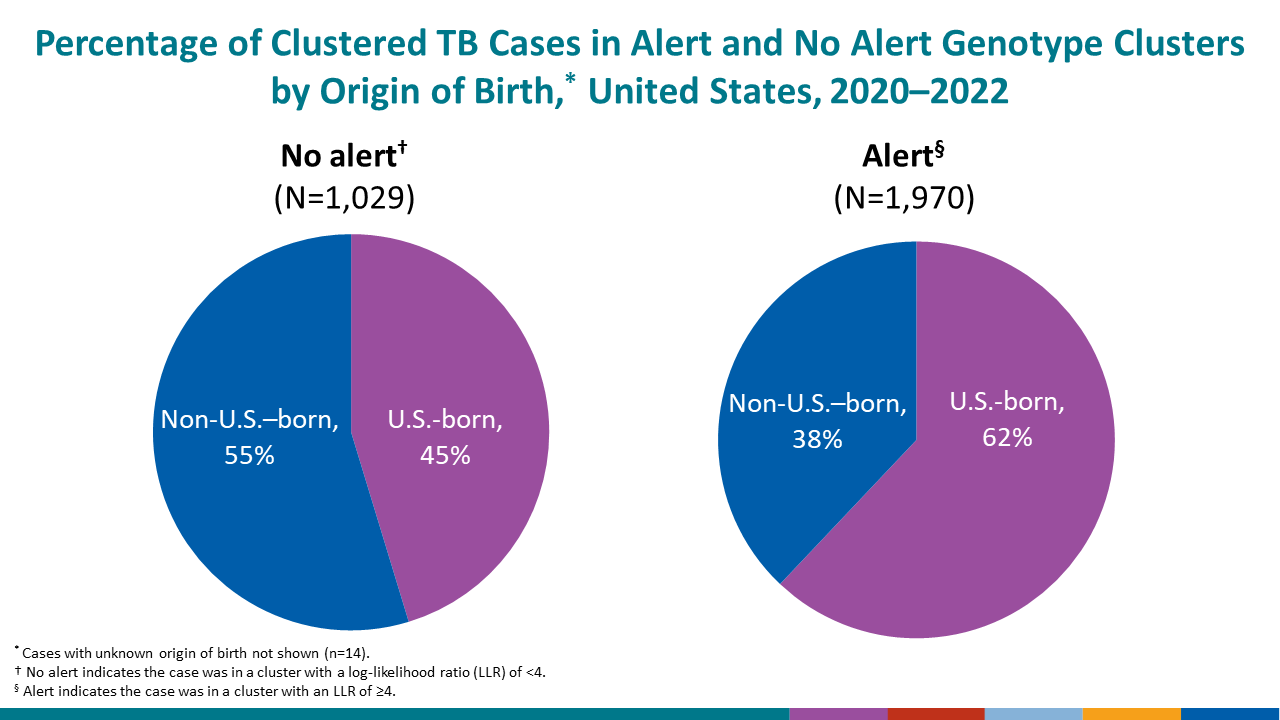
| U.S-born | 2,836 | (62.9) | 1,673 | (37.1) | 455 | (27.2) | 636 | (38.0) | 582 | (34.8) |
| Non-U.S.–born | 11,792 | (90.0) | 1,312 | (10.0) | 566 | (43.1) | 597 | (45.5) | 149 | (11.4) |
| Unknown or missing | 67 | (82.7) | 14 | (17.3) | 8 | (57.1) | 5 | (35.7) | 1 | (7.1) |
| Race and ethnicity5 | ||||||||||
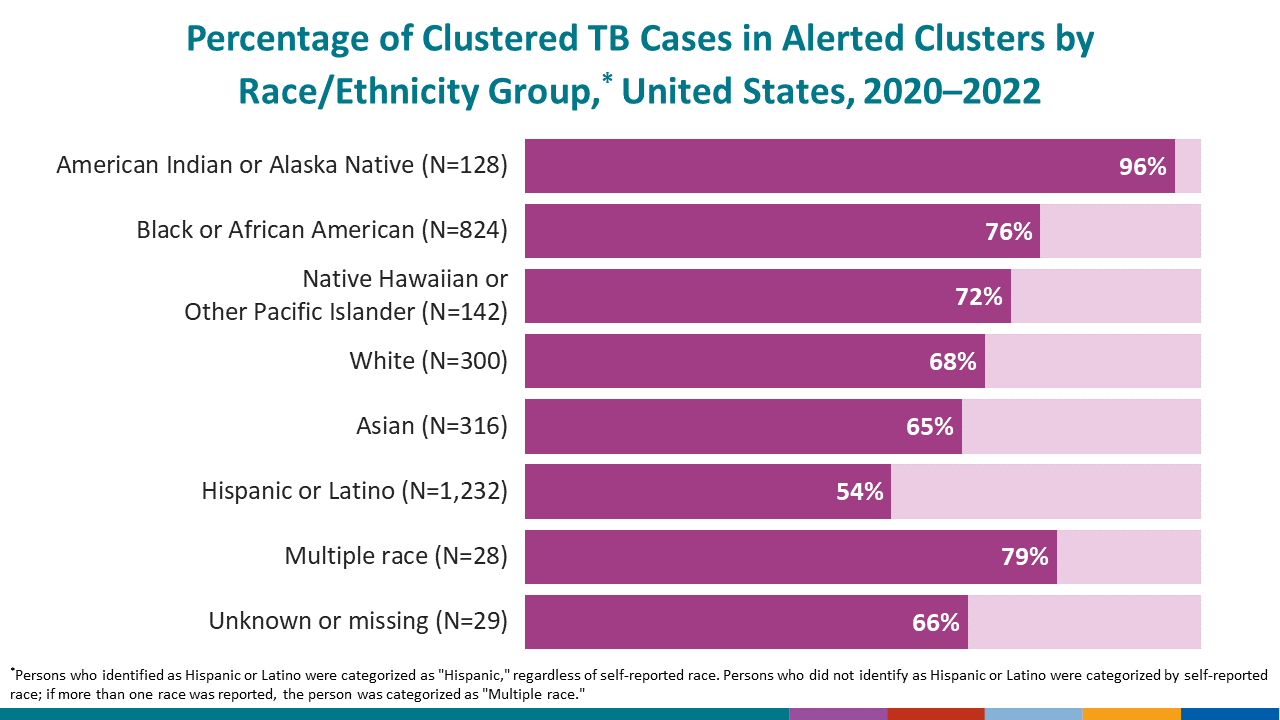
| Hispanic or Latino | 4,373 | (78.0) | 1,232 | (22.0) | 564 | (45.8) | 469 | (38.1) | 199 | (16.2) |
| American Indian or Alaska Native | 78 | (37.9) | 128 | (62.1) | 5 | (3.9) | 22 | (17.2) | 101 | (78.9) |
| Asian | 6,188 | (95.1) | 316 | (4.9) | 112 | (35.4) | 191 | (60.4) | 13 | (4.1) |
| Black or African American | 2,173 | (72.5) | 824 | (27.5) | 196 | (23.8) | 342 | (41.5) | 286 | (34.7) |
| Native Hawaiian or Other Pacific Islander | 117 | (45.2) | 142 | (54.8) | 40 | (28.2) | 58 | (40.8) | 44 | (31.0) |
| White | 1,503 | (83.4) | 300 | (16.6) | 96 | (32.0) | 133 | (44.3) | 71 | (23.7) |
| Multiple race | 149 | (84.2) | 28 | (15.8) | 6 | (21.4) | 10 | (35.7) | 12 | (42.9) |
| Unknown or missing | 114 | (79.7) | 29 | (20.3) | 10 | (34.5) | 13 | (44.8) | 6 | (20.7) |
| Age group (years) | ||||||||||
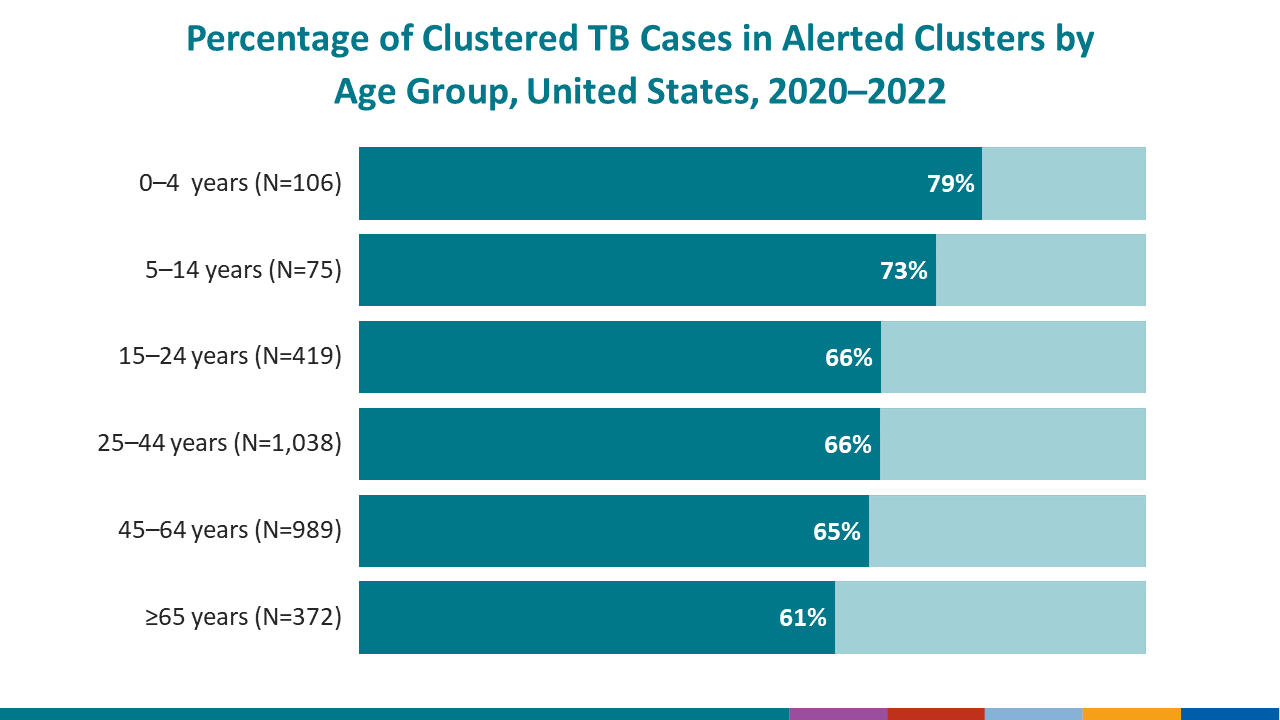
| 0–4 | 55 | (34.2) | 106 | (65.8) | 22 | (20.8) | 57 | (53.8) | 27 | (25.5) |
| 5–14 | 113 | (60.1) | 75 | (39.9) | 20 | (26.7) | 32 | (42.7) | 23 | (30.7) |
| 15–24 | 1,303 | (75.7) | 419 | (24.3) | 141 | (33.7) | 189 | (45.1) | 89 | (21.2) |
| 25–44 | 4,144 | (80.0) | 1,038 | (20.0) | 351 | (33.8) | 436 | (42.0) | 251 | (24.2) |
| 45–64 | 4,391 | (81.6) | 989 | (18.4) | 348 | (35.2) | 379 | (38.3) | 262 | (26.5) |
| ≥65 | 4,689 | (92.6) | 372 | (7.4) | 147 | (39.5) | 145 | (39.0) | 80 | (21.5) |
| Disease site | ||||||||||
| Pulmonary only | 10,364 | (81.5) | 2,351 | (18.5) | 779 | (33.1) | 1,017 | (43.3) | 555 | (23.6) |
| Extrapulmonary | 2,419 | (89.6) | 281 | (10.4) | 113 | (40.2) | 90 | (32.0) | 78 | (27.8) |
| Both | 1,902 | (83.9) | 364 | (16.1) | 136 | (37.4) | 130 | (35.7) | 98 | (26.9) |
| Unknown | 10 | (76.9) | 3 | (23.1) | 1 | (33.3) | 1 | (33.3) | 1 | (33.3) |
| Sputum smear | ||||||||||
| Positive | 7,200 | (80.5) | 1,741 | (19.5) | 583 | (33.5) | 751 | (43.1) | 407 | (23.4) |
| Negative | 5,815 | (86.0) | 947 | (14.0) | 350 | (37.0) | 361 | (38.1) | 236 | (24.9) |
| Not done | 1,537 | (83.9) | 295 | (16.1) | 88 | (29.8) | 120 | (40.7) | 87 | (29.5) |
| Unknown or missing | 143 | (89.9) | 16 | (10.1) | 8 | (50.0) | 6 | (37.5) | 2 | (12.5) |
| Cavitary disease6 | ||||||||||
| Yes | 155 | (77.9) | 44 | (22.1) | 17 | (38.6) | 13 | (29.5) | 14 | (31.8) |
| No | 1,318 | (84.1) | 249 | (15.9) | 94 | (37.8) | 90 | (36.1) | 65 | (26.1) |
| Unknown or missing | 21 | (87.5) | 3 | (12.5) | 1 | (33.3) | 0 | (0.0) | 2 | (66.7) |
| Homeless within past year | ||||||||||
| Yes | 523 | (62.2) | 318 | (37.8) | 114 | (35.8) | 113 | (35.5) | 91 | (28.6) |
| No | 13,988 | (84.1) | 2,645 | (15.9) | 898 | (34.0) | 1,118 | (42.3) | 629 | (23.8) |
| Unknown or missing | 184 | (83.6) | 36 | (16.4) | 17 | (47.2) | 7 | (19.4) | 12 | (33.3) |
| Excess alcohol use within past year | ||||||||||
| Yes | 1,131 | (69.0) | 509 | (31.0) | 141 | (27.7) | 208 | (40.9) | 160 | (31.4) |
| No | 13,292 | (84.6) | 2,422 | (15.4) | 860 | (35.5) | 1,004 | (41.5) | 558 | (23.0) |
| Unknown or missing | 272 | (80.0) | 68 | (20.0) | 28 | (41.2) | 26 | (38.2) | 14 | (20.6) |
| Injecting drug use within past year | ||||||||||
| Yes | 96 | (51.3) | 91 | (48.7) | 24 | (26.4) | 33 | (36.3) | 34 | (37.4) |
| No | 14,083 | (83.4) | 2,795 | (16.6) | 951 | (34.0) | 1,169 | (41.8) | 675 | (24.2) |
| Unknown or missing | 516 | (82.0) | 113 | (18.0) | 54 | (47.8) | 36 | (31.9) | 23 | (20.4) |
| Noninjecting drug use within past year | ||||||||||
| Yes | 713 | (56.1) | 559 | (43.9) | 162 | (29.0) | 200 | (35.8) | 197 | (35.2) |
| No | 13,487 | (85.2) | 2,336 | (14.8) | 816 | (34.9) | 1,004 | (43.0) | 516 | (22.1) |
| Unknown or missing | 495 | (82.6) | 104 | (17.4) | 51 | (49.0) | 34 | (32.7) | 19 | (18.3) |
| Resident of a correctional facility at time of diagnosis | ||||||||||
| Yes | 287 | (63.6) | 164 | (36.4) | 41 | (25.0) | 47 | (28.7) | 76 | (46.3) |
| No | 14,301 | (83.6) | 2,812 | (16.4) | 972 | (34.6) | 1,186 | (42.2) | 654 | (23.3) |
| Unknown or missing | 107 | (82.3) | 23 | (17.7) | 16 | (69.6) | 5 | (21.7) | 2 | (8.7) |
| HIV status | ||||||||||
| Positive | 564 | (76.9) | 169 | (23.1) | 63 | (37.3) | 57 | (33.7) | 49 | (29.0) |
| Negative | 12,486 | (82.7) | 2,610 | (17.3) | 890 | (34.1) | 1,090 | (41.8) | 630 | (24.1) |
| Refused | 287 | (91.1) | 28 | (8.9) | 9 | (32.1) | 16 | (57.1) | 3 | (10.7) |
| Not offered | 774 | (86.8) | 118 | (13.2) | 46 | (39.0) | 44 | (37.3) | 28 | (23.7) |
| Unknown, missing or indeterminate | 584 | (88.8) | 74 | (11.2) | 21 | (28.4) | 31 | (41.9) | 22 | (29.7) |
| Multidrug-resistant TB | ||||||||||
| Yes | 192 | (88.9) | 24 | (11.1) | 4 | (16.7) | 13 | (54.2) | 7 | (29.2) |
| No | 14,026 | (82.9) | 2,898 | (17.1) | 996 | (34.4) | 1,194 | (41.2) | 708 | (24.4) |
| Unknown or missing | 477 | (86.1) | 77 | (13.9) | 29 | (37.7) | 31 | (40.3) | 17 | (22.1) |
1wgMLSType clusters have two or more cases with matching wgMLSType within a county during the specified 3-year time period.
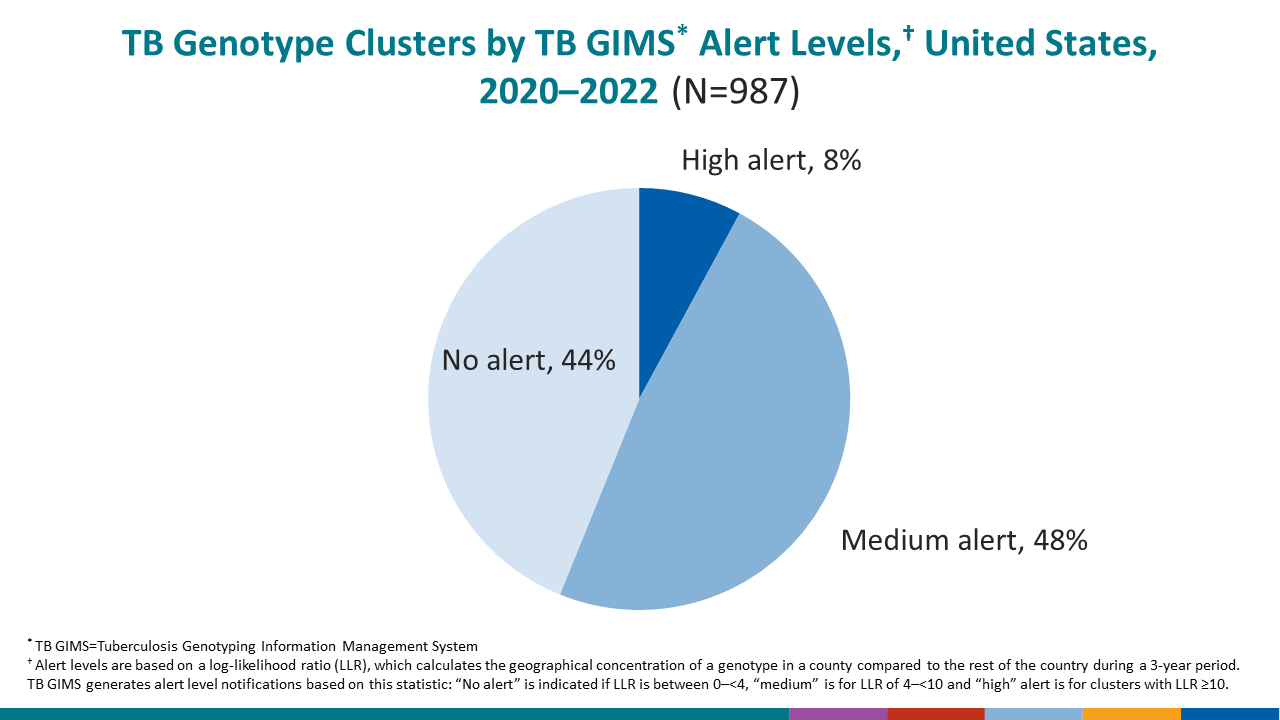
2Alert levels are based on a log-likelihood ratio, which calculates the geographical concentration of a genotype in a county compared to the rest of the country during a 3-year period.
3There were 2,999 cases in 987 clusters: 732 cases were in 78 (7.9%) high alert clusters; 1,238 cases were in 476 (48.2%) medium alert clusters, and 1,029 cases were in 433 (43.9%) non-alert clusters.
4Persons born in the United States, certain U.S. territories, or elsewhere to at least one U.S. citizen parent are categorized as U.S.-born. All other persons are categorized as non-U.S.–born.
5Persons who identified as Hispanic or Latino were categorized as “Hispanic,” regardless of self-reported race. Persons who did not identify as Hispanic or Latino were categorized by self-reported race; if more than one race was reported, the person was categorized as “Multiple race.”
6Cavitary disease only assessed for persons with pulmonary TB and an abnormal x-ray.
Note:
Data for all years are updated through July 8, 2023.