Reported Tuberculosis in the United States, 2020
Table 3. Tuberculosis Cases and Percentages by Hispanic Ethnicity and Non-Hispanic Race, and by Origin of Birth: United States, 1993–2020
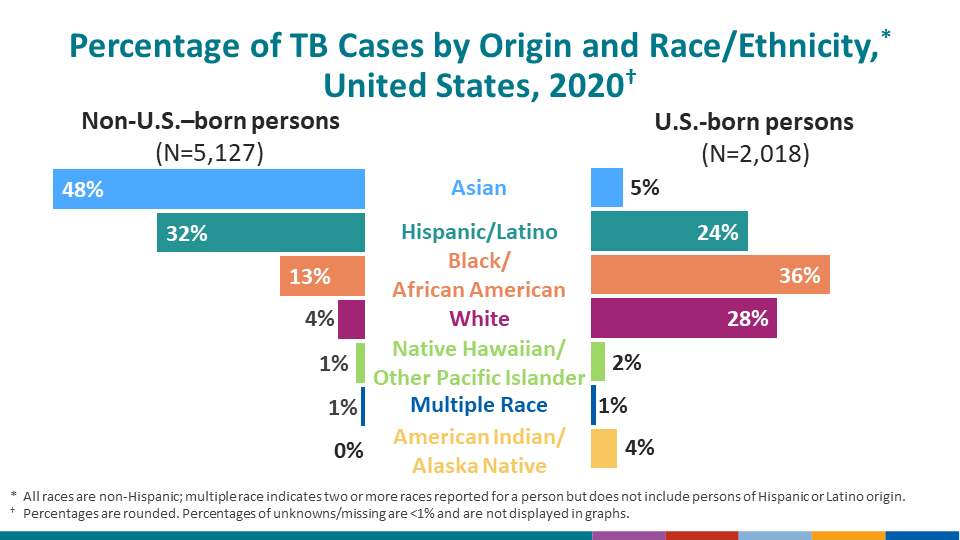
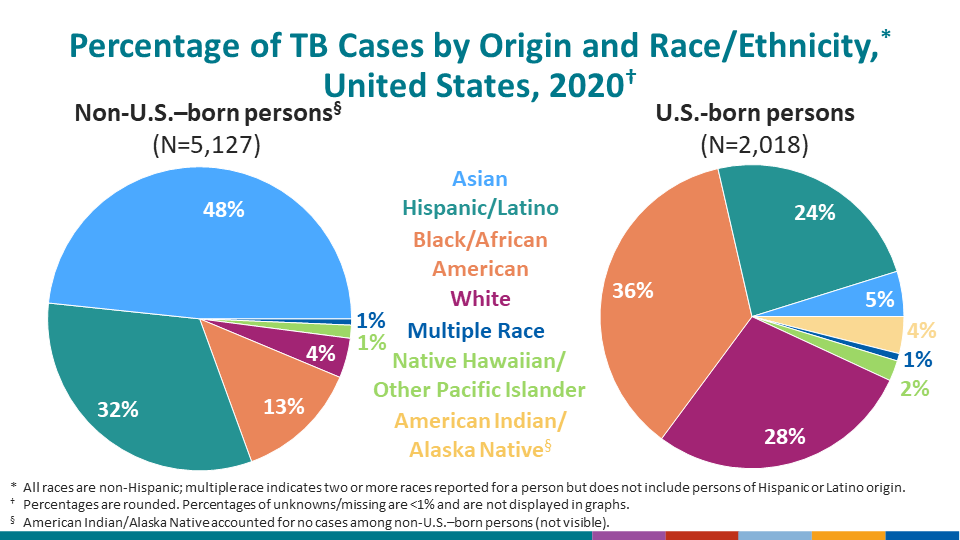
See Surveillance Slides #28 and #29.
| Year | Non-Hispanic | Hispanic/Latino4 | Unknown/Missing5 | |||||||||||||||||||||||||||||
|---|---|---|---|---|---|---|---|---|---|---|---|---|---|---|---|---|---|---|---|---|---|---|---|---|---|---|---|---|---|---|---|---|
| American Indian/Alaska Native | Asian1 | Black/African American | Native Hawaiian/Other Pacific Islander2 | White | Multiple Race3 | |||||||||||||||||||||||||||
| U.S.-Born | Non- U.S.-Born |
U.S.-Born | Non- U.S.–Born |
U.S.-Born | Non- U.S.–Born |
U.S.-Born | Non- U.S.–Born |
U.S.-Born | Non- U.S.–Born |
U.S.-Born | Non- U.S.–Born |
U.S.-Born | Non- U.S.–Born |
U.S.-Born | Non- U.S.–Born |
|||||||||||||||||
| No. | (%) | No. | (%) | No. | (%) | No. | (%) | No. | (%) | No. | (%) | No. | (%) | No. | (%) | No. | (%) | No. | (%) | No. | (%) | No. | (%) | No. | (%) | No. | (%) | No. | (%) | No. | (%) | |
| 1993 | 263 | (97.0) | 8 | (3.0) | 129 | (3.7) | 3,319 | (96.3) | 8,250 | (92.9) | 630 | (7.1) | –– | –– | –– | –– | 6,318 | (92.3) | 528 | (7.7) | –– | –– | –– | –– | 2,235 | (44.0) | 2,849 | (56.0) | 239 | (77.1) | 71 | (22.9) |
| 1994 | 322 | (98.5) | 5 | (1.5) | 162 | (4.5) | 3,467 | (95.5) | 7,576 | (91.1) | 738 | (8.9) | –– | –– | –– | –– | 6,011 | (92.4) | 494 | (7.6) | –– | –– | –– | –– | 1,989 | (40.1) | 2,967 | (59.9) | 122 | (57.3) | 91 | (42.7) |
| 1995 | 313 | (98.1) | 6 | (1.9) | 148 | (3.9) | 3,689 | (96.1) | 6,750 | (89.4) | 797 | (10.6) | –– | –– | –– | –– | 5,427 | (91.1) | 529 | (8.9) | –– | –– | –– | –– | 1,906 | (39.6) | 2,913 | (60.4) | 119 | (60.7) | 77 | (39.3) |
| 1996 | 281 | (97.9) | 6 | (2.1) | 157 | (4.3) | 3,502 | (95.7) | 6,301 | (88.8) | 794 | (11.2) | –– | –– | –– | –– | 4,967 | (90.8) | 504 | (9.2) | –– | –– | –– | –– | 1,603 | (35.9) | 2,860 | (64.1) | 76 | (46.3) | 88 | (53.7) |
| 1997 | 259 | (98.5) | 4 | (1.5) | 155 | (4.2) | 3,522 | (95.8) | 5,719 | (86.7) | 875 | (13.3) | –– | –– | –– | –– | 4,256 | (88.6) | 546 | (11.4) | –– | –– | –– | –– | 1,464 | (34.9) | 2,727 | (65.1) | 73 | (48.0) | 79 | (52.0) |
| 1998 | 250 | (98.0) | 5 | (2.0) | 139 | (4.0) | 3,372 | (96.0) | 4,972 | (85.5) | 845 | (14.5) | –– | –– | –– | –– | 3,914 | (87.6) | 553 | (12.4) | –– | –– | –– | –– | 1,280 | (31.5) | 2,785 | (68.5) | 55 | (46.2) | 64 | (53.8) |
| 1999 | 237 | (97.9) | 5 | (2.1) | 139 | (4.0) | 3,368 | (96.0) | 4,607 | (83.3) | 924 | (16.7) | –– | –– | –– | –– | 3,638 | (86.4) | 575 | (13.6) | –– | –– | –– | –– | 1,119 | (29.2) | 2,717 | (70.8) | 44 | (55.7) | 35 | (44.3) |
| 2000 | 226 | (97.4) | 6 | (2.6) | 139 | (4.1) | 3,243 | (95.9) | 4,106 | (79.8) | 1,038 | (20.2) | –– | –– | –– | –– | 3,102 | (85.3) | 534 | (14.7) | –– | –– | –– | –– | 1,015 | (26.8) | 2,770 | (73.2) | 44 | (50.6) | 43 | (49.4) |
| 2001 | 214 | (95.1) | 11 | (4.9) | 123 | (3.5) | 3,356 | (96.5) | 3,664 | (76.7) | 1,115 | (23.3) | –– | –– | –– | –– | 2,788 | (83.6) | 547 | (16.4) | –– | –– | –– | –– | 1,025 | (25.7) | 2,967 | (74.3) | 35 | (46.1) | 41 | (53.9) |
| 2002 | 184 | (98.9) | 2 | (1.1) | 125 | (3.8) | 3,189 | (96.2) | 3,401 | (76.4) | 1,051 | (23.6) | –– | –– | –– | –– | 2,548 | (83.9) | 490 | (16.1) | –– | –– | –– | –– | 979 | (24.8) | 2,976 | (75.2) | 28 | (46.7) | 32 | (53.3) |
| 2003 | 176 | (98.3) | 3 | (1.7) | 152 | (4.4) | 3,299 | (95.6) | 3,087 | (74.4) | 1,064 | (25.6) | 31 | (48.4) | 33 | (51.6) | 2,370 | (85.0) | 418 | (15.0) | 9 | (24.3) | 28 | (75.7) | 1,000 | (24.5) | 3,088 | (75.5) | 18 | (52.9) | 16 | (47.1) |
| 2004 | 154 | (98.1) | 3 | (1.9) | 145 | (4.4) | 3,182 | (95.6) | 2,972 | (73.0) | 1,098 | (27.0) | 27 | (42.9) | 36 | (57.1) | 2,211 | (84.1) | 418 | (15.9) | 14 | (41.2) | 20 | (58.8) | 1,064 | (25.5) | 3,108 | (74.5) | 14 | (51.9) | 13 | (48.1) |
| 2005 | 148 | (96.1) | 6 | (3.9) | 120 | (3.8) | 3,077 | (96.2) | 2,874 | (72.8) | 1,075 | (27.2) | 21 | (38.2) | 34 | (61.8) | 2,133 | (83.1) | 434 | (16.9) | 24 | (52.2) | 22 | (47.8) | 955 | (23.7) | 3,073 | (76.3) | 13 | (35.1) | 24 | (64.9) |
| 2006 | 162 | (98.2) | 3 | (1.8) | 130 | (3.9) | 3,164 | (96.1) | 2,594 | (69.6) | 1,132 | (30.4) | 16 | (30.2) | 37 | (69.8) | 1,959 | (82.1) | 426 | (17.9) | 11 | (28.2) | 28 | (71.8) | 983 | (24.4) | 3,053 | (75.6) | 3 | (37.5) | 5 | (62.5) |
| 2007 | 129 | (97.0) | 4 | (3.0) | 134 | (3.9) | 3,302 | (96.1) | 2,462 | (71.1) | 1,003 | (28.9) | 25 | (26.0) | 71 | (74.0) | 1,787 | (81.2) | 413 | (18.8) | 9 | (37.5) | 15 | (62.5) | 880 | (22.8) | 2,976 | (77.2) | 14 | (77.8) | 4 | (22.2) |
| 2008 | 133 | (97.8) | 3 | (2.2) | 149 | (4.4) | 3,245 | (95.6) | 2,239 | (68.3) | 1,041 | (31.7) | 13 | (18.8) | 56 | (81.2) | 1,753 | (81.9) | 387 | (18.1) | 16 | (39.0) | 25 | (61.0) | 922 | (24.3) | 2,877 | (75.7) | 12 | (48.0) | 13 | (52.0) |
| 2009 | 98 | (96.1) | 4 | (3.9) | 146 | (4.6) | 3,049 | (95.4) | 1,920 | (67.1) | 942 | (32.9) | 23 | (31.5) | 50 | (68.5) | 1,434 | (79.2) | 377 | (20.8) | 15 | (31.3) | 33 | (68.8) | 846 | (25.2) | 2,513 | (74.8) | 8 | (25.0) | 24 | (75.0) |
| 2010 | 152 | (98.7) | 2 | (1.3) | 129 | (4.1) | 3,029 | (95.9) | 1,764 | (66.6) | 885 | (33.4) | 35 | (36.8) | 60 | (63.2) | 1,409 | (80.9) | 333 | (19.1) | 16 | (38.1) | 26 | (61.9) | 804 | (25.0) | 2,411 | (75.0) | 0 | (0.0) | 13 | (100.0) |
| 2011 | 130 | (98.5) | 2 | (1.5) | 131 | (4.2) | 3,022 | (95.8) | 1,534 | (63.9) | 865 | (36.1) | 28 | (34.6) | 53 | (65.4) | 1,309 | (80.1) | 326 | (19.9) | 24 | (42.1) | 33 | (57.9) | 762 | (25.4) | 2,236 | (74.6) | 4 | (20.0) | 16 | (80.0) |
| 2012 | 133 | (99.3) | 1 | (0.7) | 122 | (4.0) | 2,918 | (96.0) | 1,348 | (60.0) | 897 | (40.0) | 21 | (32.3) | 44 | (67.7) | 1,256 | (80.9) | 297 | (19.1) | 21 | (36.8) | 36 | (63.2) | 692 | (24.8) | 2,095 | (75.2) | 24 | (57.1) | 18 | (42.9) |
| 2013 | 122 | (98.4) | 2 | (1.6) | 154 | (5.0) | 2,939 | (95.0) | 1,250 | (60.0) | 835 | (40.0) | 17 | (27.4) | 45 | (72.6) | 1,085 | (77.1) | 322 | (22.9) | 23 | (47.9) | 25 | (52.1) | 656 | (24.4) | 2,037 | (75.6) | 13 | (54.2) | 11 | (45.8) |
| 2014 | 117 | (100.0) | 0 | (0.0) | 138 | (4.5) | 2,942 | (95.5) | 1,183 | (58.9) | 826 | (41.1) | 37 | (40.7) | 54 | (59.3) | 960 | (77.5) | 278 | (22.5) | 26 | (32.5) | 54 | (67.5) | 650 | (23.7) | 2,096 | (76.3) | 2 | (12.5) | 14 | (87.5) |
| 2015 | 144 | (99.3) | 1 | (0.7) | 138 | (4.2) | 3,157 | (95.8) | 1,139 | (57.1) | 857 | (42.9) | 40 | (39.6) | 61 | (60.4) | 981 | (79.4) | 255 | (20.6) | 23 | (50.0) | 23 | (50.0) | 658 | (24.4) | 2,036 | (75.6) | 3 | (16.7) | 15 | (83.3) |
| 2016 | 110 | (100.0) | 0 | (0.0) | 145 | (4.5) | 3,061 | (95.5) | 1,068 | (53.9) | 914 | (46.1) | 29 | (38.2) | 47 | (61.8) | 910 | (76.4) | 281 | (23.6) | 19 | (30.6) | 43 | (69.4) | 601 | (23.2) | 1,988 | (76.8) | 2 | (9.5) | 19 | (90.5) |
| 2017 | 91 | (97.8) | 2 | (2.2) | 127 | (3.9) | 3,141 | (96.1) | 1,003 | (52.6) | 905 | (47.4) | 44 | (40.0) | 66 | (60.0) | 793 | (75.0) | 264 | (25.0) | 23 | (39.7) | 35 | (60.3) | 580 | (22.7) | 1,970 | (77.3) | 5 | (23.8) | 16 | (76.2) |
| 2018 | 100 | (98.0) | 2 | (2.0) | 135 | (4.2) | 3,075 | (95.8) | 952 | (52.9) | 849 | (47.1) | 41 | (36.0) | 73 | (64.0) | 808 | (75.7) | 260 | (24.3) | 22 | (37.9) | 36 | (62.1) | 585 | (22.3) | 2,039 | (77.7) | 4 | (15.4) | 22 | (84.6) |
| 2019 | 79 | (97.5) | 2 | (2.5) | 116 | (3.7) | 3,051 | (96.3) | 908 | (52.0) | 838 | (48.0) | 27 | (25.5) | 79 | (74.5) | 758 | (74.8) | 255 | (25.2) | 22 | (33.3) | 44 | (66.7) | 610 | (22.7) | 2,076 | (77.3) | 10 | (31.3) | 22 | (68.8) |
| 2020 | 79 | (100.0) | 0 | (0.0) | 97 | (3.8) | 2,466 | (96.2) | 730 | (52.1) | 671 | (47.9) | 44 | (38.3) | 71 | (61.7) | 569 | (72.5) | 216 | (27.5) | 16 | (32.0) | 34 | (68.0) | 479 | (22.6) | 1,643 | (77.4) | 4 | (13.3) | 26 | (86.7) |
1Asian race category reporting includes Pacific Islander from 1993–2002.
2Native Hawaiian/Other Pacific Islander race first reported separately in 2003.
3Indicates two or more races reported by a person. Category first reported in 2003 and does not include persons of Hispanic/Latino origin. In 2020, top 3 multiple race combinations were Asian and White (n=11), Black/African American and White (n=7), and American Indian/Alaska Native and White (n=6). Among U.S.-born persons, top 3 multiple race combinations were Black/African American and White (n=5), American Indian/Alaska Native and White (n=3), and Native Hawaiian/Other Pacific Islander and White (n=2). Among non-U.S.-born persons, top 3 multiple race combinations were Asian and White (n=10), Asian and unknown race (n=5), and Asian and Native Hawaiian/Other Pacific Islander as well as American Indian/Alaska Native and White (n=3 for each group).
4Persons of Hispanic ethnicity may be of any or multiple race.
5The higher count for unknown or missing race results for 1993–2001 reflect the impact of a transitional period of incorporating new race definitions for Asian, Native Hawaiian, and multiple race in 2003.
Note: Case counts for race categories (American Indian/Alaska Native, Asian, Black/African American, Native Hawaiian/Other Pacific Islander, and White) do not include persons of Hispanic/Latino origin or multiple race. Non-U.S.–born persons include those born outside the United States (including the U.S. territories), except persons born to at least one U.S. citizen parent.
Persons with unknown origin are not included in this table.
Data for all years updated through June 14, 2021.
Double dashes (––) indicate that data not available.