Reported Tuberculosis in the United States, 2020
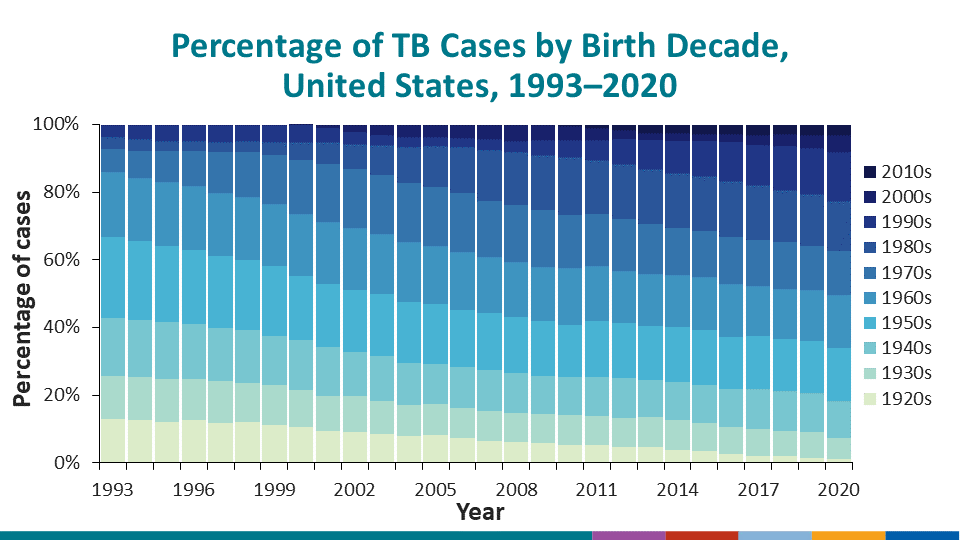
Table 4D. Tuberculosis Percentages by Birth Decade Cohort: United States, 1993–20201
See Surveillance Slide #37.
| Year | Birth Cohort Decade | |||||||||
|---|---|---|---|---|---|---|---|---|---|---|
| 1920s | 1930s | 1940s | 1950s | 1960s | 1970s | 1980s | 1990s | 2000s | 2010s | |
| (%) | (%) | (%) | (%) | (%) | (%) | (%) | (%) | (%) | (%) | |
| 1993 | (11.1) | (10.9) | (14.9) | (20.8) | (16.5) | (5.8) | (3.2) | (3.1) | (0.0) | (0.0) |
| 1994 | (11.0) | (11.1) | (14.8) | (20.4) | (16.4) | (7.1) | (3.0) | (3.7) | (0.0) | (0.0) |
| 1995 | (10.6) | (11.1) | (14.7) | (19.8) | (16.6) | (8.0) | (2.7) | (4.2) | (0.0) | (0.0) |
| 1996 | (11.2) | (11.0) | (14.3) | (19.4) | (17.0) | (9.2) | (2.6) | (4.4) | (0.0) | (0.0) |
| 1997 | (10.6) | (11.2) | (14.0) | (18.9) | (16.8) | (10.9) | (2.6) | (4.7) | (0.0) | (0.0) |
| 1998 | (10.9) | (10.6) | (14.1) | (18.8) | (17.1) | (11.9) | (3.0) | (4.5) | (0.0) | (0.0) |
| 1999 | (10.3) | (10.8) | (13.4) | (18.8) | (17.1) | (13.2) | (3.5) | (4.8) | (0.0) | (0.0) |
| 2000 | (9.9) | (10.1) | (14.0) | (17.8) | (17.2) | (14.8) | (5.0) | (4.6) | (0.2) | (0.0) |
| 2001 | (8.9) | (9.9) | (13.6) | (17.7) | (17.3) | (16.1) | (6.1) | (3.9) | (1.1) | (0.0) |
| 2002 | (8.8) | (9.9) | (12.5) | (17.6) | (17.4) | (16.6) | (7.0) | (3.5) | (2.1) | (0.0) |
| 2003 | (8.2) | (9.4) | (12.7) | (17.5) | (17.1) | (16.8) | (8.7) | (2.8) | (2.8) | (0.0) |
| 2004 | (7.7) | (8.9) | (11.8) | (17.6) | (17.2) | (16.7) | (10.5) | (2.9) | (3.5) | (0.0) |
| 2005 | (7.9) | (9.0) | (11.7) | (17.2) | (16.7) | (17.1) | (11.6) | (2.7) | (3.5) | (0.0) |
| 2006 | (7.1) | (8.7) | (11.9) | (16.5) | (16.8) | (17.2) | (13.4) | (2.4) | (4.0) | (0.0) |
| 2007 | (6.4) | (8.7) | (11.8) | (16.7) | (16.3) | (16.3) | (14.8) | (3.1) | (4.2) | (0.0) |
| 2008 | (6.1) | (8.3) | (11.7) | (16.4) | (15.9) | (16.7) | (15.5) | (3.3) | (4.7) | (0.0) |
| 2009 | (5.7) | (8.6) | (11.2) | (16.0) | (15.8) | (16.9) | (16.0) | (4.2) | (4.6) | (0.0) |
| 2010 | (5.3) | (8.6) | (11.2) | (15.5) | (16.5) | (15.8) | (16.8) | (5.0) | (4.3) | (0.3) |
| 2011 | (5.2) | (8.6) | (11.4) | (16.6) | (16.0) | (15.3) | (16.0) | (5.7) | (3.5) | (1.1) |
| 2012 | (4.6) | (8.7) | (11.6) | (16.3) | (15.3) | (15.2) | (16.3) | (7.4) | (2.6) | (1.5) |
| 2013 | (4.5) | (8.9) | (10.8) | (16.1) | (15.4) | (14.7) | (16.2) | (8.4) | (2.3) | (2.3) |
| 2014 | (3.8) | (8.7) | (11.3) | (16.4) | (15.2) | (14.0) | (16.0) | (9.7) | (2.2) | (2.5) |
| 2015 | (3.4) | (8.3) | (11.3) | (16.0) | (15.8) | (13.6) | (16.1) | (10.5) | (2.1) | (2.6) |
| 2016 | (2.7) | (7.9) | (11.3) | (15.3) | (15.6) | (14.0) | (16.4) | (11.7) | (2.3) | (2.7) |
| 2017 | (2.0) | (8.1) | (11.7) | (15.5) | (14.8) | (13.6) | (16.2) | (12.0) | (3.0) | (3.0) |
| 2018 | (1.9) | (7.5) | (11.9) | (15.3) | (14.9) | (13.7) | (15.4) | (13.1) | (3.6) | (2.7) |
| 2019 | (1.5) | (7.6) | (11.5) | (15.5) | (15.0) | (13.0) | (15.5) | (13.6) | (3.8) | (3.0) |
| 2020 | (1.2) | (6.1) | (10.9) | (15.8) | (15.6) | (13.0) | (14.8) | (14.5) | (4.9) | (3.1) |
1Percentages are calculated from total number of TB cases and only include percentage distributions from 1920s through 2010s.