Reported Tuberculosis in the United States, 2020
Table 24. Characteristics of Tuberculosis Cases in GENType Clusters,1 by Alert Levels Based on Log-Likelihood Ratios (LLR):2 United States, 2018–2020
See Surveillance Slide #69.
| Case Characteristics | Unique | Clustered | Alert Levels for Clustered Cases3 | ||||||||
|---|---|---|---|---|---|---|---|---|---|---|---|
| Non-alerted (LLR <5) | Medium (LLR 5–<10) | High (LLR ≥10) | |||||||||
| No. | (%) | No. | (%) | No. | (%) | No. | (%) | No. | (%) | ||
| Total | 15,746 | (81.0) | 3,687 | (19.0) | 2,266 | (61.5) | 883 | (23.9) | 538 | (14.6) | |
| Origin of Birth | |||||||||||
| U.S.-born | 3,552 | (66.4) | 1,799 | (33.6) | 782 | (43.5) | 584 | (32.5) | 433 | (24.1) | |
| Non-U.S.–born | 12,169 | (86.6) | 1,883 | (13.4) | 1,480 | (78.6) | 298 | (15.8) | 105 | (5.6) | |
| Unknown or Missing | 25 | (83.3) | 5 | (16.7) | 4 | (80.0) | 1 | (20.0) | 0 | (0.0) | |
| Race and Ethnicity | |||||||||||
| Hispanic or Latino | 4,485 | (78.5) | 1,230 | (21.5) | 825 | (67.1) | 303 | (24.6) | 102 | (8.3) | |
| American Indian/Alaska Native | 97 | (46.6) | 111 | (53.4) | 11 | (9.9) | 35 | (31.5) | 65 | (58.6) | |
| Asian | 6,335 | (88.4) | 832 | (11.6) | 741 | (89.1) | 69 | (8.3) | 22 | (2.6) | |
| Black or African American | 2,717 | (73.9) | 958 | (26.1) | 409 | (42.7) | 324 | (33.8) | 225 | (23.5) | |
| Native Hawaiian/Other Pacific Islander | 118 | (48.6) | 125 | (51.4) | 70 | (56.0) | 19 | (15.2) | 36 | (28.8) | |
| White | 1,824 | (82.3) | 392 | (17.7) | 192 | (49.0) | 120 | (30.6) | 80 | (20.4) | |
| Multiple Race | 111 | (79.9) | 28 | (20.1) | 10 | (35.7) | 10 | (35.7) | 8 | (28.6) | |
| Unknown or Missing | 59 | (84.3) | 11 | (15.7) | 8 | (72.7) | 3 | (27.3) | 0 | (0.0) | |
| Age Group (Years) | |||||||||||
| 0–4 | 67 | (36.8) | 115 | (63.2) | 61 | (53.0) | 37 | (32.2) | 17 | (14.8) | |
| 5–14 | 123 | (60.9) | 79 | (39.1) | 39 | (49.4) | 19 | (24.1) | 21 | (26.6) | |
| 15–24 | 1,469 | (76.8) | 443 | (23.2) | 268 | (60.5) | 121 | (27.3) | 54 | (12.2) | |
| 25–44 | 4,691 | (80.7) | 1,120 | (19.3) | 657 | (58.7) | 271 | (24.2) | 192 | (17.1) | |
| 45–64 | 4,557 | (78.7) | 1,232 | (21.3) | 728 | (59.1) | 314 | (25.5) | 190 | (15.4) | |
| ≥65 | 4,838 | (87.4) | 698 | (12.6) | 513 | (73.5) | 121 | (17.3) | 64 | (9.2) | |
| Unknown | 1 | (100.0) | 0 | (0.0) | |||||||
| Disease Site | |||||||||||
| Pulmonary Only | 11,070 | (79.6) | 2,845 | (20.4) | 1,723 | (60.6) | 703 | (24.7) | 419 | (14.7) | |
| Extrapulmonary | 2,665 | (86.8) | 405 | (13.2) | 270 | (66.7) | 84 | (20.7) | 51 | (12.6) | |
| Both | 1,996 | (82.0) | 437 | (18.0) | 273 | (62.5) | 96 | (22.0) | 68 | (15.6) | |
| Unknown | 15 | (100.0) | 0 | (0.0) | |||||||
| Sputum Smear | |||||||||||
| Positive | 7,331 | (78.8) | 1,972 | (21.2) | 1,191 | (60.4) | 485 | (24.6) | 296 | (15.0) | |
| Negative | 6,585 | (83.3) | 1,318 | (16.7) | 852 | (64.6) | 302 | (22.9) | 164 | (12.4) | |
| Not Done | 1,804 | (82.1) | 392 | (17.9) | 222 | (56.6) | 92 | (23.5) | 78 | (19.9) | |
| Unknown or Missing | 26 | (83.9) | 5 | (16.1) | 1 | (20.0) | 4 | (80.0) | 0 | (0.0) | |
| Cavitary Disease4 | |||||||||||
| Yes | 172 | (78.5) | 47 | (21.5) | 29 | (61.7) | 10 | (21.3) | 8 | (17.0) | |
| No | 1,344 | (80.7) | 321 | (19.3) | 204 | (63.6) | 67 | (20.9) | 50 | (15.6) | |
| Unknown or Missing | 16 | (80.0) | 4 | (20.0) | 1 | (25.0) | 2 | (50.0) | 1 | (25.0) | |
| Homeless Within the Past Year | |||||||||||
| Yes | 527 | (61.8) | 326 | (38.2) | 153 | (46.9) | 89 | (27.3) | 84 | (25.8) | |
| No | 15,039 | (81.9) | 3,313 | (18.1) | 2,094 | (63.2) | 786 | (23.7) | 433 | (13.1) | |
| Unknown or Missing | 180 | (78.9) | 48 | (21.1) | 19 | (39.6) | 8 | (16.7) | 21 | (43.8) | |
| Excess Alcohol Use Within the Past Year | |||||||||||
| Yes | 1,218 | (69.0) | 548 | (31.0) | 263 | (48.0) | 149 | (27.2) | 136 | (24.8) | |
| No | 14,262 | (82.4) | 3,047 | (17.6) | 1,958 | (64.3) | 712 | (23.4) | 377 | (12.4) | |
| Unknown or Missing | 266 | (74.3) | 92 | (25.7) | 45 | (48.9) | 22 | (23.9) | 25 | (27.2) | |
| Injection Drug Use Within the Past Year | |||||||||||
| Yes | 139 | (59.1) | 96 | (40.9) | 49 | (51.0) | 23 | (24.0) | 24 | (25.0) | |
| No | 15,336 | (81.4) | 3,506 | (18.6) | 2,174 | (62.0) | 838 | (23.9) | 494 | (14.1) | |
| Unknown or Missing | 271 | (76.1) | 85 | (23.9) | 43 | (50.6) | 22 | (25.9) | 20 | (23.5) | |
| Non-Injection Drug Use Within the Past Year | |||||||||||
| Yes | 839 | (60.0) | 560 | (40.0) | 253 | (45.2) | 164 | (29.3) | 143 | (25.5) | |
| No | 14,646 | (82.8) | 3,046 | (17.2) | 1,973 | (64.8) | 696 | (22.8) | 377 | (12.4) | |
| Unknown or Missing | 261 | (76.3) | 81 | (23.7) | 40 | (49.4) | 23 | (28.4) | 18 | (22.2) | |
| Resident of a Correctional Facility at the Time of Diagnosis | |||||||||||
| Yes | 365 | (71.9) | 143 | (28.1) | 63 | (44.1) | 28 | (19.6) | 52 | (36.4) | |
| No | 15,291 | (81.3) | 3,519 | (18.7) | 2,189 | (62.2) | 848 | (24.1) | 482 | (13.7) | |
| Unknown or Missing | 90 | (78.3) | 25 | (21.7) | 14 | (56.0) | 7 | (28.0) | 4 | (16.0) | |
| HIV Status | |||||||||||
| Positive | 675 | (78.8) | 182 | (21.2) | 94 | (51.6) | 43 | (23.6) | 45 | (24.7) | |
| Negative | 13,319 | (80.6) | 3,213 | (19.4) | 1,976 | (61.5) | 775 | (24.1) | 462 | (14.4) | |
| Refused | 345 | (86.3) | 55 | (13.8) | 34 | (61.8) | 17 | (30.9) | 4 | (7.3) | |
| Not Offered | 988 | (83.8) | 191 | (16.2) | 131 | (68.6) | 39 | (20.4) | 21 | (11.0) | |
| Unknown, Missing, or Indeterminate | 419 | (90.1) | 46 | (9.9) | 31 | (67.4) | 9 | (19.6) | 6 | (13.0) | |
| Multidrug-Resistant TB | |||||||||||
| Yes | 199 | (80.9) | 47 | (19.1) | 37 | (78.7) | 0 | (0.0) | 10 | (21.3) | |
| No | 14,957 | (80.8) | 3,548 | (19.2) | 2,174 | (61.3) | 861 | (24.3) | 513 | (14.5) | |
| Unknown or Missing | 590 | (86.5) | 92 | (13.5) | 55 | (59.8) | 22 | (23.9) | 15 | (16.3) | |
1GENType clusters have two or more cases with matching spoligotype and 24-locus mycobacterial interspersed repetitive unit-variable number tandem repeat type within a county during the specified 3-year time period.
2Alert levels are based on a log-likelihood ratio (LLR), which calculates the geographical concentration of a genotype in a county compared to the rest of the country during a 3-year period.
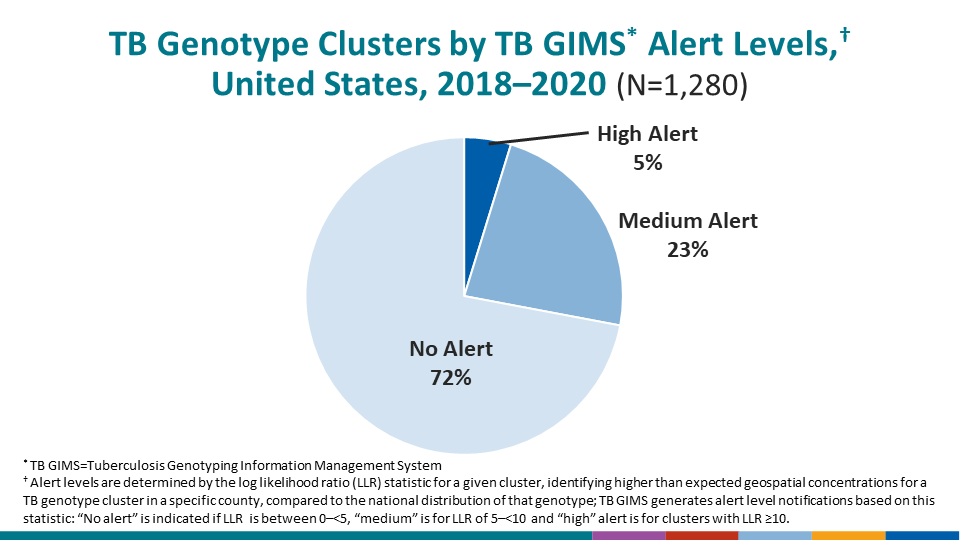
3There were 3,687 cases in 1,280 clusters: 538 cases were in 61 (4.8%) high alert clusters; 883 cases were in 297 (23.2%) medium alert clusters, and 2,266 cases were in 922 (72.0%) non-alert clusters.
4Cavitary disease is only assessed for persons with pulmonary TB and an abnormal x-ray.