Reported Tuberculosis in the United States, 2020
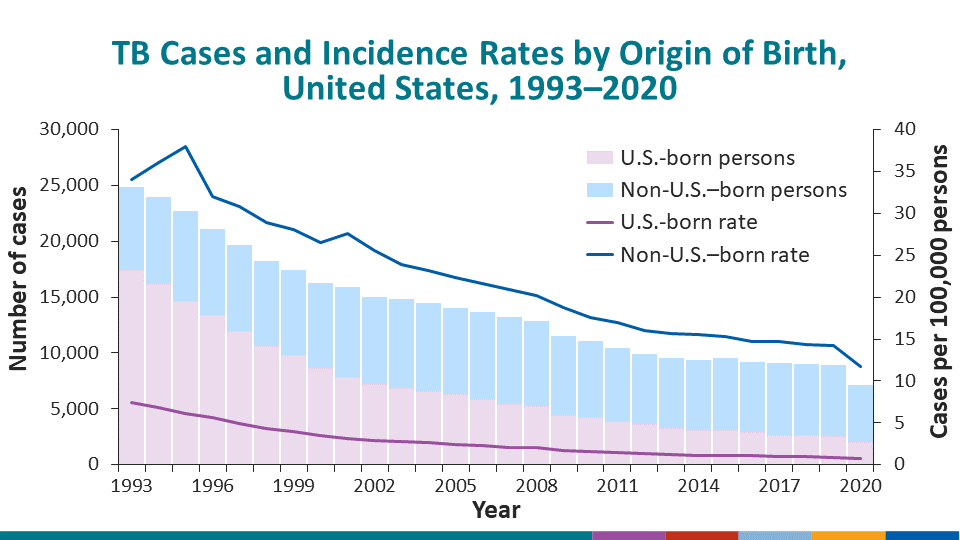
Table 5. Tuberculosis Cases, Percentages, and Incidence Rates per 100,000 Population by Origin of Birth: United States, 1993–2020
See Surveillance Slides #10, #11, and #12
| Year | Total Cases | U.S.-Born Persons | Non-U.S.–Born Persons1 | Unknown/missing | |||||
|---|---|---|---|---|---|---|---|---|---|
| No. | (%) | Rate | No. | (%) | Rate | No. | (%) | ||
| 1993 | 25,105 | 17,434 | (69.4) | 7.4 | 7,405 | (29.5) | 34.0 | 266 | (1.1) |
| 1994 | 24,208 | 16,182 | (66.8) | 6.8 | 7,762 | (32.1) | 36.1 | 264 | (1.1) |
| 1995 | 22,727 | 14,663 | (64.5) | 6.1 | 8,011 | (35.2) | 38.0 | 53 | (0.2) |
| 1996 | 21,212 | 13,385 | (63.1) | 5.6 | 7,754 | (36.6) | 32.0 | 73 | (0.3) |
| 1997 | 19,753 | 11,926 | (60.4) | 4.9 | 7,753 | (39.2) | 30.9 | 74 | (0.4) |
| 1998 | 18,288 | 10,610 | (58.0) | 4.4 | 7,624 | (41.7) | 28.9 | 54 | (0.3) |
| 1999 | 17,500 | 9,784 | (55.9) | 4.0 | 7,624 | (43.6) | 28.1 | 92 | (0.5) |
| 2000 | 16,308 | 8,632 | (52.9) | 3.5 | 7,634 | (46.8) | 26.5 | 42 | (0.3) |
| 2001 | 15,949 | 7,849 | (49.2) | 3.2 | 8,037 | (50.4) | 27.7 | 63 | (0.4) |
| 2002 | 15,060 | 7,265 | (48.2) | 2.9 | 7,740 | (51.4) | 25.5 | 55 | (0.4) |
| 2003 | 14,838 | 6,843 | (46.1) | 2.7 | 7,949 | (53.6) | 23.9 | 46 | (0.3) |
| 2004 | 14,502 | 6,601 | (45.5) | 2.6 | 7,878 | (54.3) | 23.2 | 23 | (0.2) |
| 2005 | 14,063 | 6,288 | (44.7) | 2.5 | 7,745 | (55.1) | 22.3 | 30 | (0.2) |
| 2006 | 13,730 | 5,858 | (42.7) | 2.3 | 7,848 | (57.2) | 21.7 | 24 | (0.2) |
| 2007 | 13,288 | 5,440 | (40.9) | 2.1 | 7,788 | (58.6) | 20.9 | 60 | (0.5) |
| 2008 | 12,893 | 5,237 | (40.6) | 2.0 | 7,647 | (59.3) | 20.2 | 9 | (0.1) |
| 2009 | 11,499 | 4,490 | (39.0) | 1.7 | 6,992 | (60.8) | 18.8 | 17 | (0.1) |
| 2010 | 11,076 | 4,309 | (38.9) | 1.6 | 6,759 | (61.0) | 17.6 | 8 | (0.1) |
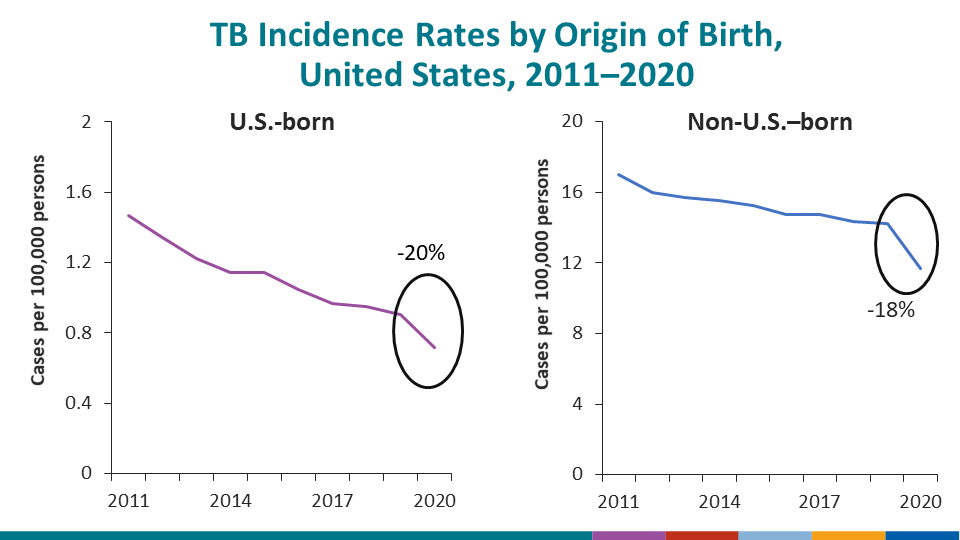
| 2011 | 10,480 | 3,922 | (37.4) | 1.5 | 6,553 | (62.5) | 17.0 | 5 | (0.0) |
| 2012 | 9,925 | 3,617 | (36.4) | 1.3 | 6,306 | (63.5) | 16.0 | 2 | (0.0) |
| 2013 | 9,545 | 3,320 | (34.8) | 1.2 | 6,216 | (65.1) | 15.7 | 9 | (0.1) |
| 2014 | 9,383 | 3,113 | (33.2) | 1.1 | 6,264 | (66.8) | 15.5 | 6 | (0.1) |
| 2015 | 9,536 | 3,126 | (32.8) | 1.1 | 6,405 | (67.2) | 15.2 | 5 | (0.1) |
| 2016 | 9,242 | 2,884 | (31.2) | 1.0 | 6,353 | (68.7) | 14.7 | 5 | (0.1) |
| 2017 | 9,071 | 2,666 | (29.4) | 1.0 | 6,399 | (70.5) | 14.7 | 6 | (0.1) |
| 2018 | 9,006 | 2,647 | (29.4) | 1.0 | 6,356 | (70.6) | 14.3 | 3 | (0.0) |
| 2019 | 8,904 | 2,530 | (28.4) | 0.9 | 6,367 | (71.5) | 14.2 | 7 | (0.1) |
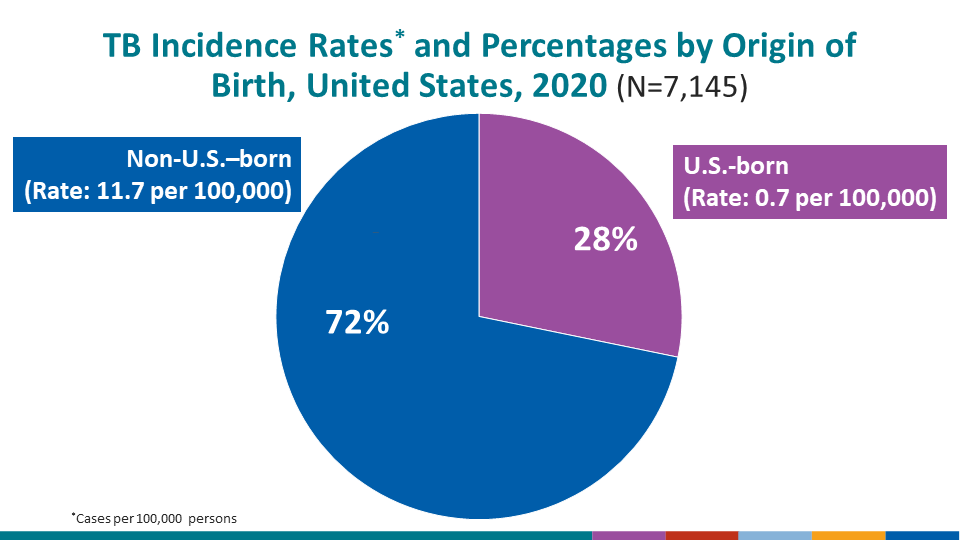
| 2020 | 7,174 | 2,018 | (28.1) | 0.7 | 5,127 | (71.5) | 11.7 | 29 | (0.4) |
1Includes persons born outside the United States (including U.S. territories), except persons born to at least one U.S. citizen parent.
Note: Denominators for computing incidence rates for year 1993 were obtained from Quarterly Estimates of the United States Foreign-Born and Native Resident Populations: April 1, 1990–July 1, 1999; Denominators for computing the 1994–2020 rates are based on the U.S. Census Bureau, Current Population Survey via Data Ferrett for 1994–2018 (this site has since been disabled by the U.S. Census Bureau); and U.S. Census Bureau’s MDAT tool for 2019 and 2020; accessed June 16, 2021. Current Population Survey estimates do not include institutionalized populations.
Data for all years updated through June 14, 2021.
Zero % (0.0) denotes <0.05%.