Reported Tuberculosis in the United States, 2020
Table 20. Tuberculosis Cases and Incidence Rates per 100,000 Population, by Hispanic Ethnicity and Non-Hispanic Race, Sex, and Age Group: United States, 2020
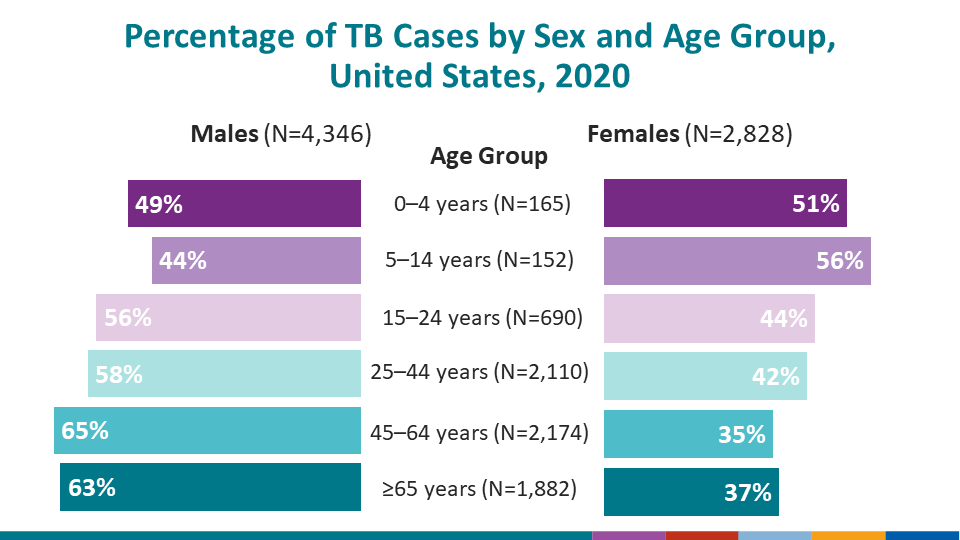
See Surveillance Slide #38.
| Race/Ethnicity/Sex | All Ages | Age Group | ||||||||||||||
|---|---|---|---|---|---|---|---|---|---|---|---|---|---|---|---|---|
| 0-4 | 5–14 | 15–24 | 25–44 | 45–64 | ≥65 | Unknown | ||||||||||
| No. | Rate | No. | Rate | No. | Rate | No. | Rate | No. | Rate | No. | Rate | No. | Rate | No. | Rate | |
| Total Cases | 7,174 | 2.2 | 165 | 0.9 | 152 | 0.4 | 690 | 1.6 | 2,110 | 2.4 | 2,174 | 2.6 | 1,882 | 3.4 | 1 | –– |
| Male | 4,346 | 2.7 | 81 | 0.8 | 67 | 0.3 | 385 | 1.8 | 1,214 | 2.7 | 1,406 | 3.5 | 1,193 | 4.8 | 0 | –– |
| Female | 2,828 | 1.7 | 84 | 0.9 | 85 | 0.4 | 305 | 1.5 | 896 | 2.0 | 768 | 1.8 | 689 | 2.2 | 1 | –– |
| Unknown | 0 | –– | 0 | –– | 0 | –– | 0 | –– | 0 | –– | 0 | –– | 0 | –– | 0 | –– |
| Hispanic/Latino1 | 2,133 | 3.5 | 75 | 1.5 | 58 | 0.6 | 252 | 2.5 | 669 | 3.6 | 642 | 5.1 | 437 | 9.0 | 0 | –– |
| Male | 1,354 | 4.4 | 32 | 1.3 | 24 | 0.4 | 149 | 2.9 | 418 | 4.4 | 460 | 7.4 | 271 | 12.7 | 0 | –– |
| Female | 779 | 2.6 | 43 | 1.8 | 34 | 0.7 | 103 | 2.1 | 251 | 2.8 | 182 | 2.9 | 166 | 6.0 | 0 | –– |
| Unknown | 0 | –– | 0 | –– | 0 | –– | 0 | –– | 0 | –– | 0 | –– | 0 | –– | 0 | –– |
| American Indian/Alaska Native | 79 | 3.2 | 3 | 2.0 | 10 | 2.9 | 5 | 1.4 | 23 | 3.4 | 21 | 3.6 | 17 | 5.4 | 0 | –– |
| Male | 50 | 4.2 | 2 | 2.7 | 9 | 5.2 | 4 | 2.2 | 15 | 4.4 | 15 | 5.4 | 5 | 3.5 | 0 | –– |
| Female | 29 | 2.3 | 1 | 1.4 | 1 | 0.6 | 1 | 0.6 | 8 | 2.3 | 6 | 2.0 | 12 | 6.8 | 0 | –– |
| Unknown | 0 | –– | 0 | –– | 0 | –– | 0 | –– | 0 | –– | 0 | –– | 0 | –– | 0 | –– |
| Asian | 2,568 | 13.3 | 25 | 2.3 | 31 | 1.4 | 206 | 8.8 | 685 | 10.9 | 767 | 15.9 | 854 | 32.6 | 0 | –– |
| Male | 1,518 | 16.4 | 14 | 2.5 | 11 | 1.0 | 107 | 9.1 | 363 | 11.9 | 466 | 21.0 | 557 | 49.4 | 0 | –– |
| Female | 1,050 | 10.4 | 11 | 2.1 | 20 | 1.9 | 99 | 8.5 | 322 | 9.8 | 301 | 11.6 | 297 | 19.9 | 0 | –– |
| Unknown | 0 | –– | 0 | –– | 0 | –– | 0 | –– | 0 | –– | 0 | –– | 0 | –– | 0 | –– |
| Black/African American | 1,409 | 3.4 | 40 | 1.5 | 39 | 0.7 | 161 | 2.7 | 500 | 4.2 | 440 | 4.4 | 228 | 4.4 | 1 | –– |
| Male | 818 | 4.1 | 23 | 1.7 | 18 | 0.6 | 92 | 3.1 | 280 | 4.8 | 271 | 5.8 | 134 | 6.4 | 0 | –– |
| Female | 591 | 2.7 | 17 | 1.3 | 21 | 0.8 | 69 | 2.4 | 220 | 3.6 | 169 | 3.1 | 94 | 3.0 | 1 | –– |
| Unknown | 0 | –– | 0 | –– | 0 | –– | 0 | –– | 0 | –– | 0 | –– | 0 | –– | 0 | –– |
| Native Hawaiian/Other Pacific Islander | 115 | 18.7 | 11 | 24.9 | 11 | 12.8 | 18 | 21.2 | 29 | 14.8 | 31 | 22.4 | 15 | 23.3 | 0 | –– |
| Male | 58 | 18.7 | 7 | 30.8 | 5 | 11.4 | 11 | 25.2 | 16 | 15.9 | 11 | 16.0 | 8 | 26.7 | 0 | –– |
| Female | 57 | 18.7 | 4 | 18.6 | 6 | 14.2 | 7 | 17.0 | 13 | 13.6 | 20 | 28.7 | 7 | 20.4 | 0 | –– |
| Unknown | 0 | –– | 0 | –– | 0 | –– | 0 | –– | 0 | –– | 0 | –– | 0 | –– | 0 | –– |
| White | 788 | 0.4 | 10 | 0.1 | 1 | 0.0 | 39 | 0.2 | 177 | 0.4 | 252 | 0.5 | 309 | 0.7 | 0 | –– |
| Male | 503 | 0.5 | 3 | 0.1 | 0 | 0.0 | 18 | 0.2 | 105 | 0.4 | 170 | 0.6 | 207 | 1.1 | 0 | –– |
| Female | 285 | 0.3 | 7 | 0.2 | 1 | 0.0 | 21 | 0.2 | 72 | 0.3 | 82 | 0.3 | 102 | 0.4 | 0 | –– |
| Unknown | 0 | –– | 0 | –– | 0 | –– | 0 | –– | 0 | –– | 0 | –– | 0 | –– | 0 | –– |
| Multiple Race2 | 50 | 0.7 | 1 | 0.1 | 2 | 0.1 | 8 | 0.5 | 16 | 0.9 | 11 | 1.1 | 12 | 2.6 | 0 | –– |
| Male | 27 | 0.7 | 0 | 0.0 | 0 | 0.0 | 4 | 0.5 | 10 | 1.2 | 7 | 1.5 | 6 | 2.9 | 0 | –– |
| Female | 23 | 0.6 | 1 | 0.2 | 2 | 0.2 | 4 | 0.6 | 6 | 0.7 | 4 | 0.8 | 6 | 2.4 | 0 | –– |
| Unknown | 0 | –– | 0 | –– | 0 | –– | 0 | –– | 0 | –– | 0 | –– | 0 | –– | 0 | –– |
| Unknown | 32 | –– | 0 | –– | 0 | –– | 1 | –– | 11 | –– | 10 | –– | 10 | –– | 0 | –– |
| Male | 18 | –– | 0 | –– | 0 | –– | 0 | –– | 7 | –– | 6 | –– | 5 | –– | 0 | –– |
| Female | 14 | –– | 0 | –– | 0 | –– | 1 | –– | 4 | –– | 4 | –– | 5 | –– | 0 | –– |
| Unknown | 0 | –– | 0 | –– | 0 | –– | 0 | –– | 0 | –– | 0 | –– | 0 | –– | 0 | |
1Persons of Hispanic/Latino origin may be of any or multiple race.
2Indicates two or more races reported for a person, and does not include persons of Hispanic/Latino origin.
Note: Denominators for computing 2020 incidence rates were obtained from the U.S. Census Bureau Monthly National Population Estimates by Age, Sex, Race, Hispanic Origin, and Population Universe for the United States: July 1, 2020 to December 1, 2020; accessed June 29, 2021.
Case counts for race categories (American Indian/Alaska Native, Asian, Black/African American, Native Hawaiian/Other Pacific Islander, and White) are mutually exclusive and do not include persons of Hispanic/Latino origin or multiple race.
See Technical Notes.
Double dashes (––) indicate that data are not available.