Reported Tuberculosis in the United States, 2020
Table 32. Tuberculosis Cases and Percentages, U.S.-born and Non-U.S.–Born Persons1: Reporting Areas, 2020
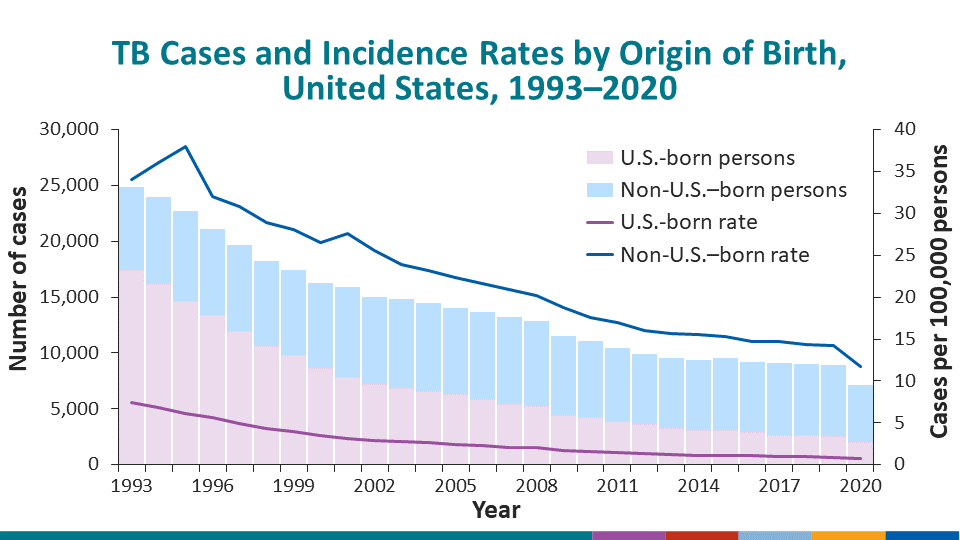
See Surveillance Slide #10
| Reporting Area | Total Cases | U.S.-Born Persons | Non-U.S.–Born Persons1 | Unknown Origin | |||
|---|---|---|---|---|---|---|---|
| No. | (%) | No. | (%) | No. | (%) | ||
| United States | 7,174 | 2,018 | (28.1) | 5,127 | (71.5) | 29 | (0.4) |
| Alabama | 73 | 48 | (65.8) | 25 | (34.2) | 0 | (0.0) |
| Alaska | 58 | 45 | (77.6) | 13 | (22.4) | 0 | (0.0) |
| Arizona | 136 | 44 | (32.4) | 92 | (67.6) | 0 | (0.0) |
| Arkansas | 59 | 38 | (64.4) | 21 | (35.6) | 0 | (0.0) |
| California | 1,705 | 278 | (16.3) | 1,419 | (83.2) | 8 | (0.5) |
| Colorado | 52 | 11 | (21.2) | 40 | (76.9) | 1 | (1.9) |
| Connecticut | 54 | 11 | (20.4) | 43 | (79.6) | 0 | (0.0) |
| Delaware | 17 | 7 | (41.2) | 9 | (52.9) | 1 | (5.9) |
| District of Columbia | 19 | 2 | (10.5) | 17 | (89.5) | 0 | (0.0) |
| Florida | 412 | 143 | (34.7) | 269 | (65.3) | 0 | (0.0) |
| Georgia | 221 | 96 | (43.4) | 122 | (55.2) | 3 | (1.4) |
| Hawaii | 92 | 17 | (18.5) | 75 | (81.5) | 0 | (0.0) |
| Idaho | 8 | 4 | (50.0) | 3 | (37.5) | 1 | (12.5) |
| Illinois | 216 | 52 | (24.1) | 164 | (75.9) | 0 | (0.0) |
| Indiana | 92 | 39 | (42.4) | 53 | (57.6) | 0 | (0.0) |
| Iowa | 39 | 13 | (33.3) | 25 | (64.1) | 1 | (2.6) |
| Kansas | 37 | 10 | (27.0) | 27 | (73.0) | 0 | (0.0) |
| Kentucky | 67 | 32 | (47.8) | 35 | (52.2) | 0 | (0.0) |
| Louisiana | 99 | 71 | (71.7) | 28 | (28.3) | 0 | (0.0) |
| Maine | 17 | 6 | (35.3) | 11 | (64.7) | 0 | (0.0) |
| Maryland | 149 | 29 | (19.5) | 120 | (80.5) | 0 | (0.0) |
| Massachusetts | 142 | 17 | (12.0) | 125 | (88.0) | 0 | (0.0) |
| Michigan | 101 | 49 | (48.5) | 52 | (51.5) | 0 | (0.0) |
| Minnesota | 117 | 12 | (10.3) | 105 | (89.7) | 0 | (0.0) |
| Mississippi | 41 | 30 | (73.2) | 11 | (26.8) | 0 | (0.0) |
| Missouri | 72 | 30 | (41.7) | 42 | (58.3) | 0 | (0.0) |
| Montana | 4 | 3 | (75.0) | 1 | (25.0) | 0 | (0.0) |
| Nebraska | 36 | 15 | (41.7) | 21 | (58.3) | 0 | (0.0) |
| Nevada | 57 | 16 | (28.1) | 41 | (71.9) | 0 | (0.0) |
| New Hampshire | 12 | 1 | (8.3) | 11 | (91.7) | 0 | (0.0) |
| New Jersey | 245 | 43 | (17.6) | 201 | (82.0) | 1 | (0.4) |
| New Mexico | 29 | 10 | (34.5) | 19 | (65.5) | 0 | (0.0) |
| New York State2 | 161 | 36 | (22.4) | 125 | (77.6) | 0 | (0.0) |
| New York City | 445 | 53 | (11.9) | 391 | (87.9) | 1 | (0.2) |
| North Carolina | 159 | 70 | (44.0) | 89 | (56.0) | 0 | (0.0) |
| North Dakota | 10 | 3 | (30.0) | 7 | (70.0) | 0 | (0.0) |
| Ohio | 130 | 35 | (26.9) | 88 | (67.7) | 7 | (5.4) |
| Oklahoma | 67 | 34 | (50.7) | 33 | (49.3) | 0 | (0.0) |
| Oregon | 67 | 15 | (22.4) | 52 | (77.6) | 0 | (0.0) |
| Pennsylvania | 157 | 39 | (24.8) | 118 | (75.2) | 0 | (0.0) |
| Rhode Island | 8 | 1 | (12.5) | 7 | (87.5) | 0 | (0.0) |
| South Carolina | 67 | 36 | (53.7) | 31 | (46.3) | 0 | (0.0) |
| South Dakota | 16 | 8 | (50.0) | 8 | (50.0) | 0 | (0.0) |
| Tennessee | 113 | 55 | (48.7) | 58 | (51.3) | 0 | (0.0) |
| Texas | 884 | 326 | (36.9) | 553 | (62.6) | 5 | (0.6) |
| Utah | 29 | 7 | (24.1) | 22 | (75.9) | 0 | (0.0) |
| Vermont | 3 | 1 | (33.3) | 2 | (66.7) | 0 | (0.0) |
| Virginia | 169 | 24 | (14.2) | 145 | (85.8) | 0 | (0.0) |
| Washington | 163 | 34 | (20.9) | 129 | (79.1) | 0 | (0.0) |
| West Virginia | 13 | 6 | (46.2) | 7 | (53.8) | 0 | (0.0) |
| Wisconsin | 35 | 13 | (37.1) | 22 | (62.9) | 0 | (0.0) |
| Wyoming | 0 | 0 | … | 0 | … | 0 | … |
1Includes persons born outside the United States (including the U.S. territories), except persons born to at least one U.S. citizen parent.
2Excludes New York City.
Ellipses (…) indicate that the percentage cannot be calculated, and the denominator is 0.