Transportation
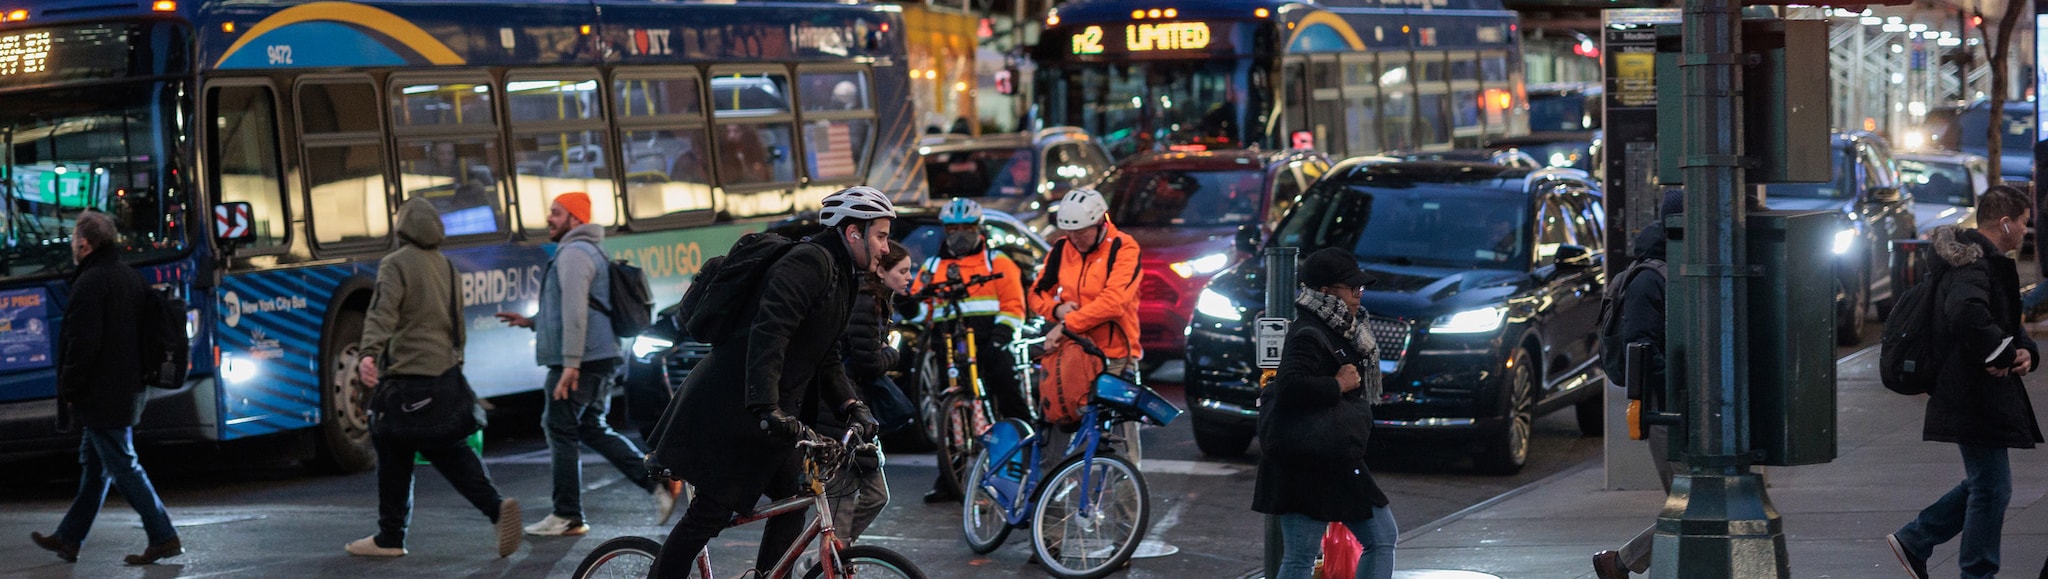
Transportation choices can shape community health by affecting the air quality, traffic safety, and the physical and mental health of its residents.
We Track That
The Tracking Network includes transportation-related data from the U.S. Census Bureau and the U.S. Department of Transportation. These data can help identify the effects transportation may have on our health and environment. They can help us better understand exposures to air pollution from traffic, factors that may play a role in traffic safety, and health benefits of using active transportation options.
Types of Data
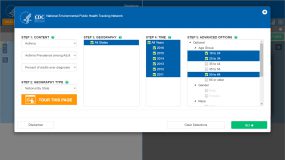
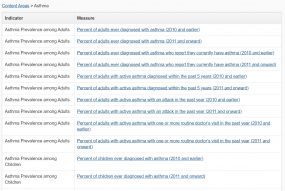
These indicators provide national, state, county, tribal, and census tract level data on commute times, motor vehicle crashes, and transportation types.
This indicator estimates the average one-way commute time for workers and breaks down the number of workers driving, taking public transit, or walking to work.
This indicator displays the number, rate, and location of motor vehicle crashes as well as calculates the percentage of motor vehicle crashes involving cyclists or pedestrians.
Types of Transportation to Work1
These data show the number and percent of people aged 16 years and older in a geographic area who used a specific type of transportation to commute to work.
Footnotes:
1. These data are supplied by the U.S. Census (2020).
2. Data on motor vehicle-related fatalities come from the National Highway Traffic Safety Administration Fatality Analysis Reporting System (FARS). FARS may slightly underestimate the number of fatal crashes by not counting off-the-road fatalities and deaths that occur more than 30 days after the crash.
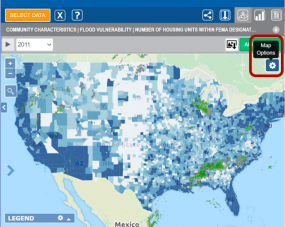
Add layers to any map.
Click on the gear icon to select layers: surface smoke, current radar, transportation noise, active Atlantic cyclones. Try it!
Data in Action
These transportation data can be used to
- demonstrate the impact that changes in commute time can have on related variables, such as air pollution, physical activity, and traffic safety over time.
- support additional resources or behavior change to reduce motor vehicle crash fatalities, especially among groups more likely to have serious outcomes, like pedestrians and bicyclists.
- identify communities that have more walking, bicycling, and public transportation trips that can serve as an example to model policies and provisions to promote active and public transportation.
- advocate for resources, transportation infrastructure, and behavior change to increase walking, bicycling, and public transportation use among commuters.